36(2), Summer 2017, pp. 103-128- ISSN: 2008-8191
DOI: 10.22099/jtls.2017.23918.2154
Investigating the Impact of Response Format on the Performance of Grammar Tests:
Selected and Constructed
Farzaneh Mozaffari PhD Candidate University of Tehran
S. MohammadAlavi Professor University of Tehran
[email protected] Abbasali Rezaee
Associate Professor University of Tehran [email protected]
Abstract
When constructing a test, an initial decision is choosing an appropriate item response format which can be classified as selected or constructed. In large-scale tests where time and finance are of concern, the use of response chosen known as multiple-choice items is quite widespread. This study aimed at investigating the impact of response format on the performance of structure tests. Concurrent common item equating design was used to compare multiple-choice items with their constructed response stem-equivalent in a test of grammar. The Rasch model was employed to compare item difficulties, fit statistics, ability estimates and reliabilities of the two tests. Two independent sample t-tests were also conducted to investigate whether the differences among the item difficulty estimates and ability estimates of the two tests were statistically significant. A statistically significant difference was observed in item difficulties. However, no significant difference was detected between the ability estimates, fit statistics, and reliabilities of the two tests.
Keywords: response format, multiple-choice item, constructed -response item, Rasch model.
Received: 27/12/2016 Accepted: 18/07/2017
To have valid and reliable tests, test writers are obliged to pay close attention to both what of testing and how of testing. In a test based on a syllabus and a curriculum or even in a test of proficiency, what of testing is usually well-defined. However, how to test has always been a dilemma for test constructors and testing authorities. Bachman (1990) presents the how of testing through several facets for the test method and states that test method facets can potentially endanger test reliability and validity. As Bachman (1990, p. 13) argues "random factors, such as temporary fluctuations in test takers' physical condition or mental alertness, and breakdowns in equipment" are not within our control. Some others like personal attributes are controllable in few contexts, and some others like test method facets/characteristics are practically controllable. He suggests that "if we are to interpret test scores as indicators of language abilities, and not of how well an individual can take multiple-choice tests, for example, we need to minimize the effects of test method" (1990, p. 12).
researchers investigate the psychometrics and psychological differences of various item formats.
Although, there are multiple item formats to assess students' knowledge of English language ranging from multiple choice (MC) questions, fill in the blanks, short answer, to essay type questions, one of the most common item formats in second language testing is the MC question which is considered as a reliable and valid testing method (Bleske-Rechek, Zeug & Webb, 2007; Currie & Chiramanee, 2010; Dudley, 2006). This format of testing is commonly used not only in second language testing, but also in standardized tests and classroom assessments for various disciplines in all fields (Haladyna, Downing, & Rodriguez, 2002). The appeal of this format of assessment is not startling, given its ease of administration and scoring and its ability to cover a broad range of topics. On the other hand, some critics of MC items argue that this format of evaluation is ill-suited for assessing higher order thinking since it can only measure examinees’ factual recall (Frederickson, 1984; Morgenstem & Renner, 1984). Moreover, students might get credit for answers that they do not know by process of elimination or by merely guessing (Ebel & Frisbie, 1991; Farr, Pritchard & Smitten, 1990; Thissen & Steinberg, 1984) which may contaminate test scores.
Some suggest the application of constructed response (CR) questions which requires some forms of production and according to Bacon (2003) and Rogers and Harley (1999) tests a deeper understanding of the subject material. This format of assessment is welcome due to its reducing the probability of endorsing the correct answer through guessing and elimination (Gibbs, 1995). However, it has its shortcoming as only relatively a few questions can be included in tests. Therefore, not all materials can be assessed (Ventouras, Triantis, Tsiakas, & Stergiopoulos, 2010). Moreover, its scoring is more subjective and time-consuming (Ventouras et al., 2010) in comparison to MC items.
response format. The application of different response format raises the question of whether and how the use of various response formats might affect the measured construct and to what extent different response formats influence the difficulty of an item. Though this issue has been widely investigated in various disciplines in all fields, the result is somewhat inconclusive.
This study was a scrutiny into one of the test method facets, i.e., item format to shed further light on its impact on the psychometric properties of grammar tests. Before describing the methodology, a review of the related literature is provided.
Literature Review
As it was mentioned, a wide range of item formats has been used in language testing, including multiple-choice, cloze, C-test, summary, gap filling, matching, ordering (Alderson, 2000; Buck, 2001). In order to find out if and to what extent the method affects the measured trait, several researchers (e.g., Currie & Chiramanee, 2010; Dávid, 2007; Dudley, 2006; Kobayashi, 2002; Shizuka et al., 2006; Trujillo, 2005; Frisbie & Druva, 1986, etc.) used multiple methods to measure the same trait and examined whether the use of different methods significantly affects students' scores on the construct. Special attention has also been paid to explore the psychometric and psychological equivalence of MC and CR formats as they could be considered as the dominant formats of assessment. Due to the quantitative nature of the present study, this section provides an overview of the studies that have examined the psychometric properties of these two formats using correlation and mean-differences.
procedure of scoring is not time-consuming, teachers and students could also be provided with feedback relatively soon.
Lukhele, Thissen, and Wainer (1994) proposed that MC items can be used as a substitute for CR questions whose scoring is more subjective and time-consuming. This claim was based on the research which had shown a high correlation between the two formats’ test scores (e.g., Godschalk, Swineford, & Coffman, 1966). In fact, one of the primary methods used to examine the construct equivalence of CR and MC formats involves correlating scores on a CR test with performance on an MC test.
Traub (1993) identified and examined nine studies into trait equivalence of MC and CR formats. Seven of these studies revolved around language tasks in L1 context. He maintained that any attempts to investigate the trait equivalence of different item formats might vary by content domain. He went on to explain that if the test scores were impeccably correlated, they could be considered as congeneric. He further pointed to studies (Ward, Dupree, & Carlson, 1987; van den Bergh, 1990) that suggest MC and CR tests of reading comprehension measure the same trait and cited MC and CR tests measure different characteristics (Ackefinan & Smith, 1988; Quellmalz, Capell, & Chou,1982; Werts, Breland, Grandy, & Rock, 1980) in the area of writing.
Rodriguez (2003) also identified 61 empirical studies that investigated issues related to the construct equivalence of MC and CR items and conducted a meta-analysis to synthesize the research using correlations. He proposed that when the same stem is used, the correlation between the two formats approaches one and is significantly higher than when items on the tests are not stem-equivalent.
due to the limitations associated with using correlations corrected for attenuation.
Several researchers have also used mean-differences to compare MC and CR formats. Shohamy (1984) examined these two formats in L2 reading assessment by their mean differences and suggested that MC items are more accessible than their CR counterparts. Later, Wolf (1993) found significant differences between stem-equivalent MC and CR items and proposed that these two formats might be measuring different constructs. Alternatively, in more recent studies, Elinor (1997) and Trujillo (2005) suggested the same level of difficulty for the two formats in reading assessment. In’nami, (2006) and Teng (1999) also studied MC and CR items in tests of listening and concluded that MC format is more straightforward than CR. Likewise, Cheng (2004) conducted a repeated ANOVA to compare the mean differences of MC, MC cloze and CR scores and found CR listening items more difficult than their stem-equivalent MC items even when the examinees were allowed to use their native language.
The studies above illustrate that research conducted on the MC and CR have provided some insights into the underlying effect of response format on test performance and score interpretation. However, there remain missing parts of the test method facets puzzle that have yet to be fitted into place.
one test to another. However, the ability scores used in Item Response Theory models are examined independent and therefore "their ability scores remain invariant over various tests that might be used to measure the construct" (Hambleton & Jones, 1993). Moreover, classical test theory models are sample dependent which reduces their utility. Despite the merits that item response models have over traditional test theory models, there is no study comparing CR and MC items based on Item Response Theory. Hence, the present study applied a model of Item response theory, namely Rasch model, to move beyond the limitations of classical test theory.
Research Questions. This study was an inquiry into the impacts of response formats, namely constructed or selected on test performance. To do so, the following questions are posed:
1. Is there any statistically significant difference in the item statistics of alternative item formats of grammar?
2. Is there any statistically significant difference in the overall ability estimates of the examinees based on their responses to alternative item formats of grammar?
3. Is there any significant difference in the overall person reliability of alternative item formats of grammar?
4. Is there any significant difference in the overall item reliability of alternative item formats of grammar?
Method Participants
and the remaining 473 participants were female. The participants' ages ranged from 26 to 52 (M = 32.4, SD = 5.7).
Instrument
A prerequisite for PhD applicants of almost all universities of Iran is to provide the authorities with a score in an English proficiency test. As a regulation, the candidates will not be allowed to sit for their PhD comprehensive exam unless they present the criterion score. University of Tehran English Proficiency Test (UTEPT) which is administered by the language testing center of the University of Tehran every two months is one of such proficiency tests. The test aims at identifying those individuals who have the required level of English proficiency. It is composed of three sections including Grammar, Reading, and Vocabulary.
The focus of this study is in the grammar section of this exam which was constructed by the researchers. To construct the items, first, the main grammatical issues assessed in proficiency tests like TOFEL, MCHE, and PET were extracted to be used as the focus of item construction. Based on the identified grammatical points, a pool of 37 items was written.
Eight English teachers were asked to take the test and examine item effectiveness and identify any problems with the understanding and interpretation of the stems. The items underwent minor revisions, and seven questions were excluded. The test, consisting 30 items, was piloted using 32 advanced English learners who were PhD candidates at different universities of Iran and had recently taken UTEPT. It served to detect any problems with the interpretation and understanding of the stem wordings as well as finding the suitable distractors for MC items.
CR test and the researchers' judgment. So the MC stem-equivalent items were also prepared.
To calibrate the items on the same scale, 10 MC error identification questions were also added to the pool. These items served as "link" items that aid in test equating.
The items in different formats examined the same content to allow a focus on a particular format and share the same stem. In MC items, examinees were required to choose the correct answer, and in the CR questions, they were supposed to construct and write their answers.
The data was collected through two administrations of UTEPT. In the first administration 30 MC items were conducted and in the second one 30 CR items were administered. In each of these two administrations, 10 MC error identification items, serving as common items, were repeated.
To analyze the data, WINSTEPS (Linacre, 2016) version 3.92.1 was used.
Results and Discussion Preliminary Analysis
Table 1 presents the descriptive statistics for the MC and CR tests both of which were made up of thirty items. The mean of MC test shows that this format may have been accessible for many of the participants.
Table 1.
Descriptive Statistics for the MC and CR Tests
Item format n Mean Median Std.
Deviation
Std. error mean
MC 635 23.35 21 5.08 .837
CR 702 13.68 10 4.43 .788
n: number of persons
this purpose, a graphical check was carried out on the common item estimates in the separate analyses. The difficulty estimates of the common items from these separate calibrations of the two forms were cross-plotted on the x and y-axes, and quality control lines were drawn to check the closeness of the item parameter estimates. The slopes of the best fit line were near 1.00, indicating that all ten items could satisfactorily serve as anchor items to bring the two forms into a common scale. These items were excluded from later analyses.
The results indicated that all items fit fairly well with the model; the infit statistics for all items were between 0.7 and 1.3 as suggested by Bond and Fox (2007). In order to check the unidimensionality, Winsteps runs a Principle Components Analysis of the data. The result of PCA analysis showed that the Rasch modeled dimension explained 24.6 eigenvalues (accounting for 26.0% of the total variance) while the first contrast accounted for 1.89 eigenvalues in the residuals (explaining 2.0% of the total difference). An examination of the items contributing most to the first contrast showed that almost all of them had fit statistics less than 1.0. This indicated that the amount of variance explained by the first contrast might be interpreted as "the local intensification of the Rasch dimension, rather than a contradictory dimension” (Linacre, 2016, p. 560).
Local independence was also checked by analyzing the standardized residual correlations reported in Winsteps. The most significant correlation was between two CRT items, and that amounted to a correlation of only .28 indicating that the two items shared only 7 percent of their variance. Thus, local independence holds in the data.
Main Analysis
In the following section, the analysis of item and person statistics and their reliability indices are presented.
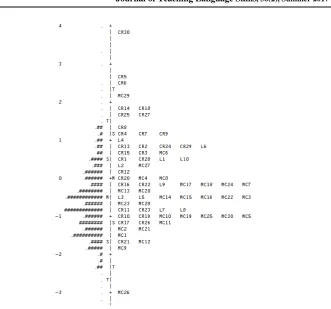
item-person map which is known as the Wright map- named after Benjamin Wright (Wilson, 2005). To have a general overview of items and persons, the item-person map for the present data is provided in Figure 1. It depicts items and persons jointly on a common scale and shows that the difficulty of the test almost matched the persons’ ability. The vertical line is the interval scale of logits- the measurement units common to both persons and items. The left column shows the distribution of persons from the ablest at the top to the least able at the bottom and the right column in the figure shows the distribution of items from the most difficult at the top to the least difficult at the bottom. Therefore, item CRT30 is the most difficult item while item MC26 is the least difficult one.
The “M” on the left side indicates the approximate location of the respondent’s mean and on the right side shows the mean item measure which is set automatically to be 0.00 by Winsteps. As Figure 1 indicates the mean of the persons is lower than the mean item measure.
Figure 1. Wright map of the order of items and persons
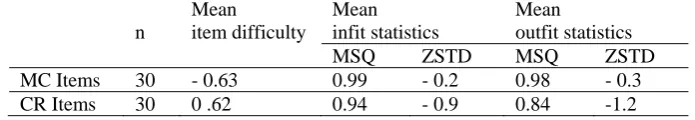
Comparison of Item Statistics across Item Formats. To compare item difficulty estimates and fit statistics across the two forms, mean values of difficulty estimates and item fit statistics were calculated and reported in Table 1. The root means square error (RMSE) value, representing the mean of the standard error of item parameter estimates, was 0.11 and 0.14 for MC and CR items respectively indicating that item parameters in two forms were estimated with almost the same precision.
sciences, it is quite likely that overfit will have no practical implications at all” (p. 240). Mike Linacre (personal communication) also suggested that overfitting rarely caused measurement problems. Even if one applies Linacre (2016) recommended values (0.5-1.5), this item is considered as "productive for measurement." Table 2 shows that the mean of infit and outfit mean squares of both item formats are also very close to the Rasch-modeled expectations of 1.
Satisfactory fit indices showed that both MC and CR items in both formats were performing well for the targeted examinees. Relatively good outfit indices also indicated that both item formats do not bear redundant or irrelevant items.
Table 2.
Item Statistics for the Two Item Formats
n
Mean item difficulty
Mean infit statistics
Mean outfit statistics
MSQ ZSTD MSQ ZSTD
MC Items 30 - 0.63 0.99 - 0.2 0.98 - 0.3
CR Items 30 0 .62 0.94 - 0.9 0.84 -1.2
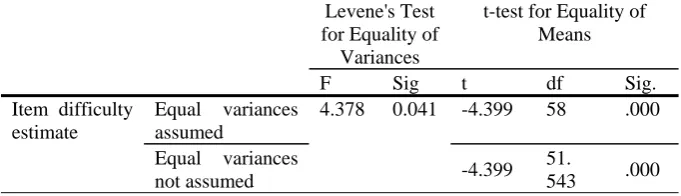
Table 3.
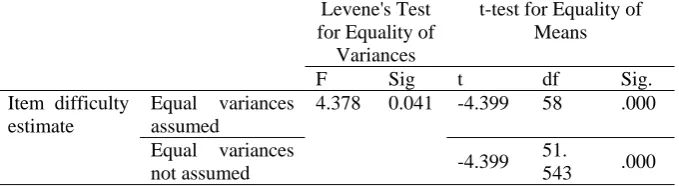
Independent Samples T-Test for Item Difficulty
Levene's Test
for Equality of Variances
t-test for Equality of Means
F Sig t df Sig.
Item difficulty estimate
Equal variances assumed
4.378 0.041 -4.399 58 .000
Equal variances
not assumed -4.399
51.
543 .000
To investigate whether the differences between the mean item difficulty estimates of the two item formats were statistically significant, an independent test was conducted. As reported in Table 3, results of t-test revealed that there was a significant difference in the mean item difficulty estimates of MC and CR items (t (51.54) = -4.399, p = .000). The magnitude of the differences in the means was about 0.24 which according to Cohen (1988) is a large effect size.
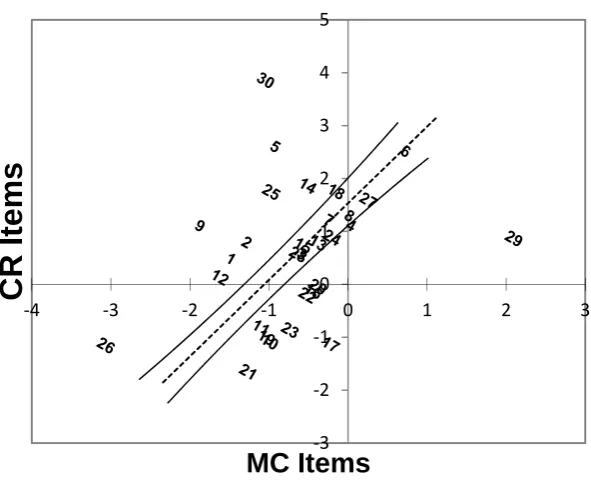
Thus, it can be concluded that the kind of response for grammar test items has a notable impact on the performance of the items. Besides, to give a more vivid image of the difference between item estimates of MC and CR items, their difficulty estimates are cross-plotted.
Figure 2. Scatterplot of item parameters from MC items against CR items
Item separation and item reliability indices were also calculated for MC and CR items. The results are given in Table 4. Item separation indicates “the number of statistically distinct regions of item difficulty that the persons have distinguished” (Smith, 2001, p. 293). Item reliability is not estimable within the framework of CTT. The item reliability estimates obtained through the Rasch model roughly indicate the confidence we can have that the same order of item difficulties will be obtained upon a recalibration of the items with another sample of examinees. As mentioned in Table 3, there is no notable difference in item reliability values of MC and CR items. Similarly, the item separations of the two items which checked the representativeness of the items are close to each other. The minimum value for item separation which is also known as item strata is 2. Hence, both MC and CR items enjoy an excellent item separation.
‐3
‐2
‐1 0 1 2 3 4 5
‐4 ‐3 ‐2 ‐1 0 1 2 3
CR Items
Table 4.
Item Separation and Reliability for the MC and CR Items Item format n Item Separation Reliability of Items
MC items 10 7.82 .98
CR items 10 8.68 .99
n= number of items
A comparison of standard deviations of person ability parameters between the two item formats as depicted in Table 5 shows a minor discrimination power tests with different kinds of item formats.
Table 5.
Standard Deviations of Person Ability Parameters in MC and CR Items
Item Format n Standard Deviation
MC items 635 0.91
CR items 702 0.98
n= number of persons
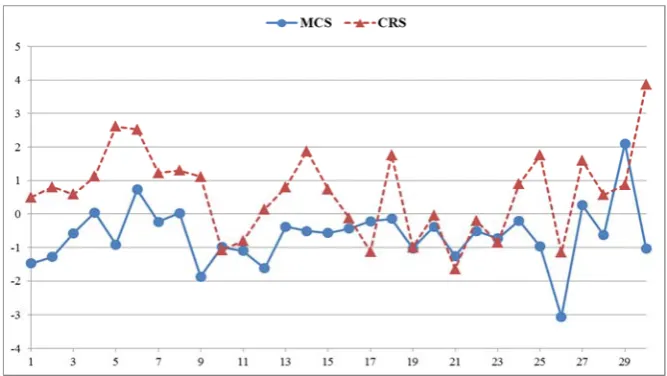
In order to inspect the behavior of individual items within each item format, item difficulty estimates for each format concerning kinds of response was plotted onto a graph.
As Figure 3 illustrates and also mentioned above comparing item difficulties for each item pair suggests that the multiple-choice format which requires selected response tend to be easier than the constructed response which requires the examinees to produce a response. The difficulty estimates of most of the CR items are higher than their MC counterparts. This finding is consistent with that of previous studies which have found items in MC format to be significantly easier than CR versions of the same items (Cheng, 2004; Currie & Chiramanee, 2010; In’nami & Koizumi, 2009; Tsagari, 1994).
Researchers propose that the difference in MC and CR item difficulty may in part be due to "unintended corrective feedback" which is given to test takers when the answer they want to give to an MC items is not one of the options thus providing a cue that their answer is not the correct one (Bridgeman, l992; Currie & Chiramanee, 2010; Katz, Bewrett & Berger, 2000). Previous studies have also suggested that these differences may be attributed to certain test-taking strategies that the examinees used (Bridgeman, 1992). Working backward from the response options is one of these strategies. It involves plugging each response option into the item stem to determine which option is the correct answer. The other test-taking strategy that may contribute to MC items being easier than CR items is response elimination through which the test taker evaluate the response options and eliminate the incorrect ones.
Moreover, the relevant literature suggested that the examinees may use cued recall to respond to MC items correctly (Currie & Chiramanee, 2010). It is also evident that in the MC items the possibility of endorsing the correct answer by guessing increases as the examinee can eliminate one or more distractors and choose from the rest of options.
these misfitting persons had unexpected behavior. It means that they had responded correctly to items with difficulty levels higher than their ability levels, or they had failed to answer easy items with difficulty levels lower than their ability levels. These person outfit indices are indicative of behaviors like guessing and carelessness. The response patterns of misfit persons were examined, and since no trend was found out, it was concluded that the kind of response has no significant impact on person response behaviors. Hence, the type of response does not notably impact person statistics.
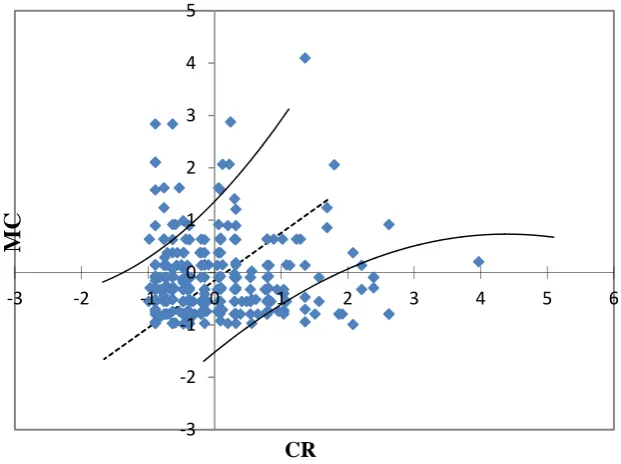
If the two item formats are unidimensional, then the person ability estimates obtained from these item formats should be the same (within measurement error). In technical parlance, we would say that the ability estimates are perfectly invariant. The cross-plot of the ability estimates obtained from MC items and CR items is presented in Figure 4.
Figure 4. The Cross plot of Ability Estimates of MC and CR Format ‐3
‐2
‐1 0 1 2 3 4 5
‐3 ‐2 ‐1 0 1 2 3 4 5 6
MC
Perfect measurement invariance never happens in practice because measure error is ubiquitous in behavioral measurement. Therefore, a confidence interval is defined by the identity line in Figure 4 that the amount of departure from the identity line that is attributable to measurement error. Since some examinees received identical ability scores on MC and CR items, some marks in the figure may represent more than one participant. It is evident from Figure 4 that some ability estimates fall outside the confidence interval. Participants located on the outside upper left side of Figure 4 are examinees whose estimated ability levels on CR items are lower than their ability estimates on MC items. On the other hand, participants on the outside of the right confidence band are those with higher estimated ability on CR items than MC ones. As a result, it may be concluded that the measurement invariance fails in this case. Precisely, the different items are not measuring the same attribute.
An independent sample t-test was run to check whether the difference between ability estimates is statistically significant. The result indicates that there was not any statically substantial difference in mean ability estimates of examinees who have taken CR and MC items (t (1321.63) = 0.295, p = 0.76).
Table 6.
Independent Samples T-Test for Ability Estimates
Levene's Test
for Equality of Variances
t-test for Equality of Means
F Sig t df Sig.
Item difficulty estimate
Equal variances assumed
4.378 0.041 -4.399 58 .000
Equal variances
not assumed -4.399
51.
543 .000
indicates that these differences are not statically significant. Therefore, the response format does not have a notable impact on ability estimates.
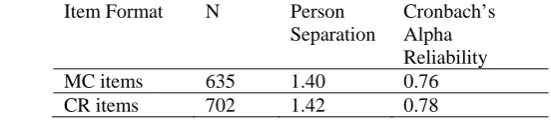
Test Reliability. Person reliability and person separation were compared as indicated in Table 7. The person reliabilities are similar to the CTT reliability estimates. They indicate the ratio of systematic variance to the total variance. Person separation is an indicator of the number of ability strata that a test can distinguish. As Table 7 shows, person separation index of the item formats is close to each other. The Cronbach’s Alpha reliability indices of the two formats are also almost the same.
Table 7.
Reliability and Person Separation Indices for MC and CR Items
Item Format N Person
Separation
Cronbach’s Alpha Reliability
MC items 635 1.40 0.76
CR items 702 1.42 0.78
n= number of persons
Conclusion
The present study was a scrutiny into the impact of the kind of response on test performance. Thirty MC grammar items and 30 CR grammar items were administered as part of UTEPT. The two forms were linked using ten anchor items. An analysis of the score was carried out using Winsteps to obtain person ability and item difficulty estimates. For the analysis, the two item formats were combined and treated as a single dataset containing 70 items which 10 of them act as linking items. This enabled the scores of both item formats to be placed on the same scale. Mean item difficulty estimates for each item format were then used as an initial broad indicator of differences in item difficulty.
their stem-equivalent CR counterparts. Previous response format studies (Bridgeman, 1992; Cheng, 2004; Shohamy, 1984) found similar differences among MC and CR items in English language assessment as well as other content domains. These researchers have found out that subjects performed better on MC items than on CR ones, proposing that questions which require only recognition are less demanding than those requiring production.
Despite their influences on item difficulty, the two different response formats seem to measure the same proficiency. Almost all items show a good fit for the Rasch model, which requires a unidimensional latent trait. These findings also coincide with previous results (Thissen et al., 1994). Thus, changing the response format does not alter the measured construct or impact the person statistics but can impact item difficulty.
However, it does not mean that one item format is superior and must be preferred over another. In fact, when MC and CR items are compared, it is evident that each of them has its advantages and disadvantages. Sometimes the best policy decision is not using only one of them; a combination of item formats may yield a better outcome. As Messick (1993) contends assessment that employs a combination of response formats can enhance their respective positive features and decrease their liabilities.
As the process of all research faces some limitations, the present study might also suffer from some. This study focuses only on the impact of test method facets while other factors like learner variables might interfere and affect the result of the study. That is, in the absence of empirical evidence, it is not clear whether the differential performance of the tests is due to alternative item formats or is due to the effect of some of learners’ individual characteristics such as their learning styles or their level of proficiency. Therefore, the impact of factors like gender and level of proficiency is of the essential untouched issues in this study.
empirical evidence to explain why these differences occur. Therefore, an attempt can be made to investigate more deeply cognitive processes elicited by different item formats to shed more light on the real source of difficulty and easiness of different item formats. The examination of item formats effect on the cognitive process should be scrutinized to bring to light whether specific processes are more likely to lead to correct responses in either format. For example, it would be essential to know if the higher-level constructive thinking process were more associated with correctly answering CR questions or with correctly answering MC questions.
References
Ackerman, T.A., & Smith, P. L. (1988). A comparison of the information provided by essay, multiple-choice, and free-response writing tests.
Applied Psychological Measurement, 12(2), 117- 128.
Bacon, D. R. (2003). Assessing learning outcomes: A comparison of multiple-choice and short-answer questions in a marketing context.
Journal of Marketing Education, 25(1), 31-36.
Bachman, L. (1990). A fundamental consideration in language testing. Oxford: Oxford University Press.
Baghai, P. (2010). Test score was equating and fairness in language assessment. Journal of English Language Studies, 1(3), 113-128. Bensoussan, M. (1984). A comparison of cloze and multiple- choice
reading comprehension tests of English as a Foreign Language.
Language Testing, 1(1), 101-104.
Bleske-Rechek, A. Zeug, N., & Webb, R. M. (2007). Discrepant performance on multiple-choice and short answer assessments and the relation of performance to general scholastic aptitude.
Assessment and Evaluation in Higher Education, 32(2), 89-105. Bond, T. G. & Fox, C. M. (2007). Applying the Rasch model: Fundamental
measurement in the human sciences. Lawrence Erlbaum.
Bridgeman, B. (1992). A comparison of quantitative questions in
open-ended and multiple-choice formats. Journal of Educational
Measurement, 29(3), 253-271.
Cheng, H. F. (2004). A Comparison of multiple-choice and open-ended formats for the assessment of listening proficiency in English.
Currie, M.,&Chiramanee, T. (2010).The effect of the multiple-choice item format on the measurement of knowledge of language structure.Language Testing, 27(4), 471–491.
Dávid, G. (2007). Investigating the performance of alternative types of grammar items. Language Testing, 24(1), 65–97.
Dudley, A. (2006). Multiple dichotomous-scored items in second language testing: Investigating the multiple true-false item types under norm-referenced conditions. Language Testing, 23(2) 198-228.
Ebel, R. L., & Frisbie, D. A. (1991). Essentials of educational measurement (5thed.). Englewood Cliffs, NJ: Prentice-Hall.
Elinor, S. H. (1997, May). Reading native and foreign language texts and tests: The case of Arabic and Hebrew native speakers reading L1 and English FL texts and tests. Paper presented at the Language Testing Symposium, Ramat-Gan, Israel. (ERIC Document Reproduction Service No. ED412746)
Farr, R., Pritchard, R., & Smitten, B. (1990). A description of what happens when an examinee takes a multiple-choice reading comprehension test. Journal of Educational Measurement, 27, 209– 226.
Frederickson, N. (1984). The real test bias: Influences of testing on teaching and learning. American psychologist, 39, 193-202.
Frisbie, D.A., & Druva, C.A. (1986).Estimating the reliability of multiple true-false tests. Journal of Educational Measurement 23, 99–105. Gibbs, W. J. (1995). An approach to designing computer-based evaluation
of student constructed responses: Effects on achievement and instructional time. Journal of Computing in Higher Education, 6(2), 99-119.
Godschalk, F. I., Swineford, F., & Coffman, W. E. (1966). The measurement of writing ability. New York: College Entrance Examination Board.
Haladyna, T.M., Downing, S. M., & Rodriguez, M. C. (2002). A review of multiple-choice item-writing guidelines for classroom assessment. Applied Measurement in Education 15, 309–34.
Hambleton, R. K. & Jones, R. W. (1993). Comparison of classical test theory and item response theory and their applications to test development. Educational Measurement: Issues and Practice, 12
In’nami, Y. (2006). The effects of task types on listening test performance: A quantitative and qualitative study. Unpublished doctoral dissertation, University of Tsukuba, Japan.
In'nami, Y.,& Koizumi, R. (2009). A meta-analysis of test format effects on reading and listening test performance: Focus on multiple-choice and open-ended formats. Language Testing, 26 (2), 219–244. Katz, L., Bennett, R.E. & Berger, A.E. (2000). Effects of response format
on the difficulty of SAT-Mathematics items: It's not the strategy.
Journal of Educational Measurement, 37(l), 39-57.
Kobayashi, M. (2002). Method effects on reading comprehension test performance: Text organization and response format. Language Testing, 19, 193–220.
Linacre, J.M. (2016). A User's Guide to WINSTEPS®. Retrieved July 7, 2016, from http://www.winsteps.com/
Lord, F. M. (1953). The relation of test score to the trait underlying the test. Educational and Psychological Measurement, 13, 517-548. Lukhele, R., Thissen, D., & Wainer, H. (1994). On the relative value of
multiple-choice, constructed-response, and examinee-selected items on two achievement tests. Journal of Educational Measurement, 31, 234–250.
Messick, S. (1993). Trait equivalence as construct validity of score interpretation across multiple methods of measurement. In R. E. Bennett & W. C. Ward (Eds.), Construction versus choice in cognitive measurement: Issues in constructed response, performance testing, and portfolio assessment (pp. 61-73). Hillsdale, NJ: Lawrence Erlbaum Associates, Inc.
Morgenstem, C. F. & Renner, J. W. (1984). Measuring thinking with standardized tests. Journal of Research in Science Teaching, 21, 639-648.
Quellmalz, E. S., Capell, F.J.& Chou, C.P. (1982). Effects of discourse and response mode on the measurement of writing competence. Journal of Educational Measurement, 19(4), 241-258.
Rodriguez, M. C. (2003). Construct equivalence of multiple-choice and constructed-response items: A random-effects synthesis of correlations. Journal of Educational Measurement, 40, 163–184. Rogers, W., & Harley, D. (1999). An empirical comparison of three-and
internal consistency reliability. Educational and Psychological Measurement, 59 (2), 234.
Shizuka, T., Takeuchi, O., Yashima, T., &Yoshizawa, K. (2006). A comparison of three- and four-option English tests for university entrance selection purposes in Japan. Language Testing, 23, 35-57. Shohamy, E. (1984). Does the testing method make a difference? The case
of reading comprehension. Language Testing, 1, 147- 170.
Smith, E. V. Jr. (2001). Evidence for the reliability of measures and validity of measure interpretation: A Rasch measurement perspective. Journal of Applied Measurement, 2(3), 281-311.
Teng, H. C. (1999). The effects of question type and preview on EFL listening assessment. Paper presented at the American Association for Applied Linguistics. (ERIC Document Reproduction Service No. ED 432920)
Thissen, D., & Steinberg, L. (1984). A response model for multiple choice items. Psychometrika, 49, 501-519.
Tversky, A. (1964). On the optimal number of alternatives at a choice point. Journal of Mathematical Psychology, 1, 386–391.
Trujillo, J. L., (2005). The effect of format and language on the observed scores of secondary-English speakers" (2005). Electronic Theses, Treatises, and Dissertations. Retrieved form
http://diginole.lib.fsu.edu/etd/1509
Traub, R. E. (1993). On the equivalence of the traits assessed by multiple-choice and constructed response tests. In R. E. Bennett & W. C. Ward (Eds.), Construction versus choice in cognitive measurement: Issues in constructed-response, performance testing, and portfolio assessment (pp. 29-44). Hillsdale, NJ: Lawrence Erlbaum.
Van den Bergh, H. (1990). On the construct validity of multiple-choice
items for reading comprehension. Applied Psychological
Measurement, 14(1), 1-12.
Ventouras, E., Triantis, D., Tsiakas, P., & Stergiopoulos, C. (2010). Comparison of examination methods based on multiple-choice questions and constructed-response questions using personal computers. Computers & Education, 54(2)455-461.
Werts, C.E., Breland, H.M. Grandy, J., & Rock, D.A. (1980). Using longitudinal data to estimate reliability in the presence of correlated
errors of measurement. Educational and Psychological
Measurement, 40 (l), 19 -29.
Wilson, M. (2005).Constructing measures: An item response modeling approach. London: Lawrence Erlbaum Associates.
Wolf, D. F. (1993). A comparison of assessment tasks used to measure FL
reading comprehension. The Modern Language Journal, 77,