http://www.sciencepublishinggroup.com/j/hep doi: 10.11648/j.hep.20170202.12
Economic Analysis of Household Waste Generation,
Disposal and Management in Umuahia Metropolis, Abia
State, Nigeria
Igwe Kelechi Chima, Mgbasonwu Vincent Nwabinye
Department of Agricultural Economics, Michael Okpara University of Agriculture Umudike, Umudike, Nigeria
Email address:
nwabinye@gmail.com (Mgbasonwu V. N.)
To cite this article:
Igwe Kelechi Chima, Mgbasonwu Vincent Nwabinye. Economic Analysis of Household Waste Generation, Disposal and Management in Umuahia Metropolis, Abia State, Nigeria. International Journal of Health Economics and Policy. Vol. 2, No. 2, 2017, pp. 47-56. doi: 10.11648/j.hep.20170202.12
Received: January 16, 2017; Accepted: January 25, 2017; Published: February 21, 2017
Abstract:
Nigeria (particularly in urban areas) is facing increased difficulties in managing their municipal solid waste (MSW) effectively and economically. This study examines the household waste generation, disposal and management within Umuahia Capital Territory of Abia State, Nigeria. It aims to assess household waste disposal and management options, examine household waste generation rate and determinants, and also the household waste disposal, and management charges. This research is based on Value-Belief-Norm (VBN) [37] theory of support for social movements: The case of environmental concern. This research assumes that if the residents in Umuahia city care about the other people within the same environment they will be concerned about environmental conditions that threaten the other people’s health or well-being. The data collection is in stages, using an interview and field observations and questionnaires. To determine the quantity of waste generated in the city a total of 100 reading at 10 locations were taken. The total waste generated by households was divided by the number of days the wastes are kept before measurement gives the average waste generation by household per day. The household quantity of waste generated and the number of persons per household gave the per capita generation. Using this method, the quantity of generation in Umuahia metropolis, Abia State, Nigeria was 0.53/kg/day, on the average. The qualitative data was analyzed descriptively, while the quantitative data was analyzed using household budget constraint and multiple regression models. Bases on the finding it was observed that income, educational level were positively significant at 1%. While household size was negatively significant at 1% level. It was found out the unit pricing on municipal waste charges is the best alternative to the current flat rate that are in practice in the state. Therefore the following strategies were recommend: Accurate enumeration of Umuahia metropolis; Provision of standard dustbins for households; Introduction of door-to-door collection of waste; Delineation of the city into manageable zones for effective coverage and management; Enforcement of environmental law; and Embarking on an aggressive campaign to educate the populace on environmental management.Keywords:
Household Waste, Generation, Disposal, Management, Pay-As-You-Throw, Policy, Environmental Sustainability1. Introduction
The issue of waste management, its generation and the means of disposal need to be given a priority attention given increasing population and its attendants demand on household revenue use. As the world hustle towards urban future the amount of municipal waste, one of the most important by-product of an urban life style, now continue to grow even faster than the rate of urbanization [23]. With population growth continue to be on the increase, issue of
mismatch between the rate of waste generation, disposal and management [29].
Waste is part of the economy; it is a by-product of economic activity, by businesses, government and households. Waste is also an input to economic activity – whether through material or energy recovery. The management of that waste has economic implications; for productivity, government expenditure, and, of course, the environment. The decisions of consumers in demanding goods and services which lead to waste impact not only on the environment, but also on the level of government spending required by local authorities to collect and manage household waste. Natural resources are vital for securing economic growth and development not just today but for future generations [7]. Waste policy is a key part of ensuring that raw materials are used efficiently. However, failure to fully account for their value in economic decisions means that these resources are over-consumed. This, in turn, poses risks to long-term economic growth. For example, we can assume that without proper waste management the environment cannot support the desired level of economic activity.
Therefore to create an imperative for shifting to an environmentally sustainable growth path, and eventually to a green economy place the need for this research. Sustainable development is most often defined as ‘development that meets the needs of the present without compromising the ability of future generations to meet their own needs’ [10, 11]. This calls for management of the environment as it affects waste management. There are a number of poorly articulated programmers, rules and legislations which when reviewed and analyzed may help to reveal the directions as well as the limitations of environmental and natural resource management. Thus, the goal of sustained development and healthy economic growth inherently requires careful attention to the environment which includes proper management of solid waste. The awareness of effective solid waste disposal options would definitely help to reduce environmental degradation [14, 33]. Nigerian populace, both in urban and rural areas, no matter their socio-economic status, need to be sensitized to waste management issues and problems. In fact
today's waste is considered as tomorrow's raw material. Proper disposal and utilization of waste is of Global concern to solve environmental problems. It has been noted that environmental problems like solid waste disposal begin with people as the cause and end with the people as victims [38]. Although development is necessary for man, it should be sustainable.
Household waste generation in most Nigerian cities has increased prodigiously and management remains one of the most daunting environmental sanitation challenges facing more states in Nigeria particularly Abia State and it has continually remained at a decreasing rate despite huge government investment in the sector. In view of the fact that natural environment plays an important role in supporting economic activity, both directly, by providing resources and raw materials such as water, timber and minerals that are required as inputs for the production of goods and services; and indirectly, through services provided by ecosystems. There is the need to set out key principles for public policy interventions in waste. This study provides general guidance to ensure that every household access to suitable sanitary method of waste generation, disposal and management. It provides a framework in which to think about when intervention by Government might be desirable, as well as what type of policy intervention is appropriate in the study area.
2. Methods
2.1. The Theoretical Model
This research is based on Value-Belief-Norm (VBN) theory of environmentalism [36, 37]. It offers what we believe to be the best explanatory account to date of a variety of behavioral indicators of non-activist environmentalism. The theory links value theory, norm-activation theory, and the New Environmental Paradigm (NEP) perspective through a causal chain of five variables leading to behavior: personal values (especially altruistic values), NEP, AC and AR beliefs about general conditions in the biophysical environment, and personal norms for pro-environmental action.
Source: Toward a Coherent Theory of Environmentally Significant Behavior, pp. 412. [35, 36, 37]
A schematic representation of variables in the VBN theory of environmentalism. Arrows represent postulated direct effects. Direct effects may also be observed on variables more than one level downstream from a causal variable. The VBN theory postulates that the consequences that matter in activating personal norms are adverse consequences to whatever the individual values (AC). Thus, people who value other species highly will be concerned about environmental conditions that threaten those valued objects. This research assumes that if the residents in Umuahia city care about the other people within the same environment they will be concerned about environmental conditions that threaten the other people’s health or well-being.
2.2. The Data
The data used in this study were obtained from Umuahia North, the capital city of Abia State, located in Southeast, Nigeria. Umuahia North is made up of Ibeku villages called Amuzukwu to the north, Afaraukwu to the south, Nkata to the east Ohokobe Ndume to the Southeast, then Osaah and Ugwunchara and Emede villages to the west. It is one of the commercial cities in the state. Geographically, Umuahia North is located within Latitude 5° 29.5′ to 5° 42′ N and Longitude 7° 24.3′ to 7° 34.7′ E within the forest belt. Stratified random sampling technique was used in selection of ten respondents from each of the ten sampling areas (Afaraukwu Community; Amuzukwu Community; Uwalaka Street; World Bank Housing Estate Community; Ndume Community; Low Cost Housing Estate Community; Ossah Community; Lagos street; Isieke Community and Agbo-ama Housing Estate), giving a total of hundred respondents from the household sampling population.
And also from the regulator was a purposive selection of five respondents each from the two samples to give ten respondents. This gives a sum total of one hundred and ten respondents from the study area. Information were collected on socio-economic characteristics of the households, information on waste generation by types, waste disposal practices (e.g. throwing in street, river, burning etc.), door-to-door collection systems, household size, monthly fee for waste disposal, Family income, education level, the problem of waste generation, disposal and management in Abia State, were among the questions asked. Nigeria. In depth interviews (questionnaires inclusive) was also used to get the necessary data from Abia State Environmental Protection Agency (ASEPA) and the Ministry of Environment Abia State. The households were visited twice to complete the questionnaire. On the first day socio-economic information was collected and households were being requested to deposit their wastes generated within the period. On the next day the wastes were weighed and recorded. The questions were filled by visiting the selected households from January to October 2014.
2.3. Empirical Model
To examine the relationship between household and
regulator (Ministry of Environment/ASEPA) with respect to waste disposal and management charges. This was analyzed using budget techniques (classical economic model) to describe the options of waste disposal available for the household with limited income (or wealth) to allocate among various waste categories generated at household level. Thus the model is:
I =Pa A+ Pb B (1)
This model is important to understand the household budget constraint. It is an accounting identity, not a behavioral relationship. The budget constraint is a given element of the problem household faced. From the concept of consumer’s behavior, household utility is the satisfaction derived from consuming any commodity. By consumption of any commodity, waste is generated, and certain cost is attached to the disposal of this waste by the regulatory agency. These costs depend on the household income. Thus the household in faced with budget constraint.
Suppose after consumption of commodities (A) and waste (B) is generated. The purchase of these commodities and disposed of waste generated are made possible with a given amount of money (Pa and Pb) which depends on the household Income (I) in naira per month. Thus the budget constraint is writing as in equation (1) above to shows that the total amount of money Pa and Pb, used for consumption (A) and disposal (B) must not exceed the income I available to household. For the purpose of this study we assumed that I is completely exhausted. A prior to expectation that when regulator charge is higher than household available income it results to illegal waste disposal and vice versa.
To estimate effect on household if the regulator introduces a variable rate for waste disposal and management charges. In establishing the equilibrium of household the algebra approach can be use to determine the budget line [20];
Given that utility is a measure of consumption, let the household utility function be written as:
U = f(A,B) (2)
Equation 1 expresses the maximizing objective of the household. That is household budget constraint. The equation 2 implies that satisfaction is derived when all income is spent in consumption (A) and disposal charges (B). The standard problem facing household is that of maximizing Equation 1 subject to Equation 2. The average amount of A and B are Pa
and Pb. Therefore in the analysis of the household utility function we will incorporate his budget constraint by combining (1) and (2) to obtain langrage function,
L = U(A,B)+ λ(I- PaA-PbB) (3)
The first other condition (in equation 3) is the partial derivatives with respect to A, B and λ (lambda) equal to zero, thus some important conclusion can be reached, Hence:
Shows the utility derived from consumption, and the disposal charges , Equation 4 is similar to Marginal Rate of Substitution (MRS). In this case there is no degree of substitution between the two expenses and hence, the MRS is undefined that is Perfect Complements [34]. Therefore, there is no tangency condition but the principle idea still remains.
2.4. Determinants of Waste Generation
In this study, to examine the determinants of waste generation rate, regression analysis was used to analyze quantity of waste generation. The model is specified as factor model in Stefan Salhofer [35]. The model considers analyzing factors like income, household size, education etc which describe the processes of waste generation. The major determinants are assumed to be family monthly income (X1), size of the household (X2), educational level (X3), and housing type (X4), extra land area (X5). The model for the waste component is:
W = β0 + β1X1 + β2 X2+ β3 X3 + β4 X4+β5 X5+ µ (5)
Where: W is Quantity of waste per household per day (Kg/day); X1 is Income of the household (N/month.); X2 is Household size (numbers of persons); X3 is Educational status, (in years); X4 is Housing type (number of rooms); X5 is Extra land area (in plot); µ is Error term. While B1 B2 B3 B4 and B5, are the parameters to be estimated. Here household is assumed as a production unit producing wastes. The study were aimed to presents a new approach-system dynamics modeling for the prediction of waste generation in our fast-growing urban area based on a set of limited samples. The waste generation model can use variables that directly or indirectly affect the waste production in a site specific condition. Such variables include socio-economic, climatic, or policy-related factors; in this study we used socio-economic variables. Correlation analysis was carried out, and also the partial correlation between dependent and independent variables. The importance of the explanatory variable depends on the correlation rate.
3. Results
3.1. Responds Socio-economic Characteristics
The socio-economic characteristics of the respondents in this study constituted, educational level, family income, household size, housing type and land area etc. this was analyze using descriptive statistics, frequencies percentages and tables.
Table 1. Distribution of Responds According to their Socio-Economic Characteristics.
Variables Frequency Percentage
Household Size
1 – 4 54 54.0
5-8 41 41.0
9-14 04 4.0
Variables Frequency Percentage
15-19 1 1.0
Total 100 100.0
Educational Level
Primary education 11 11.0
Secondary education 31 31.0
Tertiary education 58 58.0
Total 100 100.0
Occupation
Trading 35 35.0
Farming 20 20.0
Civil servant 21 21.0
Unemployed 14 14.0
Retired 10 10.0
Total 100 100.0
Gender
Male 60 60.0
Female 40 40.0
Total 100 100.0
Monthly Income (N)
Below 5,000 02 2.00
5,001-10,000 01 1.00
10,001-15,000 03 3.00
15,001-20,000 04 4.00
20,001-25,000 06 6.00
25,001-30,000 09 9.00
30,001-35,000 03 3.00
35,001-40,000 25 25.00
40,001-45,000 12 12.00
45,001-50,000 17 17.00
50,000 & Above 20 20.00
Total 100 100.0
Age
25- 35 31 31.00
36-45 45 45.00
46-50 21 21.00
51-55 03 3.00
56-60 01 1.00
Total 100 100.0
Housing Type
Residential 15 15.00
Tenement type 10 10.00
Bungalows 25 25.00
Multistory Flat 11 11.00
Single Story Flat 29 29.00
Industrial 10 10.00
Total 100 100.00
Plot of Land
No responds 3 3.0
1-1.5 55 55.0
2-2.5 28 28.0
3-3.5 10 10.0
4 and above 4 4.0
Total 100 100.0
Source: Field survey, 2014
3.2. Assessment of Household Waste Disposal and Management Practices
Table 2. Household Waste Disposal and Management Practices.
Variables Frequency Percentage
Duration of Waste Generation (Days)
1-2 55 55.0
3-4 34 34.0
5-6 4 4.0
7 and above 4 4.0
No response 3 3.0
Total 100 100.0
Equipment for Waste Storage
ASEPA Bin Collection 22 22.00 Personal Bin Collection 38 38.00
Garbage Bags 22 22.00
Open dump/Thrown away 16 16.00
No responds 02 2.00
Total 100 100.00
Waste Disposal Methods
ASEPA Sanitary Dust Bin 52 52.0 ASEPA door-to-door Collection 0 0.0
Burning 13 12.0
Open Dump 35 35.0
Total 100 100.0
Method of Liquid Waste Disposal
Dung pit/Soak away 31 31.00
Premises/Street 21 21.00
Gutter/Road 32 32.00
Anywhere 16 16.00
Total 100 100.00
Method of Excreta Disposal
Flushed toilet 35 35.00
Latrine 28 28.00
Water closet 11 11.00
Nearby bush 15 15.00
Nearby Dumpsite 11 11.00
Total 100 100.00
Source: Field survey, 2014.
3.3. Determinants of Quantity Waste Generation
The household waste generation rate and determinant is presented in Table 3. The table examined the various socio-economic determinants of waste generation rate in the study area. The study assessed the relationship between the socio-economic variables (monthly income, household size, educational level land area and housing type) and the quantity of waste produced by households daily.
Table 3. Regression analysis of determinants of Quantity of Waste Generation in the Study Area.
Variables β T- ratio
Constant -0.089 776
X1= Income 0.494 9.497***
X2= Household size -0.114 -3.235***
X3 = Educational level 0.569 9.574***
X4 = Land area -0.043 -1.230
X5 = Housing type -0.020 -0.648
F-ratio 193.817***
R-square 0.912
R-adjusted 0.907
Source: Field survey, 2014.
3.4. Distribution of Responds According to Waste Generation by Rooms
The disposal charges paid by households according to their number of rooms, and the quantity of waste generated are presented in Tables 4.
Table 4. Distribution of Responds According to Sanitation fees and Waste Generation by Rooms.
Variables Freq. Percentage Fee (N) Total (N) Waste (kg)
Sanitation fees per Rooms
1-3 42 42.0 40-120 3520 264.18
4-6 20 20.0 160-240 3889 179.19
7-9 15 15.0 280-360 4760 168.58
10 & above 11 11.0 400 & above 7560 318.72
Total 100 100.0 - 19280 992.41
Waste Generation by Rooms
Room Total Fees (N) Percentage Waste (Kg) Percentage
1-3 3520 18.26 264.18 26.62
4-6 3889 20.17 179.19 18.06
7-9 4760 24.69 168.58 16.99
10-above 7560 39.21 318.72 32.12
Total 19280 100.00 992.41 100.00
Average 200 - 0.53kg/capita -
Source: Field survey, 2014.
3.5. Assessment of Waste Management Services
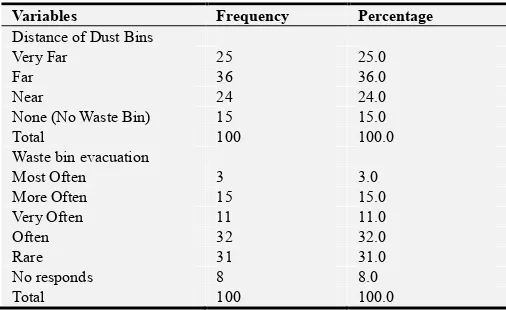
Table 5 illustrate the assessment of the distance of
Table 5. Respondent’s assessment of waste management evaluation.
Variables Frequency Percentage
Distance of Dust Bins
Very Far 25 25.0
Far 36 36.0
Near 24 24.0
None (No Waste Bin) 15 15.0
Total 100 100.0
Waste bin evacuation
Most Often 3 3.0
More Often 15 15.0
Very Often 11 11.0
Often 32 32.0
Rare 31 31.0
No responds 8 8.0
Total 100 100.0
Source: Field survey, 2014
4. Discussion
4.1. Socio-economic Characteristics
From the result table 1, about 54% of the respondents had household size between 1-4, 41% of the respondents had household size between 5-8 members and 4% of the respondents had household size between 15-19 members. This implies that respondents in the study area had moderate household size, not too populated but had a moderate number of members in the family. It indicates that the respondent in the study area are educated. The proportion of the respondent with tertiary education was very high (58.0%), that of secondary education was (31.0%) and primary education was (11%). The occupation of respondents from result of the analysis above, 35% of the respondents were traders, 20% were involved in farming, 21% were civil servants, 14% were unemployed and 10% were retired. This implies that majority of the respondents had the following as their major occupation: Trading, farming and civil service [5]. Gender of respondents could as seen from the table 1 shows that majority of the household head were male (60.0%) while 40.0% were female. This shows the extent to which male traditionally dominate the household in urban areas of Nigeria [26]. The monthly income was not very easy to ascertain from the respondents because of their inability to keep adequate records of their income and fear of being taxed. However, the table shows that majority of the respondents (25.0%) are between the monthly income level of N35,000-N40,000, 17.0% are between N45001- N 50000, and 20.0% were above N50,000. Majority of the of the respondents were in still in their youthful age as 45% of them were within the age bracket of 36 to 45 years, 30% were within the age bracket of 25 to 35 years and 21% were within the age of 46 to 50 years. This further indicates that it takes youths to take precaution of waste disposal and management of the environmental quality [39]. The result indicated that 29.0% of the respondents lived in multistory flat, 25.0% lived in bungalows, 15.0% lived in residential buildings, 10.0% lived in tenement, 11.0% lived in single story flat and 10.0% lived in industrial buildings. The land area of the respondents
above indicated that 55.0% of the respondents had 1 – 1.5 plots of land, 28.0% had 2 – 2.5 plots of land, 10.0% had 3 – 3.5 plots of land, 4.0% had plots of land. This shows that majority (55.0%) of the respondents do not have enough space (1 – 1.5) in their compounds this could influence the waste that are kept in their compound.
4.2. Waste Disposal and Management Practices
The duration of waste generation was assessed across the sample area by determining the number of day(s) households keep their waste before disposal as presented in Table 2 above, it shows that majority of the respondents (55.0%) store their waste between 1-2 days, 34.0% stores waste in 3-4 days. However 4.0% store waste at the range of 5-6 days and more than 7 days respectively. This implies that majority of the residents in the study area disposes their waste on daily bases, thus more waste material is likely to accumulate in the city. Moreover as 4.0% keeps their waste for longer days it means little proportion of the residents generates less waste because and discard them ones per week. [8, 13, 25] Also majority of the respondents (38.0%) make use of their personal waste bin (like plastic container which is of different sizes, 22% uses ASEPA bin while 22% uses garbage bags. 16% had no bin collection thus they throw their waste anywhere. This implies that majority of the residents in the study area make effort to compose their waste showing that they are sensitive of the need to conserve the environment. Moreover as 4.0% keeps their waste for longer days it means little proportion of the residents generates less waste because and discard them ones per week. [13, 25, 27]. The various methods by which the respondents finally disposed their solid waste in the study area shows that about 52% households use the ASEPA municipal collection system. Among them 35% uses open dump and 13% are burning their waste. There is no ASEPA door-to-door collection system. This indicates that among the sample area greater number of household uses the ASEPA receptacles in within their reach. On various ways by which the respondent in the study area disposes their liquid waste 32% of the respondents dispose their own by digging a pit or channeled it to soak away pit, 21% of the respondents disposes theirs around the premises or roads and 16% of the respondents disposes their anywhere. This is in line with the observation of the federal ministry of environment, stated in National Environmental Sanitation Policy [15]. Respondents using latrine for their fiscal matter disposal is (28.0%), flushed toilet 35%, nearby bush 15% and 11% uses nearby dumpsite and water closet respectively. This indicates that most of the respondent in the study area uses methods adjusted as insanity; hence this will not only constituted visual blight and odour nuisance, but also encouraged the breeding of rodents, mosquitoes, and other pest of health importance. These findings conforms to the publication of the federal ministry of environment: policy guideline on excreta and sewage management [18, 26], and Nigeria Demographic Health survey (NDHS).
4.3. Quantity of Waste Generation
household size and educational level of the respondents were determinants of household waste generation. The R-square Value of 0.912 indicates 91.2% variability in quantity of waste generation as explained by the independent variable. The F value of 193.817 was highly significant at 1% level indicating a regression of best fit. Income of the respondents was significant at 1% level and had a positive relationship with the quantity of waste generation. This implies that the higher the level of income of the respondents, the higher the generation or waste. When there is increase in the income level of a person, the pattern of consumption changes thereby generating different types of waste that reflect their new way of life. Household size was negatively related to the quantity of waste generation. This implies that the higher the household size, the lower the quantity of waste generation. Studies has found negative relation between household size and waste generation. Educational level was significant at 1% level and was positively related to the rate of waste generation in the study area. This implies that the more educated a person becomes, the more waste is generated. For instance, if a person is educated and acquires new jobs, which will increase the income level, the rate of income also increases. Thus a change in life style increases waste generation rate. [22, 23, 24, 27, 28, 33]
4.4. Examining Municipal Waste Management Practices
From the result in table 4 above indicates that 42% of the respondent that lived in 1-3 rooms contributes N3520 that is 18% of the total sanitation fees ranging from N40 – N120 per month. 27% of the respondent that lived in 4-6 rooms contributes N3889 that is 20.17% of the total sanitation fees ranging from N160 – N240 per month. 15% of the respondent that lived in 7-9 rooms contributes N4760 that is 24.69% of the total sanitation fees ranging from N280 – N360 per month. 11% of the respondents that lived from 10 rooms and above contribute N7560 that is 39% of the total sanitation fees are charged from N400 and above per month. These fees are being collected by the regulator (ASEPA) annually; this means that a minimum of N480 and maximum of N7200 are paid by resident per annum in the study area. Thus this shows that the residents are willing to pay the environmental sanitation fees. Chutrat in2007 has also find willingness to pay (WTP) by residents in there study.
4.5. Waste Management Services
Table 5 indicates that the municipal waste bin is far from the respondent home as responds shows that option on very far is 25%, and far is 36%. While 15% of the respondents had no waste bin. However, only 24% has waste bin closer to them. This implies that over 40% of the respondent is likely to dispose waste illegally. The municipal waste collection is very poor, from the option 3.0% respond that they evacuate the waste most often, 15% respond that they evacuate the waste more often, 32% respond that ASEPA evacuate the waste very often, while 31% respond that it is rare to see ASEPA evacuating the waste bins. This is an indication that
above 31% of waste generated by households alone (which they disposed to the receptacles) in the city is not being evacuated by the environmental regulators. The question now is what will be the condition of waste from other sector? The result from table 5 confirm the fact that environmental agencies are on their developmental stage [14]. We know that our society today is being burdened with avoidable societal cum economic problems such as poverty, unemployment, bribery corruption, harmful habits, etc. The issues of environment and waste management cannot be separated from these problems. However, we the citizens can make a change in the face of our today’s wrong environmental habits. Now we realized that some of these problem are man-made, areas like environmental sanitation management which include solid waste and waste-water management is such that which we can make good to happen in Abia State and to Nigeria at large. It was observed that the state lack standard waste management, hence open dumping is in use at two different locations which is the final disposal site. Some of the strategy adopted in municipal waste management as identified by ministry of environment includes the following: Designation of receptacles in the strategic points; Collection of the receptacles on daily basis to final dump site; Waste agents to clear entry points to the city; Desisting of drainages by waste agents; Supervision of waste agents by health officers. The challenges in municipal waste management services as identified are the following: Lack of political will; Poor management of personnel and materials; Lack of policy thrust; and Duplication of functions.
4.6. Examining the Municipal Disposal Charges
In Umuahia metropolis residents are to pay for waste collection through property taxes, (that is fixed fee on their houses and number rooms they occupies) by ASEPA, regardless of how much-or how little- trash they generate. The implication of this is that residents who recycle, reuses or prevent waste subsidies their neighbor’s wastefulness since waste collection fees is charged (N40 per room) at flat rate. Household makes a flat rate payment for waste disposal services through ASEPA rates. This means that households face zero prices at the margin for generating additional rubbish. An increase in the flat rate payment (N100, N200, N300, N500, and N1000 for One Room, One Bedroom Flat, 2-3 Bedroom Flat, Detached Bungalow and Duplex respectively) provision in The Abia State Basic Environmental Law as amended by Abia State House of Assemble on December [2], which will take effect when signed into law will only provide incentives via the income effect and as waste disposal cost are only a small portion of household income, the income elasticity of disposal is low. Controlling illegal disposal involves additional cost, that is monitoring and enforcement. Uniform tax on all types of garbage might be inefficient if materials within the waste stream produce different social costs [9].
above the budget line can be drawn as shown in figure 2 and 2 below.
Budget constraints limit an individual’s ability to consume in light of the prices they must pay for various goods and services [32]. As consumption moves along a budget line from the intercept, the consumer spends less on one item and
more on the other. The slope of the line measures the relative cost of consumption and waste disposal. The slope is the negative of the ratio of the prices of the two goods. The slope indicates the rate at which the two goods can be substituted without changing the amount of money spent.
Figure 2. Household constraints on cost of consumption and waste disposal.
Figure 3. The household budget line.
In figure 1 and 2 above, waste generation decreases as disposal charge increase. In figure 2, the linear budget line (line of best fit) with its equation (y=-48.83x+5083) for estimating the effect of disposal charges on household consumption at a variable rate (PAYT). What does this prediction mean? Assuming the household initially spend N50/kg (Q in figure. 1) of waste generated and the charge
same in every occasion, the fact that household spent some income last month would of itself influence the effect of spending more this month. Given that environmental sanitation fees has a cumulative effect and fine for defaulters waste generation rate will reduce even if consumption did not. Thus households will resort to either waste reduction, recycle, reuse or illegal dumping [4, 3, 24, 19].
With Pay-As-You-Throw (PAYT) (also known as unit pricing or variable rate), residents are charged for the collection of municipal waste based on the amount they throw away. This creates direct economic incentives to recycle more and to generate less. PAYT will break the ASEPA tradition of flat rate charges to household by treating waste services just like electricity bill and other services households pay a variable rate depending on the amount of services they use. This implies that residents will be charged for the quantity of waste they generate, either in bags or by weight of their trash. This method is simple and fair, the less individuals throw away the less they pay. This approach encompasses three interrelated components:
1.Environmental sustainability: with PAYT in place there will be increase in recycling and reductions in waste, subsequently disposal of products are reduced as a result of the increased recycling and waste reduction PAYT encourages.
2.Economic sustainability: PAYT is an effective tool to cope with household solid waste management expenses. It generate revenue needed to cover the solid waste cost including the cost of recycling, residents also benefit. 3.Equity: The good advantage of PAYT is its inherent
fairness. With flat rate cost of managing waste is hidden in taxes and households that recycle, reuse and prevent waste subsidizes their neighbors wastefulness.
5. Conclusion
Abia State has been grappling with the problems of solid wastes management in recent times. The indiscriminate dumping of these waste of all categories, and the improper management methods currently in the state have rubbished the efforts of the government and the huge sums of money being spent to check the menace. The urban population growth rate and the living standard of our people have led to a substantial increase in the quantity and diversity of the solid waste being churned out, on daily basis, from various households (0.53kg/capita/day). As a consequences, the rate of generation of these waste now far exceed the rate of their evacuation, leading to the littering of all nooks and crannies of our city centers with heaps of refuse.
The results from analysis shows that income and educational level of the respondents in the study area positively influence the quantity and rate of waste generation, while family size had a negative impact on waste generation rate in the study area. Furthermore the flat rate that that household pay per month for waste they generate which do not consider the quantity of waste create a gap in the system. However to ensure environmental sustainability, economic
sustainability, and equity unit pricing (PAYT) is the best alternative option for waste disposal and management charges in the state.
To ensure acceptable solid waste system in the State, it is therefore recommend that the following strategies be adopted which include: Accurate enumeration of Umuahia metropolis; Provision of standard dustbins for households, markets, and offices; Introduction of door-to-door collection of waste; Delineation of the city into manageable zones for effective coverage and management; Engagement of component refuse disposal agents/contractors; Enforcement of environmental law; and Embarking on an aggressive campaign using handbills, posters, seminars, radio, television and any other available medium for sustained environmental education of the populace.
References
[1] Abia state of Nigeria (2004) “the abia state basic environmental law”. Law No. 1 of 2004.
[2] Abia state of Nigeria (2013), “the abia state basic environmental (amendment no. 1) law”. Law No. 7 of 2013. [3] Ackerman, Frank (1997), Why Do We Recycle?, Washington
D. C, Island Press. Agricultural Economics, New York College of Agriculture and Life Sciences, Cornell University, Ithaca, New York.
[4] Blume Daniel R. (1991), ―Under What Conditions should Cities Adopt Volume Based Pricing for Residential Solid Waste Collectionǁ, Unpublished Manuscript, The Office of Management and Budget Office of Information and Regulatory Affairs, National Resources Branch, May.
[5] Bolanle A. Odufuwa, Bashir O. Odufuwa, Omoighe M. Ediale and Segun Oriola (2012), Household Participation in Waste Disposal and Management in Ijebu-Ode, Nigeria J Hum Ecol, 40 (3): 247-254.
[6] Chukwuemeka E, Osisioma B, Onwuka E, Ugwu J (2012). The challenges of waste management to Nigeria sustainable development: A study of Enugu State.
[7] Defra (2011) “The Economics of Waste and Waste Policy”.
Waste Economics Team. Environment and Growth Economics. Department for Environment, Food and Rural Affairs Nobel House; 17 Smith Square, London. Available at: www.defra.gov.uk
[8] Dennison G. J., Dodd V. A. & Whelan B. (1996), A socio-economic based survey of household waste characteristics in the city of Dublin, Ireland, IIǁ, Waste Quantities, Resources, Conservation and Recycling, Vol. 17, pp. 245-257.
[9] Dinan Terry M. (1993), Economic Efficiency Effects of Alternative Policies for Reducing Waste Disposall, Journal of Environmental Economics and Management, 25 (3), November, 242-256.
[11] Emma Chukwuemeka, Joy Ugwu and Dan Igwegbe (2012). Management and Development Implications of Solid Waste Management in Nigeria Asian Journal of Business Management 4 (4): 352-358, ISSN: 2041-8752.
[12] European Union Commission (2008), “Waste Framework Directive on Environment”. Directive 2008/98/EC. European Commission. Available at http://ec.europea.au/... Accessed March 2014.
[13] Even, J. C. et al., (1981) Residential Waste Generation - A Case Study. Resources and Conservation 6, pp. 187-201. [14] Ezeronye, O. U. (2000), solid waste management in the
tropics: a case study in the Nigerian urban environment. International journal of environmental studies. 57 (4): 437-442.
[15] Federal Ministry of Environment (2005), “National Environmental Sanitation Policy”. Federal Ministry of Environment, Abuja, Nigeria. January 2005.
[16] Federal Ministry of Environment (2005), “National Environmental Sanitation Action Plan”. Federal Ministry of Environment, Abuja, Nigeria. January 2005.
[17] Federal Ministry of Environment (2005), national policy guidelines on solid waste management. Federal Ministry of Environment, Abuja, Nigeria. January 2005.
[18] Federal Ministry of Environment (2005), Policy Guidelines on Excreta and Sewage Management. Federal Ministry of Environment, Abuja. Nigeria. January 2005.
[19] Frank Owen and Ron Jones (1982) “Regression and Correlation” Statistics, 2nd edition. Pitman Publishing Ltd, London. ISBN: 0-237-02639-9. Pp 347-378.
[20] Gilbert, I. Adogho (2008) “the equilibrium of the consumer”.
Microeconomic analysis for universities. Gilbo research Consultants, Choba-Port Harcourt. ISBN 978-8012-39-6. [21] Glossary of environmental statistics (1997) UNSD,
www.UNStats.un.org/...; Basel convention (1989), www.basel.int/ Accessed February 2014.
[22] Hong Seonghoon, Richard. M Adams and Alan. Love (1993), An Economic Analysis of Household Recycling of Solid Wastes: The Case of Portland, Oregonl, Journal of Environmental Economics and Management 25 (2): 136-46.
International Journal of Research Studies in Management, 1 (2): 79-87.
[23] Hoornweg Daniel, Bhada-Tata Perinaz (2012). What a waste: a global review of solid waste management. urban development series. Knowledge paper No. 15 (1) Washington dc: World Bank.
[24] Jenkins, Robin R. (1993), The Economics of Solid Waste Reductionǁ, Burlington, Vt: Edward Elgar. Journal of Environmental Economics and Management 38, 234–246, available online at http://www.idealibrary.com on
[25] Julian Parfitt Robin, Flowerdew, and Peter Doktor (2002)
“socio-economic variables in household waste modelling: two case studies” Department of Geography Lancaster, University School of Environmental Sciences University of East Anglia and The Centre for Social and Economic Research on the Global Environment University of East Anglia and University College London. CSERGE Working Paper WM 94-02.
[26] Kayode, A. M and Omole F. K (2011) “some socio-economic factors affecting generation and disposal in Ibadan metropolis, Nigeria”. Journal of environmental issues and agriculture in the developing countries. Vol. 3 (1).
[27] Kinnaman Thomas C. and Don Fullerton (2000), The Economics of Residential Solid Waste Management', in T. Tietenberg and H. Folmer (eds) 'The International Yearbook of Environmental and Resource Economics 2000/2001, Cheltanham, UK and Northampton, MA, USA, Edward Elgar Publishing Ltd., 100-147.
[28] Mclain K. T (1995), Recycling Programmesǁ in Bromley D. W (ed) ‗The Handbook of Environmental Economics‘, Blackwell Publishers Ltd, U.K.
[29] Ogwueleka, T. C., (2009). Municipal solid waste characteristics and management in Nigeria. Iran, J. Environ. Health Sci. Eng., 6 (3): 173-180.
[30] Onwughara Nkwachukwu Innocent, Vincent Egbulefu Ajiwe, Helen Okwuoma Nnabuenyi and Chukwu Henry Chima; (2013) Bacteriological Assessment of Selected Borehole Water Samples in Umuahia North Local Government Area, Abia State, Nigeria. Journal of Environmental Treatment Techniques, Volume 1, Issue 2, Pages: 117-121. Journal web link: http://www.jett.dormaj.com ISSN: 2309-1185.
[31] Paul C. Stern (2000) Toward a Coherent Theory of Environmentally Significant Behavior Journal of Social Issues, Vol. 56, No. 3, pp. 407–424.
[32] Pearson Education, (2005) “Indifference Curves: An Example”. Pearson Education, Inc. pp. 65-79. Available at: http://www.otaru-uc.ac.jp/yamamoto/files/Apr_27.pdf [33] Pratt R. M and P. S. Philips (2000), The Role and Success of
UK Waste Minimization Clubs in the Correction of Market and Information Failuresǁ, Resources, Conservation and Recycling 30 (3): 201-219.
[34] Spring (2005) “Principles of Microeconomics”. Maximizing utility, Eco 101; Business Learning Center. Web publication available at www.occc.edu/.../utility.pdf
[35] Stefan Salhofer (2001), “Waste Generation –modeling the amount of waste”, Institute of Waste management, BOKU – University of Natural Resources and Applied Life Sciences, Vienna.
[36] Stern P. C. (2000) “Toward a Coherent Theory of Environmentally Significant Behavior”. National Research Council Journal of Social Issues, Vol. 56, No. 3, 2000, pp. 407–424.
[37] Stern, P. C., Dietz, T., Abel, T., Guagnano, G. A., & Kalof, L. (1999). A value-belief-norm theory of support for social movements: The case of environmental concern. Human Ecology Review, 6, 81–97.
[38] Sujatha. S (2012), Awareness of Solid Waste Disposal among High School Students. International Journal of Teacher Educational Research (IJTER) Vol. 1 No. 4 December, 2012 ISSN: 2319-4642 www.ijter.com Awareness of Solid waste Disposal among High School Students 65-70pp.
[39] Viniegra, M. E., Cortes T. T., and Cuevas E. M. (2001)