IJIRMPS1811021
Website : www.ijirmps.org
Email : editor@ijirmps.org
112
A Study of Non-Performing Assets of
Udhagamandalam Co-operative Urban Bank Ltd.
1Dr. K. Vijaya Venkateswari, 2Ms. S.Vidhya 1Associate Professor, 2Ph. D Research Scholar
Department of Commerce Sri Ramakrishina College of Arts and Science for women Coimbatore, Tamil Nadu, India
Abstract: Banks play an important role in the provision of financial services to the public and contribute tremendously to economic development of a country. Though they are growth drivers, the banking business is exposed to various risk, such as credit risk, liquidity risk, interest risk, market risk, operational risk and management risk. Apart from these risks the very important risk of banks is loan recovery. The sound financial position of a bank depends upon the recovery of loans or its level of Non-Performing assets (NPAs). Reduced NPAs generally gives the impression that banks have strengthened their credit appraisal processes over the years and growth in NPAs involves the necessity of provisions, which bring down the overall profitability of banks. The Indian banking sector is facing a serious problem of NPA. The magnitude of NPA is comparatively higher in public sectors banks compared to private sector banks. This paper intends to study the NPAs of Udhagamandalam Co-operative Urban Bank Ltd.
Keywords: NPA, Banking Sector, Credit risk, Doubtful assets. INTRODUCTION
With the introduction of financial sector reforms 1991 the faces of Indian Banking sector have extremely changed. It plays an important role in the economic development of India. The problems arising in the banking sector will affect the Indian economy. The banking industry has moved step by step from a synchronized environment to a decontrolled market based economy. In 1991-1992 India adopted the open economy. Because of liberalization and globalization in market development there has been tremendous change in the transitional role of banks in India. The problem of swelling non-performing asset is catching attention and has assumed great importance in terms of risk management. The incidence of non-performing assets (NPAs) is affecting the performance of the credit institutions financially. NPA broadly defined as non-repayment of interest and instalment of principle amount (Das & Ghosh, 2006).NPA is a disorder resulting in non-performance of a portion of loan portfolio leading to no recovery or less recovery income to the lender. NPAs represent the quantify “Credit Risk”. Bankers have realized to have effective NPA management on their priority list. According to the “Narasimham Committee Report (1991), those assets (overdraft/ cash credit) for which the interest remains due for a period of four quarters (180 days) should be considered as NPAs”. After, this period had reduced and from March 1995 onwards assets for which interest and principle remains unpaid for a period of 90 days were considered as NPAs. Thus, NPA constitutes an important factor in the banking system as it seriously affects the profitability of the banks. The NPA can broadly be classified into Gross NPA and Net NPA. Gross NPA reflects the quality of the loans made by banks whereas Net NPA shows the actual burden of banks.
OBJECTIVES OF THE STUDY
To understand the concept of non- performing assets.
To study the NPAs of Udhagamandalam Co-operative Urban Bank Ltd.
To suggest the mechanism for recovery of NPAs through various channels.
RESEARCH DESIGN
This study is descriptive and analytical one and based on secondary data pertaining to the period 2012-2017. The sources of data for this research include the reports published by Udhagamandalam Co-Operative Urban Bank Ltd., books and research papers published in Journals.
DATA ANALYSIS AND RESULTS
Ratio Analysis: Ratio Analysis is a form of Financial Statement Analysis used to obtain a quick indication of a firm’s financial performance in several key areas. For the purpose of studying the NPAs of the bank ratio analysis has been made. Following are the results of ratio analysis.
A. Net NPA Ratio
Net NPA
IJIRMPS1811021
Website : www.ijirmps.org
Email : editor@ijirmps.org
113
Table -1
Year Net NPA Net Advances Net NPA Ratios(%)
2012-13 14873507 192382705 7.73
2013-14 14852198 192285607 7.72
2014-15 10621940 187996721 5.65
2015-16 9688672 178862924 5.42
2016-17 6065913 169383915 3.58
Average 11220446 184182374 5.99
Source: Annual Report
The above table presents the net non-performing assets position of bank and the ratio has been decreased from 7.73 to 3.58 from the year 2012-13 to2016-17. It shows that the bank have been able to make enough provisions against their gross NPA which is a very satisfactory position. The management of this bank have been very meticulous in recovering from defaulters.
B. Total Provisions Ratio
Total Provisions Total Provisions Ratio = --- X 100
Gross NPAs
Table -2
Year Total Provisions Gross NPA Total Provision Ratios(%)
2012-13 10345382 15218889 67.98
2013-14 17649231 25501429 69.21
2014-15 15243393 20865333 73.10
2015-16 17761227 19449899 91.32
2016-17 17807359 16543272 107.64
Average 15761318 19515764 81.85
Source: Annual Report
From the above table it is clear that the Bank have made enough provisions for their gross NPA. During the last five years provisions created by bank has been increasing every year from 2012-13 to 2015-16 and it is above 100% in the year 2016-17. This marks a very satisfactory position. It has even exceeded the limits laid down by the RBI.
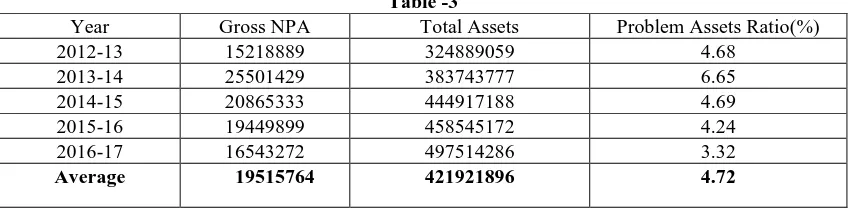
C. Problem Assets Ratio Gross NPA
Problem Assets Ratio = --- X 100 Total Assets
Table -3
Year Gross NPA Total Assets Problem Assets Ratio(%)
2012-13 15218889 324889059 4.68
2013-14 25501429 383743777 6.65
2014-15 20865333 444917188 4.69
2015-16 19449899 458545172 4.24
2016-17 16543272 497514286 3.32
Average 19515764 421921896 4.72
Source: Annual Report
IJIRMPS1811021
Website : www.ijirmps.org
Email : editor@ijirmps.org
114
D. Depositor’s Safety Ratio
Total standard Loan Assets+ Investments
Depositors’ Safety Ratio= ---X100 Total liabilities – Capital& Reserves
Table -4
Year
Total Standard loan Assets(Rs.)
Investments (Rs.)
Total Standard Assets (Rs.)
Total Liabilites
(Rs.)
Capital & Reserves (Rs.)
Total outside Liabilities
(Rs.)
Depositor’s Safety Ratio
(Rs.)
2012-13 64127568 128255137 192382705 412574255 174350748 238223507 80.76
2013-14 92142803 100142804 192285607 408539904 184254198 224285706 85.73
2014-15 88323196 99673525 187996721 343763590 133991421 209772169 89.62
2015-16 87998245 90673525 178861372 1509974485 1320537762 189436723 94.42
2016-17 67461305 112922610 180383915 284490710 105653190 178837520 100.86
Average 80010623 106333520 186382064 591868589 383757464 208111125 90.28 Source: Annual Report
The above table shows that the ratio of the bank is very satisfactory in the last 5 years, especially in the year 2016-17. It is very high in the year 2016-17 i.e. 100.86% and it can be concluded that the depositors’ money is safe with the bank.
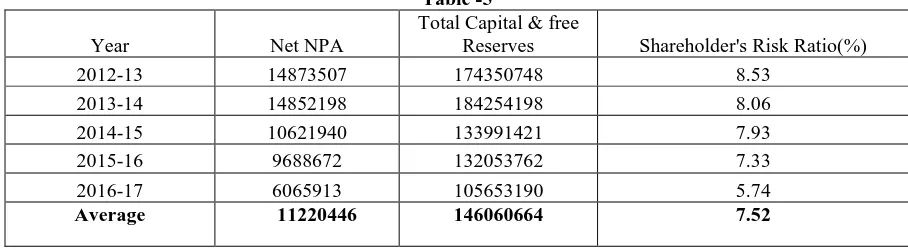
E. Shareholder’s Risk Ratio
Net NPAs
Shareholder’s Risk Ratio = ---X100 Total Capital & Free Reserves
Table -5
Year Net NPA
Total Capital & free
Reserves Shareholder's Risk Ratio(%)
2012-13 14873507 174350748 8.53
2013-14 14852198 184254198 8.06
2014-15 10621940 133991421 7.93
2015-16 9688672 132053762 7.33
2016-17 6065913 105653190 5.74
Average 11220446 146060664 7.52
Source: Annual Report
It is necessary to see that the shareholders funds are safe in view of the NPA. From the table given above it is clear that risk ratio is decreasing year by year which shows that the bank is making adequate provisions against NPAs. This indicates that the shareholders’ funds in this bank are safe.
F. Doubtful Assets Ratio
Total Doubtful Assets Doubtful Assets Ratio = ---X 100
Gross NPAs
Table -6
Year Total Doubtful Assets Gross NPA Doubtful Assets Ratio(%)
2012-13 10371940 15218889 68.15
2013-14 22407110 25501429 87.87
2014-15 10550512 20865333 50.56
2015-16 18490913 19449899 95.07
2016-17 12255248 16543272 74.08
IJIRMPS1811021
Website : www.ijirmps.org
Email : editor@ijirmps.org
115
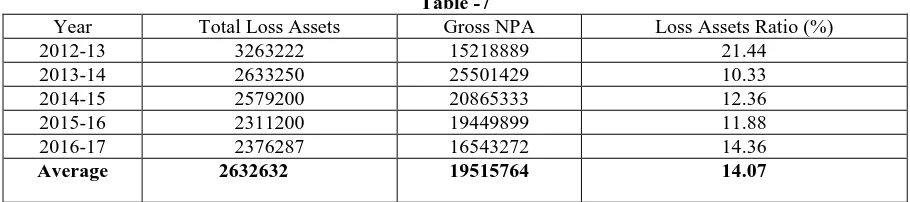
The doubtful assets ratio indicates the proportion of total doubtful assets to gross NPAs. From the table we understand that the ratio is satisfactory except for the years 2013-14 (87.87%), 2015-16 (95.07%). The management of the bank must try to recover as much doubtful advances as possible to reduce the NPAs.G. Loss Assets Ratio
Total loss Assets
Loss Assets Ratio = ---X100\ Gross NPAs
Table -7
Year Total Loss Assets Gross NPA Loss Assets Ratio (%)
2012-13 3263222 15218889 21.44
2013-14 2633250 25501429 10.33
2014-15 2579200 20865333 12.36
2015-16 2311200 19449899 11.88
2016-17 2376287 16543272 14.36
Average 2632632 19515764 14.07 Source: Annual Report
The above table explains the Loss assets ratio and it is understand that the loss assets ratio is very high in the year 2012-13 and low in the year 2013-14 (10.33%). There is a fluctuation after the year 2012-13 and it has been increased to 14.36 in the year 2016-17. It should be taken into consideration and action plans are necessary to reduce the loss assets ratio.
MECHANISM FOR RECOVERY OF NPAs
Non-performing assets can be reduced by taking following steps by the bank.
1. The Securitisation and Enforcement of Security Interest Act, 2002(SARFAESI)
This Act empowers banks to recover their NPAs without the intervention of the Court. Act also provides three alternative methods for recovery of non-performing assets, viz., Securitisation, Asset Reconstruction and Enforcement. Non-Performing assets should be backed by securities charged to the bank by way of hypothecation or mortgage or assignment. Security interest by way of lien, pledge, hire purchase and lease not liable for attachment under sec.60 of CPC, are not covered under this Act.
2. The Act empowers the bank,
(a) To issue demand notice to the defaulting borrower and guarantor, calling upon them to discharge their dues in full within 60 days from the date of notice.
(b)To give notice to any person who has acquired any of the secured assets from the borrower to surrender the same to the bank. (c) To ask any debtor of the borrower to pay any sum due or becoming due to the borrower.
(d) Any Security Interest over Agricultural land cannot be proceeded with
3. If the borrower fails to comply with the notice, the bank may take recourse to one or more of the following measures:
(a) Take the possession of the security
(b) Sale or lease or assign the right over the security
(c) Manage the same or appoint any person to manage the same
4. Lok Adalats: Lok Adalat is for the recovery of small loans. According to RBI guidelines issued in 2001, they cover NPA upto Rs.5 lakhs, both suit filed and non-suit filed are recovered.
5. Compromise Settlement: It is a scheme which provides a simple mechanism for recovery of NPA. It is applied to advances
below Rs.10 crores.
6. Credit Information Bureau: A Credit Information Bureau help banks by maintaining a data of an individual defaulter and provides this information to all banks so that they may avoid lending them.
7. Debt Recovery Tribunals: The debt recovery tribunal Act was passed by Indian Parliament in 1993 with the objective of facilitating the banks and financial institutions for speedy recovery of dues in cases where the loan amount is Rs.10 lakhs and above.
CONCLUSION
Findings of the study show that the bank is creating adequate provisions against their gross NPA which is a very satisfactory position. The management of this bank have been very meticulous in recovering from defaulters. The problem assets ratio is not stable in the period of study. There is a fluctuation in the Loss Assets ratio and it should be taken into consideration and action plans are necessary to reduce the loss assets ratio. Shareholders’ funds are safe very safe in this bank as per shareholders fund ratio. There is a fluctuation in the loss assets ratio and it has been increased to 14.36 in the year 2016-17. It should be taken into consideration and action plans are necessary to reduce the loss assets ratio.
IJIRMPS1811021
Website : www.ijirmps.org
Email : editor@ijirmps.org
116
REFERENCES
1. Chandan Chatterjee(2012), Jeet Mukherjee; Dr.Ratan Das (2012) “Management of Non- Performing Assets- A Current Scenario” International Journal of Social Science & Interdisciplinary Research Vol.1 Issue 11, ISSN 2277-3630.
2. Vivek Rajbahadur Singh(2006) “A Study of Non- Performing Assets of Commercial Banks and it’s recovery in India” Annual Research Journal of SCMS, Pune Vol.4.
3. Dr. Dinesh Gaba. Neha Rani (2014)“ Analysis of Non- Performing Assets of Public Sector banks” Global Journal for Research Analysis, Volume-3, Issue- 9, ISSN No 22778160.
4. A.Siva Kumar(2013), A Study on occupation wise non-performing assets of public and private sector commercial banks in India. 5. Rai,K (2012) Study On Performance Of NPAs Of Indian Commercial Banks. Retrieved from AJRBF, Volume 2, Issue 12 (December, 2012) ISSN: 2249‐7323
6. Rajput, N., Arora, A.P., Kaur, B (2012) Management Of Non-Performing Assets A Study Of Indian Public Sector Banks. Retrieved from IJMIE Volume 2, Issue 4, April 2012, ISSN: 2249-0558 [26].
7. Rajaraman, I., Vasishtha, G. (2001) Non-Performing Loans of PSU Banks: Some Panel Results (Discussion Paper), November2001 [27].
8. Gupta, B. (2012) A Comparative Study of Non-Performing Assets of SBI and Associates and Other Public Sector Banks. Retrieved from SIT Journal of Management, Vol. 2.No. 2. December 2012.