68
Author for correspondence: Dr. Sayeed Ahmad
De partmen t o f Ph arm aco gnos y a nd Phytoch emistry, Facu lty of Pharmacy, Jamia Hamdard, New Delhi-110062, India
E-mail: [email protected] Tel.: +91-9891374647
Validated UPLC-Q-TOF-MS method for quantitative determination of
emodin in rhizome of
Rheum emodi Wall. ex Meissn. and its traditional
polyherbal formulation using three different extraction techniques
Wasim Ahmad, Syed Mohammad Arif Zaidi* and Sayeed AhmadBioactive Natural Product Laboratory, Department of Pharmacognosy and Phytochemistry, Faculty of Pharmacy, Jamia Hamdard (Hamdard University), New Delhi-110062, India
*Department of Surgery, Faculty of Medicine, Jamia Hamdard (Hamdard University), New Delhi-110062, India
Received February 6, 2015: Revised March 10, 2015: Accepted March 20, 2015: Published online June 30, 2015
Copyright @ 2015 Ukaaz Public ations. All rights reserved. Email: [email protected] om; Website: www.ukaazpublications.com
Abstract
A new method using high throughput ultrahigh performance liquid chromatography-tandem mass spectrometry (UPLC/Q-TOF-MS) was developed and validated for the quantitative analysis of emodin in the Rheumemodi Wall. ex Meissn. and Safoof-e-pathar phori (SPP), using three differ-ent extracts. The extraction technique has been optimized for maximum yield using convdiffer-entional, ultrasonic and matrix solid phase dispersion (MSPD) extraction, with an objective of reducing analysis time and sustaining good efficiency. The chromatographic separation was achieved on a Waters ACQUITY UPLCTM BEH C
18 (100.0 mm × 2.1 mm; 1.7 µm) column packing, using isocratic
mobile phase, consisting of acetonitrile : water (90:10) at a flow rate of 0.2 mL min-1. The Waters
Q-TOF premier was operated in multiple reactions monitoring mode via negative ionization interface, using the transitions 268.9 m/z for emodin. The total run time was 3.2 min and the elution of emodin occured at 1.55 min. The method was proved to be accurate and precise at a linearity range of 1.0-1000.00 ng mL-1 with a correlation coefficient (r2) of
0.998. The lowerlimit of quantitation was 1.0 ng mL1. The intra-and inter-day precision and accuracy values were
found to be within the assay variability limits as per the ICH guidelines. The developed method was found rapid, accurate, reliable and highly sensitive for the quantitative analysis of emodin in the rhizome of R.emodi and formulation in different extracts. MSPD technique was found most suitable for the extraction of emodin as compare to other techniques.
Key words: UPLC/Q-TOF-MS, Rheum emodi, emodin, safoof-e-pathar phori, validation, MSPD
1. Introduction
“Rhubarb”, this word originates from its Latin name rhabarbarum (Wright, 2001). The botanical name of Himalayan rhubarb is Rheum emodi Wall. ex Meissn., is commonly known as revand chini (Anonymous, 1972, 1990; Prasad and Purohit, 2001). It is the Himalayan species of Indian rhubarb, distributed in the alpine and sub-alpine zones of the Western Himalaya (Zargar et al., 2011).
Rhubarb is a storehouse of a large number of anthraquinone derivatives such as physcion, chrysophanol, emodin, aloe emodin, rhein, etc. which are reportedly known for a large number of biological activities including antioxidant (Yen et al., 2000), antimicrobial (Babu et al., 2003), antifungal (Agarwal et al., 2000), cytotoxic (Kubo et al., 1992), larvicidal (Yang et al., 2003), casein kinase II inhibitory (Yim et al., 1999) and antiviral (Semple et al., 2001). Besides, these anthraquinone derivatives, have a great potential for dyeing textile (Novotna et al., 1999) and food stuffs (Muller et al., 1999) as safe and eco-friendly natural dyes. It has
PHYTOMEDICINE An International Journal
Annals of Phytomedicine 4(1): 68-73, 2015 Journal homepage: www.ukaazpublications.com
ISSN : 2393-9885
also been used as a purgative, stomachic, astringent and natural cure for the treatment of chronic bronchitis, asthma and certain skin diseases (Ahmad et al., 2014).
There are various analytical methods, reported for determination of emodin (the major hydroxyanthraquinones of R. emodi) (Figure 1) in plant extracts such as high-speed counter-current chromato-graphy, capillary zone electrophoresis, high-performance thin layer chromatography and most commonly used high-performance liquid chromatography, out of which HPLC method utilizing a Merck Germany C18 reverse phase column (25 × 4.6 mm I.D. 5.0 µm) at a
flow rate of 1.0 mL min-1 found inadequate sensitivity and has the
as per the ICH guidelines, which is rapid and highly sensitive for determination of emodin content of multi-component traditional formulations.
In this paper for the first time, a rapid, sensitive and high throughput ultra-performance liquid chromatography/quadrupole time-of-flight mass spectroscopy (UPLC/Q-TOF-MS) method was developed and validated for the determination of emodin in the polyherbal formulation (Safoof-e-Pathar phori) and rhizome of R. emodi for the analytical investigations, using three different extraction techniques. The extraction technique was optimized by using conventional extraction, ultrasonic and a new advanced extraction techn iq ue Matrix solid-ph ase dispersion (MSPD). MSP D extraction is a cleanup and sample preparation technique from complex matrix like from plants. It simplifies the process and reduces time of extraction, utilizing lesser solvent through dissolution and dispersion of organic phase bond to sorbent (Yin et al., 2013).
2. Materials and Methods
2.1 Chemicals, standards and samples
Emodin (C15H10O5; assigned purity >98%; M.P. 212ºC) was purchased from Sigma Aldrich chemicals private Ltd (Bangalore, India). Chemical structure of emodin is shown in Figure 1. LC-MS grade acetonitrile Lot No: CX038 was purchased from Honeywell B&J Brand, USA. HPLC grade water was obtained from Thomas Baker (Chemicals) Private Limited, Mumbai. Water used in the entire analysis was of LC-MS grade. Other chemicals used were of analytical grade from commercial sources.
HO
O
CH
3OH
O
OH
HO
O
CH
3OH
O
OH
Figure 1: Chemical structure of emdoin 2.2 Plant material and polyherbal formulation
Rhizome of R. emodi purchased from Kharibawli local market of Delhi and authenticated by Dr. H. B. Singh, Ref. NISCAIR/RHMD/ 1327/129, New Delhi. The rhizomes were dried, powdered in an electric grinder and passed through sieve # 60 so as to obtain uniform powder.
Safoof-e-Pathar phori (SPP) is an Unani polyherbo-mineral formulation and has been used in Unani system of medicine for its antiurolithiatic activity (Anonymous, 1986). It is a powdered formulation, which contains six different plant/mineral constituents: Pathar phori (Didymocarpouspedicellata) (Anonymous, 2006), kulthi (Dolichous biflorus) (Anonymous, 2007), revand chini (Rheum emodi) (Anonymous, 2007), namak turb (Raphanus sa tivu s), jawakh ar (P otassiu m carbonate) and sh ora q almi (Potassiu m n itrate). Th e formu lation was prepared usin g
authenticated constituents as per standard traditional protocol by a Unani Physician in the Department of Surgery, Faculty of Medicine, Jamia Hamdard, and supplied to us for analysis. Voucher Specimen Number : JH/FP/BNPL/WA/SAF 03-2010 was also deposited in laboratory for future reference.
2.3 Sample preparations
2.3.1 Conventional extraction (CE)
Accurately weighed 1.0 g of R. emodi rhizome powder, was taken in a 250 mL of round bottom flask. It was extracted below 50°C, using reflux condenser, using 50 mL of LC-MS grade methanol for three times to ensure complete extraction. The filtered extracts obtained were pooled and evaporated under vacuum to dryness, then reconstituted in LC-MS grade methanol and volume was adjusted to 10 mL, further it was diluted with solvent to get the desired concentration of emodin in sample, which was filtered
through 0.22 µm syringe filter before chromatographic analysis. The samples were kept in auto sampler and 10 µL of the sample
were injected for LC-MS analysis. Same method was followed for the extraction of emodin from formulation.
2.3.2 Ultrasonic extraction (USE)
Accurately weighed 100 mg of R. emodi rhizome powdered were taken in a 10 mL of volumetric flask. It was kept in a sonicator for 20 min by adding 7.5 mL of LC-MS grade methanol. The filtered extract obtained was pooled and evaporated under the current of nitrogen to dryness and then reconstituted in methanol and volume was adjusted to 10 mL, finally diluted to make the desired concentration emodin in sample, which was filtered through
0.22 µm syringe filter before chromatographic analysis. The samples were kept in auto sampler and 10 µL of the sample were injected
for LC-MS analysis. Similarly, formulation sample was processed for extraction of emodin.
2.3.3 MSPD extraction
100 mg of R. emodi rhizome powder blended with 400 mg of C18 using in a glass mortar pestle to produce homogeneous mixture. It was packed in a 6 mL SPE tube (Agilent Technologies) with filter disc on both sides after compression injection syringe plunger and attached with SPE- vacuum manifold (Agilent Technologies). The column was washed with 5% methanol to remove very polar matrix, followed by drying under the current of nitrogen. The 70% methanol (3 mL) was added to macerate the mixture in column, which was ultrasonicated for 5 min at 45 KH3 after closing the column with propylene cap. The sample was eluted with 5 mL of solvent (70%, Methanol) and elute was dried undercurrent of nitrogen. The residue obtained was redissolved in 10 mL of LC-MS grade methanol; it was diluted to make the desired concentration of emodin in sample,
which was filtered through 0.22 µm syrin ge filter before
chromatographic analysis. The samples were kept in auto-sampler
and 10 µL of the sample were injected for LC-MS analysis. Same
method was repeated for sample preparation using traditional Unani formulation.
2.4 UPLC conditions
UPLC was performed with a Waters ACQUITY UPLCTM system
No# JAA 272; Synapt; Waters, Manchester, UK). Chromatographic separation was performed on a Waters ACQUITY UPLCTM BEH
C18 (100.0 mm × 2.1 mm; 1.7 µm) column at 40ºC. The mobile
phase for UPLC analysis consisted acetonitrile and water which was degassed. For isocratic elution, the flow rate of the mobile phase was kept at 0.2 mL min-1 and 10 µL of sample solution was
injected in each run. The retention time of emodin was 1.55 min and total chromatographic run time was 3.2 min. The column and auto-sampler were maintained at 40ºC, respectively and the pressure of the system was set to 15000 psi.
2.5 Q-TOF-MS conditions
The mass spectrometry was performed on a quadrupole orthogonal acceleration time- of- flight tandem mass spectrometer (Waters Q-TOF PremierTM). The nebulizer gas was set to 500 L h-1, the cone
gas set to 50 L h-1 and the source temperature set to 100 ºC. The
capillary voltages were set to 2.50 KV and sample cone voltages were set to 40 V, respectively. Argon was employed as the collision gas at a pressure of 5.3 × 10⁻⁵ Torr. Quantitation was performed
using multiple reaction monitoring (MRM) of the transitions of m/z 268.9 225 for emodin with a scan time of 1.0 s scan time, and 0.02 s inter-scan per transition. The optimum values for compound-dependent parameters like trap collision energy (Trap CE) and transfer collision energy (Tran CE) were set to and 34 and 1.0 V, respectively for fragmentation information.
The Q-TOF PremierTM was operated in V mode with resolution
over 8500 mass with 1.0 min scan time, and 0.02 s inter-scan delay. The accurate mass and composition for the precursor ions and for the fragment ions were calculated using the Mass Lynx V 4.1 software incorporated in the instrument.
2.6 Calibration standards and quality control (QC) sample preparation
The standard stock solution containing 1000 µg mL-1 of emodin
was prepared by dissolving requisite amount in LC-MS grade Methanol (sonicated: 44 kHz, 250W at 25 ºC for 15 min). The stock solutions were appropriately diluted to prepare a series of standard working solutions, and then stored at 4ºC. The solutions
were brought to room temperature and filtered through 0.22 µm
membrane filter before UPLC/Q-TOF-MS analysis.
Calibration curve standards consisting of a set of twelve non-zero concentrations (A-L) in methanol yielding concentration range from 1-1000 ng mL-1 was plotted. The final concentrations for each
analyte were prepared to be 1, 2, 5, 10, 20, 50, 100, 200, 400, 600, 800 and 1000 ng mL-1. However, QC samples were prepared at
three levels; 800 ng mL-1 (HQC, high quality control), 400 ng mL-1
(MQC, middle quality control) and 10 ng mL-1 (LQC, low quality
control). All the solutions were stored at 2-8ºC until use.
2.7 Validation of method
The method validation of emodin was performed as per ICH guidelines (ICH, 1997) as well as similar to the methods reported by Garg et al. (2014), Rehman et al. (2014) and Singh et al. (2014). The linearity of the method was determined by analysis of six standard plots containing twelve non-zero concentrations. Peak area of standard emodin vs concentration of emodin was utilized for the construction of calibration curves, using linear least squares
regression of the emodin. The limit of quantification (LOQ) is the lowest concentration of the calibration curve, which could be measured with acceptable accuracy and precision. The LOQ was determined based on the signal-to noise ratio of 10:1. For determining the intra-day precision, replicate analysis of all the samples of emodin was performed on the same day. The run consisted of a calibration curve and six replicates of LOQ, LQC, MQC and HQC samples. The inter-day precision was assessed by analysis of sample on three consecutive validation days. The accuracy was analyzed as recovery by standard addition method at 0, 50, 100 and 150% levels by adding standard analyte to pre-analysed samples and measurement were done for six times. For evaluating the ruggedness of the method, one sample of precision and accuracy was run using a different column (same type) by a different analyst employing the same instrument.
3. Results and Discussion
3.1 Selection of column and optimization of chromato-graphic conditions
The objective of this study was to chromatographically quantify emodin in the rhizome of R. emodi and its traditional formulation. For the analysis, two analytical columns, Chirobiotic V2 (25 cm × 4.6 mm, 5 m) and UPLCTM BEH C
8 (100.0 mm × 2.1 mm; 1.7 m),
were shortlisted for method development. Baseline chromatographic resolution could not be achieved on the Chirobiotic V2 column with a mobile phase ammonium formate buffer (10mM, pH 4.00 -5.50): Acetonitrile (70:30, v/v). However, a good resolution was observed on the UPLCTM BEH C
18 column, using mobile
phase-Acotonitrite:Water (90:10, v/v). Baseline separation of emodin was obtained within runtime of 3.2 min without any interference. Methanol, acetone and isopropyl alcohol have been also tried for instant elution but they did not afford chromatographic separation. In order to undertake successful quantification of emodin, tuning parameters for ESI+ were optimized for the protonated precursors
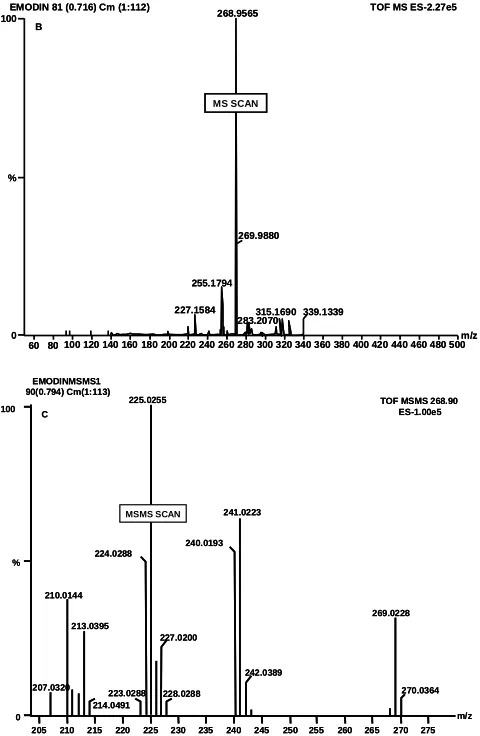
and product ions of analytes. Finally a sharp peak of emodin was found at 1.55 retention time. The MS full scan spectra for emodin showed protonated precursor [M+H]+ ions at 268.9 m/z and most
abundant product ions at 225.2 m/z (Figure 2). The optimum collision energies employed were 34.0 eV for emodin. Quantification was done on the basis of main product ions by keeping the identical capillary voltage of 3.0KV for monitoring the product ions.
0.20 0.40 0.60 0.80 1.00 1.20 1.40 1.60 1.80 2.00 2.20 2.40 2.60 2.80 3.00 3.20 Time TOF MSMS ES-TIC 4.41e4 1.55
A 100
% EMODINE
0
0.20 0.40 0.60 0.80 1.00 1.20 1.40 1.60 1.80 2.00 2.20 2.40 2.60 2.80 3.00 3.20 Time TOF MSMS ES-TIC 4.41e4 1.55
A 100
% EMODINE
60 80 100 120 140 160 180 200 220 240 260 280 300 320 340 360 380 400 420 440 460 480 500m/z TOF MS ES-2.27e5 268.9565
EMODIN 81 (0.716) Cm (1:112) B
100
%
0
227.1584 255.1794
269.9880
283.2070315.1690 339.1339 MS SCAN
60 80 100 120 140 160 180 200 220 240 260 280 300 320 340 360 380 400 420 440 460 480 500m/z TOF MS ES-2.27e5 268.9565
EMODIN 81 (0.716) Cm (1:112) B
100
%
0
227.1584 255.1794
269.9880
283.2070315.1690 339.1339 MS SCAN
205 210 215 220 225 230 235 240 245 250 255 260 265 270 275 m/z 270.0364 269.0228
242.0389 MSMS SCAN 241.0223
240.0193
227.0200
228.0288 224.0288
214.0491 223.0288 210.0144
213.0395
207.0320
0 % 100
C
225.0255 EMODINMSMS1 90(0.794) Cm(1:113)
TOF MSMS 268.90 ES-1.00e5
205 210 215 220 225 230 235 240 245 250 255 260 265 270 275 m/z 270.0364 269.0228
242.0389 MSMS SCAN 241.0223
240.0193
227.0200
228.0288 224.0288
214.0491 223.0288 210.0144
213.0395
207.0320
0 % 100
C
225.0255 EMODINMSMS1 90(0.794) Cm(1:113)
TOF MSMS 268.90 ES-1.00e5
Figure 2:(A) T he chr oma togram of emodin showing RT at 1.55 min., (B) Precursor ion spectr a ( protonated precursor [M+H]+ ions at m/z 268.9); and (C) product ion spectra
(major fragmentated product ion mass spectra at m/z 225.2) showing fragmentation transitions.
3.2 Linearity, limit of quantification, accuracy, precision and recovery
Linearity of emodin was established over a concentration range of 1-1000 ng mL-1. Linear coefficient of regression (r2 >0.998) was
obtained using least squares linear regression model using peak area vs concentration. The limit of quantification in the present method was 1.0 ng mL-1 (Table 1). The results of precision are summarized
in Table 2. The % RSD ranged from 1.09 to 1.70 for intra-day and from 1.09 to 1.85 and to % for inter-day precision.
Table 1: Linea rity a nd limits of detection a nd qua ntification of UPLC/Q-TOF-MS analysis of Emodin
Parametrs Emodin Regression equation Y= 9.002x+32.68 Linear range 1-1000 ng mL-1
Correlation coefficient (r) 0.998
LOD 0.36 ng mL-1
LOQ 1.0 ng mL-1
Table 2: Precision of the method
Con Inter-day (n=6) precision Intra-day (n=6) precision
cng mL-1 Mean peak area ± S.D. % RSD Mean peak area ± S.D. % RSD
10 82.36 ± 0.90 1.09 83.92 ± 1.27 1.56
400 3328.26 ± 56.71 1.70 3363.23 ± 62.31 1.85
800 6541.41 ± 79.80 1.21 6562.46 ± 71.91 1.09
The recovery for emodin was calculated by comparing the peak areas of samples which were pre-spiked with analytes at 50, 100 and 150% levels, the extraction recovery of emodin was noted in the range of 97.93 to 101.56%. (Table 3.)
Table 3: Accuracy of the method (n = 6)
Excess spike Theoretical Amount % of drug % RSD
standard content of drug recoverd
concentration (ng mL-1) recovered
added (%) (ng ± S.D.)
0 20.44 20.05 ± 0.27 98.1 1.36
50 30.66 30.02 ± 0.40 97.93 1.34
100 40.88 41.21 ± 0.68 100.8 1.67
150 51.1 51.90 ± 0.30 101.56 0.58
3.3 Selectivity
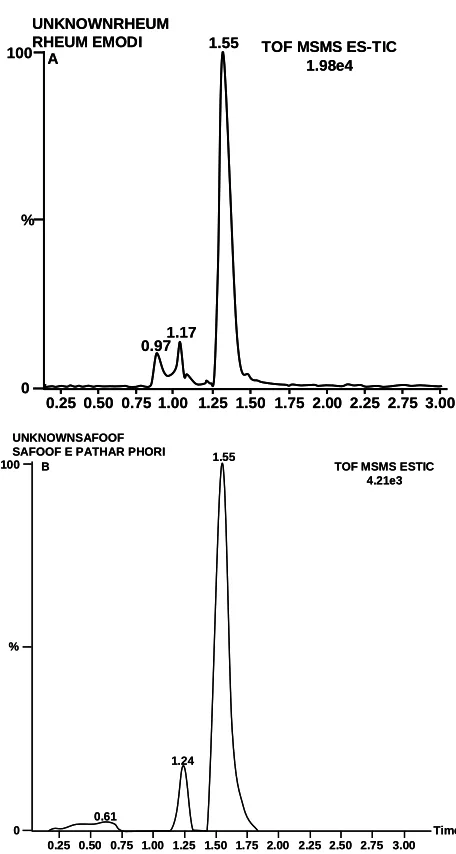
From the chromatogram shown in Figure 3, it is evident, that under the chosen chromatographic conditions, emodin (RT-1.55) was completely separated from sample, which indicated that the method is selective and cou ld be used for th eir iden tification and quantification.
3.4 Specificity
The specificity of the method was confirmed by injecting blank sample. No other peaks were observed at the retention times of emodin, indicating that interfering substances were not present, and MSMS spectrum showing the specificity of the method.
3.5 Analysis of emodin content in the polyherbal formulation and rhizome of R. emodi
The analysis of emodin in polyherbal formulation namely; Safoof-e-Pathar phori and R. emodi samples showed higher content in MSPD extraction as compared to conventional extraction and ultrasonication (Figure 4). The content of emodin was found 427 and 3490 mg kg-1 by conventional extraction, 488 and 3970 mg kg-1
by ultrasonic extraction and 535 and 4350 mg kg-1 by MSPD
extraction, respectively in polyherbal formulation of R. emodi rhizome. The trueness of content of emodin in formulation with respect to the ratio of drug added was found 97.87%, 98.33% and 98.39% using conventional, ultrasonic and MSPD extraction techniques, respectively.
4. Conclusion
developed method are the short analysis time (RT 1.55 min), high sensitivity (LOQ: 1.0 ng mL-1) and simple extraction procedure.
The assay was successfully employed for the quantification of emodin in the rhizome R. emodi and its traditional formulation using different extraction techniques with acceptable precision, adequate sensitivity and accuracy. MSPD method was found most suitable for extraction of emodin from complex matrix.
Acknowledgments
Authors are thankful to the CCRUM, Department of AYUSH, Ministry of Health and Family Welfare, Government of India, New Delhi, India, for the financial support and CSIR for fellowship.
Conflict of interest
We declare that we have no conflict of interest.
0.25 0.50 0.75 1.00 1.25 1.50 1.75 2.00 2.25 2.75 3.00 0
% 100 A
UNKNOWNRHEUM
RHEUM EMODI 1.55
1.17 0.97
TOF MSMS ES-TIC 1.98e4
0.25 0.50 0.75 1.00 1.25 1.50 1.75 2.00 2.25 2.75 3.00 0
% 100 A
UNKNOWNRHEUM
RHEUM EMODI 1.55
1.17 0.97
TOF MSMS ES-TIC 1.98e4
0.25 0.50 0.75 1.00 1.25 1.50 1.75 2.00 2.25 2.50 2.75 3.00 Time 0.61
1.24 1.55
TOF MSMS ESTIC 4.21e3 B
100
UNKNOWNSAFOOF SAFOOF E PATHAR PHORI
%
0
0.25 0.50 0.75 1.00 1.25 1.50 1.75 2.00 2.25 2.50 2.75 3.00 Time 0.61
1.24 1.55
TOF MSMS ESTIC 4.21e3 B
100
UNKNOWNSAFOOF SAFOOF E PATHAR PHORI
%
0
Figure 3: Typical chromatograms of sample showing RT 1.55 min
by selective reaction monitoring scan mode. (A) R. emodi (B) Safoof-e-Pathar phori
Rheum emodi
Safoo-e-Patharphori
Sample extraction methods
CE US E MSPD
0.00 0.05 0.10 0.15 0.20 0.25 0.30 0.35 0.40 0.45 0.50
E
m
o
d
in
c
o
n
te
n
t
in
%
w
/w
Rheum emodi
Safoo-e-Patharphori
Sample extraction methods
CE US E MSPD
0.00 0.05 0.10 0.15 0.20 0.25 0.30 0.35 0.40 0.45 0.50
E
m
o
d
in
c
o
n
te
n
t
in
%
w
/w
Figure 4: Bar diagram showing comparative content of emodin in samples by using different extraction techniques Refrences
Agarwal, S.K.; Singh, S.S.; Verma, S. and Kumar, S. (2000). Antifungal activity of anthr aqu inone derivatives from Rh eu m em od i. J. Ethnopharmacol., 72:43-46.
Ahmad, W.; Zaidi, S.M.A.; Mujeeb, M.; Ansari, S.H. and Ahmad, S. (2014). HPLC and HPTLC methods by design for quantitative characterization and in vitro antioxidant activity of polyherbal formulation containing Rheumemodi. J. Chromatogr. Sci., 52:911-918.
Anonymous. (1972).Wealth of India, Raw Material, CSIR, New Delhi, 9:3.
Anonymous. (198 6). Qarabadeen Majeedi. All India Unani Tibbi Conference, Delhi, 9th Edition.
Anonymous. (1990). Handbook of Ayurvedic Medicinal Plants, CRC Press, Boca Raton, FL and London, pp:487.
Anonymous. (2006). The Wealth of India, Second Supplement Series Raw Material, 3:58.
Anonymous. (2007). The Unani Pharmacopoeia of India, 1:58. Anonymous. (2007). The Unani Pharmacopoeia of India, 1:91. Babu, K.S.; Srinivas, P.V.; Praveen, B.; Kishore, K.H.; Murty, U.S. and
Rao, J.M. (2003). Antimicrobial constituents from the rhizomes of Rheum emodi. Phytochemistry,62:203-207.
Garg, M.; Tamboli, E.T.; Singh, M.; Kamal, Y.T.; Parveen, R. and Ahmad, S. (2014). Rapid, sensitive and validated UPLC/Q-TOF-MS method for quantitative determination of vasicine in Adhatoda vasica and its in vitro culture. Pharmacogn. Mag., 10:S198-205. ICH. (1997).Validation of Analytical Procedures, Methodology, ICH
harmonized tripartite guidelines.
Kubo, I.; Murai, Y.; Soediro, I.; Soeetarno, S. and Sastrodihardjo, S. (1 992 ). Cytotoxic anthraquinones from Rh eu m pa lma tu m. Phytochemistry, 31:10 63-10 65.
Muller, S.O.; Schmitt, M.; Dekant, W.; Stopper, H.; Schlatter, J. and Schreier, P. (1 999 ). Occu rrence of emodin, chrysophanol a nd physcion in vegetables, herbs and liquors. Genotoxicity and anti-genotoxicity of the anthraquinones and of the whole plants. Food Chem. Toxicol., 37:481-491.
Prasad, P. and Purohit M.C. (2001). Altitude acclimatization and concentration of active constitu ents and calorific value of two medicinal plant species Rheumemodi and R. Nobile (Rhubarb) in Sikkim Himalaya. Curr. Sci.,80:734-736.
Rehman, U.H.; Ahmad, J.; Chester, K.; Tajuddin, E.T.; Ahmad, S. (2014). Chemoprofiling and tissue culture studies on Picrorhiza kurroa Royale ex Benth. for produ ction of picroside II . Ann. Phytomed., 3:70-77.
Semple, S.J.; Pyke, S.M.; Reynolds, G.D. and Flower, R.L.P. (2001). In vitro antiviral activity of the anthraquinone chrysophanic acid against poliovirus. Antiviral Res., 49:169-178.
Singh, M.; Ansari, S.H. and Ahmad, S. ( 201 4). Production a nd estimation of asarone in in vitro cultures of Acorus calamus Linn. Ann. Phytomed., 3:82-86.
Singh, N.P.; Gupta, A.P.; Sinha, A.K. and Ahuja, P.S. (2005). High-performance thin layer chromatography method for quantitative determination of four major anthraquinone derivatives in Rheum emodi. J. Chromatogr. A., 1077:202-206.
Verma, S.C.; Singh, N.P. and Sinha, A.K. (2005). Determination and locational variations in the quantity of hydroxyanthraquinones and their glycosides in rhizomes of Rheumemodi using high-performance liquid chromatography. J. Chromatogr. A.,1097:59-65.
Wright, C.A. (2001). Mediterranean vegetables: A cook’s ABC of vegetables and their pr epa ration. Albany Street, Boston, Massachusetts: The Harvard Common Press.
Yang, Y.C.; Lim, M.Y. and Lee, H.S. (2003). Emodin isolated from Cassia obtusifolia (Leguminosae) seed shows larvicidal activity against three mosquito species. J. Agric. Food Chem., 51 :7629-7631.
Yen, G.C.; Duh, P.D. and Chuang, D.Y. (2000). Antioxidant activity of anthraquinones and anthrone. Food Chem., 70:437-441. Yim, H.; Lee, Y.H.; Lee, C.L. and Lee, S.K. (1 999). Emodin, an
anthraquinone derivative isolated from the rhizomes of Rheum palmatum, selectively inhibits the activity of casein kinase II as a competitive inhibitor. Planta Med.,65:9-13.
Yin, J.; Wang, Y.; Tan, B.; Kang, Y.; Xie, D. and Tian, L. (2013). Ma trix solid-phase dispersion extraction for chromatogr aphic analysis of labdane diterpenoids in Coleusforskohlii. Phytochem Anal.,24:117-123.