MURDOCH RESEARCH REPOSITORY
http://ieeexplore.ieee.org/xpl/articleDetails.jsp?arnumber=974058&contentType=C
onference+Publications
Masek, M., Chandrasekhar, R., de Silver, C.J.S. and Attikiouzel,
Y. (2001) Spatially based application of the minimum
cross-entropy thresholding algorithm to segment the pectoral muscle
in mammograms. In: Seventh Australian and New Zealand
Intelligent Information Systems Conference, 18 - 21 November
2001, Perth, Western Australia, pp. 101-106.
http://researchrepository.murdoch.edu.au/19098/
Copyright © 2001 IEEE
Personal use of this material is permitted. However, permission to reprint/republish
this material for advertising or promotional purposes or for creating new collective
Spatially Based Application of the Minimum Cross-Entropy
Thresholding Algorithm to Segment the Pectoral Muscle in
Mammograms
masek
M Masek, R Chandrasekhar, C J S desilva and Y Attikiouzel Australian Research Centre for Medical Engineering
The University of Western Australia Perth, Western Australia, 6907
I
[email protected]I
[email protected]I
A threshold-based algorithm is presented for the extraction of the pectoral muscle edge in me- diolateral oblique view mammograms. The minimum cross-entropy thresholding algorithm is applied to local areas around the pectoral muscle to determine a series of thresholds as a function of area size. Using a model image it is shown that an inflection point in this b c t i o n corresponds to a threshold that will separate the pectoral muscle from the rest of the breast. Post processing is performed on mammograms to eliminate false positive points of inflection and a straight line is fitted to the detected pectoral boundary in order to smooth jaggedness caused by the non-uniform intensity of the pectoral muscle edge.
1
Introduction
gram, the image corner containing the pectoral muscle is found using an automated orientation algorithm [3]. To determine orientation, the The pectoral muscle in a mediolateral oblique breast tissue near the skin is extracted and its in-
region in One corner Of the image* Location Of Once the chest wall is located, the characteristic the pectoral muscle edge is a basic segmentation asymmetry of the mediolateral oblique view is step in the process of isolating different regions used to find the top of the image. The pectoral Of the mammo@am-
Of the pectora' muscle lies at the top of the image on the side of muscle tissue and its boundary is a prerequisite the chest wall. To simplifl further processing, for tasks ranging from the classification of breast the image is re-oriented to place the pectoral type [l] to image registration [2]. A straight-line muscle in the top left corner.
approximation to the muscle edge is typically
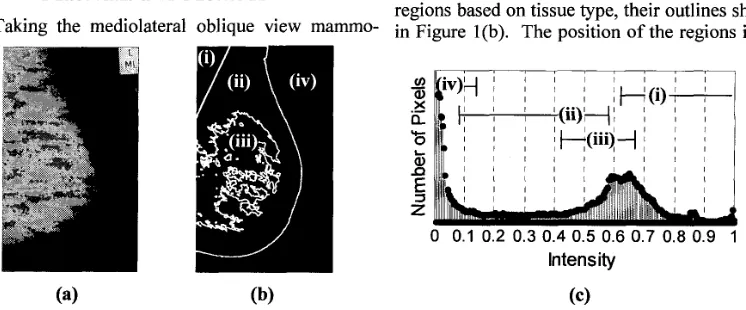
used in these tasks. Figure l(a) shows mammogram mdb007 from the Mammographic Image Analysis Society (MIAS)
2
Materials and Methods
database [4]. The image can be divided into four regions based on tissue type, their outlines shown Taking the mediolateral oblique view mammo- in Figure l(b), The position oftheregons
is in-view mammogram appears as a bright tensity gradients used to find the chest wall.
- . . -
I I I I I
lntens ity
(a) (b) (c)
ID
Q
0 0.2 0.4 0.6 0.8 1
Intensity
(4
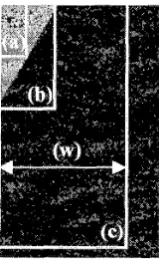
(b)Figure 2: (a) A local area near the top-left image corner, the histogram (b) appears as a bimodal distribution with two peaks, corre- sponding to the pectoral muscle (i) and the fatty tissue (ii).
dicated on the image histogram in Fig. l(c). The regions are separated in the image but overlap in the histogram; they correspond to (i) the pectoral muscle, (ii) fatty breast tissue, (iii) denser glandu- lar tissue and (iv) the image background.
The pectoral edge represents a line between the pectoral region and the fatty breast tissue. A sub- image can be taken from the top-left corner that will contain only those two regions, excluding the denser glandular tissue and the image back- ground. Such an image is shown in Figure 2(a). Its histogram in Figure 2(b) contains two peaks corresponding to the pectoral muscle and fatty tissue regions. This shows the segmentation of
the pectoral muscle to be a two-class thresholding problem for a subset of spatially separable image pixels.
This problem is investigated using a two-class model image shown in Figure 3(a). A bright re- gion representing the pectoral muscle Figure 3(a-
i) is set on a dark background Figure 3(a-ii) rep- resenting the fatty tissue. A Gaussian intensity distribution has been used for these two regions. The model image histogram is shown in Figure 3(b). The four parameters to define this model (and this specific model image) are: a) mean in- tensity of pectoral muscle, or mid-point of the pectoral histogram peak (0.7), b) mean intensity
of the model background histogram peak (0.3), c) the standard deviation of both Gaussian distribu- tions (0.007) and d) the aspect ratio of the rectan- gle enclosing the pectoral muscle (4:7), the aspect ratio being defined here as ratio of width to height. Knowing the aspect ratio, it is adequate to state the dimensions of only one side to specify a window size; the width will be used here.
Minimum cross-entropy thresholding is used to process the model and mammogram images. The concept of minimum cross-entropy, first proposed by Kullback [ 5 ] , is used here in the form devel- oped by Brink and Pendock [6] for the threshold- ing of greyscale images. The algorithm is given as Equation 1.
Each possible threshold T, in the range of image intensities (a to b) is associated with a cross- entropy H~E(T). The cross-entropy is determined by examining all intensities, g, in the image his- togram. The algorithm makes use of the fiequen- cies of grey level intensities (fg) and the mean of
intensities below (b(T)) and above (pl(T)) the considered threshold T. These values are not de- pendent on the spatial distribution of pixels and
-
U)
-
I I I I I I
I I I I I
0 0.1 0.2 0.3 0.4 0.5 0.6 0.7 0.8 0.9 1 Intensity
I
(a) (b)
thus can be extracted from the image histogram making the algorithm speed independent of image size, (but dependent on image depth). The grey level corresponding to the lowest cross-entropy is used as the resultant threshold.
The minimum cross-entropy thresholding algo- rithm is applied to rectangular windows of fixed aspect ratio and varying width anchored to the top-left image corner. A wide range of window aspect ratios has been tried on the model with similar results. Due to the exclusion of mammo- gram regions (iii) and (iv) in Figure 3(b) from the model, the window aspect ratio for a mammo- gram must be set to exclude these regions from the window for as many window sizes as possi- ble. A useful aspect ratio is that of the window containing the entire pectoral muscle, this how- ever varies between mammograms. An aspect ratio of (1 :2) has been chosen here to demonstrate results on images with a variety of pectoral aspect ratios, including the model image and actual mammograms.
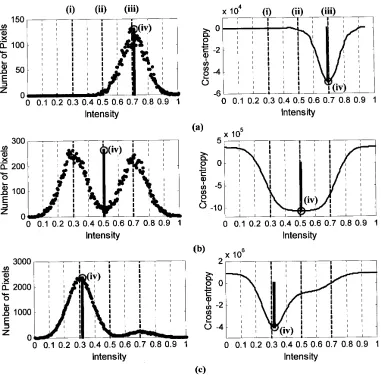
The relationship between minimum cross-entropy threshold and window width for the model is ex- amined in Figure 4 and 5. Rectangular windows of various widths from Figure 4 correspond to histograms and cross-entropy values for grey lev- els shown in Figure 5, with corresponding letter- ing (a-c). Intensities indicated in the plots are the mean of the model pectoral muscle, mean of the model background and the mid-intensity between those means, which can be considered as a good threshold to separate the two distributions. A
Figure 4: Rectangular windows (a-c) of various width and constant aspect ratio are extracted from the model image for analysis of histogram and cross-entropy in Figure 5.
Width (w) is shown for widow size (c) to demonstrate.
stem is used to mark the minimum cross-entropy.
For windows containing a majority of pectoral pixels a narrow minimum in the cross-entropy graph results in a region corresponding to the model pectoral intensities. The location of the minimum moves towards the mean intensity of the model pectoral Gaussian as the window width decreases (Figure 5a).
When the number of model background pixels is greater then the number of pectoral pixels a nar- row minimum occurs in the cross-entropy func- tion at the background pixel intensities. The loca- tion of the minimum converges towards the mean of the background Gaussian as the number of background pixels increases (Figure 5c).
The middle ground between the two narrow minimums is a broad minimum occurring when an equal number of pixels from the two classes are present in the window. The minimum corre- sponds to a threshold to separate the two classes (Figure 5b).
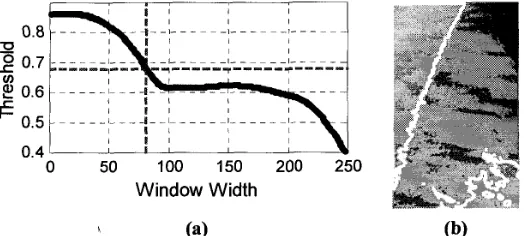
The characteristics of the cross-entropy minimum for varying window sizes are summarised by the graph of minimum cross-entropy threshold versus window width shown in Figure 6(a). The two regions converging to mean pectoral and mean background intensities are divided by a point of inflection, shown in the figure; this point corre- sponds to the broad minimum occurring in Figure 5(b). The location of the inflection point has been determined by examining the first and sec- ond derivatives of the function, graphs of which are omitted to conserve space. The inflection point is of interest since this threshold divides the model pectoral muscle from the background. The border of objects extracted from the model using this threshold is shown superimposed over the model image in Figure 6(b).
Comparing this model to an actual mammogram, Figure 7(a) shows the threshold versus window width graph for the MIAS image from Figure l(a). The shape of this function is a close ap- proximation to the shape of the model function for small window sizes. The inflection point, found from the first and second derivative, is shown in the figure. The border of regions ex- tracted using the inflection point threshold is shown in Figure 7(b), showing an outline near the pectoral boundary.
(i) (ii) (iii)
1 U)
a,
X
O
a
-
.-
a1
Y-
t
f
Z
x
lo4
(i) (ii) (iii)0 0.1 0.2 0.3 0.4 0.5 0.6 0.7 0.8 0.9 1
Intensity lntens ity
0 0.1 0.2 0.3 0.4 0.5 0.6 0.7 0.8 0.9 1 0 0.1 0.2 0.3 0.4 0.5 0.6 0.7 0.8 0.9 1
Intensity Intensity
(b) x I O 6
0 0.1 0.2 0.3 0.4 0.5 0.6 0.7 0.8 0.9 1 0 0.1 0.2 0.3 0.4 0.5 0.6 0.7 0.8 0.9 1 Intensity
(4
Intensity
Figure 5: Histogram and cross-entropy h c t i o n for rectangular windows from the model in Fig- ure 4(a-c) shown with corresponding lettering. Mean model pectoral intensity (i), optimal seg- mentation intensity (ii) and mean model background intensity (iii) are marked. The threshold corresponding to minimum cross-entropy (iv) is marked with a stem.
without user intervention, the inflection points 2.1 Deviation from the Model
of the border. Also, due to the glandular tissue tance between pixels nearest each opposite corner having similar grey levels to the pectoral muscle, is then taken as the gradient. A tally of gradients parts of it will also be outlined when using the and the number of pixels of each gradient is kept. correct threshold, as is shown in Figure 7(b). Since the pectoral muscle is the most distinct and These are overcome by the post processing de- straightest boundary in the image, the most com- scribed below. mon pixel gradient can be assumed to belong to it, thus the straight line that is fitted to the binary
2.2 Post Processing border image must correspond to that gradient.
To locate the outline most likely to correspond to
once
a series of straight lines is fitted to come- the pectoral muscle and to eliminate the jagged spend to each threshold, it remains to differenti- boundaries, a Set Of straight lines iS fitted to the ate between the actual pectoral boundary and the image. Each line is fitted to the border pixels of boundaries resulting from non-pectoral points ofobjects extracted using one of the inflection point inflection. The pectoral boundary represents a thresholds. TO fit the line, a simple gradient Op- division between two regions of the m m o -
erator is applied to the binary border. The hori- gram. One side of the boundary has relatively zontal edges of a window around each Pixel in the hi& intensities due to the presence of the pectoral border are examined- Due to its angle, the Pecto- muscle, the other side is relatively dark. A line ral boundary is from one a x ~ ~ e ~ fitted accurately will display the properties of this of the window to a point near the Opposite Comer. boundary. T~ determine which fitted line is most As the location ofthe pectoral muscle is known, representative of the pectoral outline, a pixel these COrIlerS are known also. The horizontal dis- neighbourhood is taken from each side of a line
to
I I I I I
0.8 /
0.7 0.6
U) 0.5
0.4 0.3
c
t
- - - - -I-- - - ?I I I I I I
0.2
1
I , I I I I 0 50 100 150 200 250Window Width
Figure 6: Model Image - Graph of minimum cross-entropy threshold for varying w,,idow wit 1s
(window aspect ratio 1 :2) (a). The inflection point, determined from the zero of the second de- rivative, corresponds to a threshold of 0.5. The result of applying this threshold to the model image is shown in (b) as an outline of the regions extracted in the left-hand corner of the image.
\ (a) (b)
Figure 8: Final results of straight line fit (only pectoral area shown). Success in MIAS images mdb007, mdbOl5 and mdb039 (a-c) and failures in MIAS images mdb035, mdb062 and mdb123 (d-f).
and the mean pixel intensity difference from one neighbourhood to the other is determined. The line that maximises the difference is chosen as the best estimate of the pectoral boundary.
3
Results and Discussion
The algorithm produces visually acceptable re- sults for a wide range of images in the MIAS da- tabase as shown in Figure 8(a-c). Inaccurate re- sults arise for a number of reasons. In images where the pectoral muscle boundary lies at vari- ous angles (e.g. MIAS image mdb035 in Figure 8d), an inaccurate straight line fit results. Various inflection points exist in the functions of images where the pectoral muscle is broken up into di- verse regions. These may result in the line being fitted to points inside the actual pectoral muscle, depending on their properties. In image mdb062 (Figure se), there is no strong outline for the pec- toral muscle so an internal region is extracted. In
image mdb123 (Figure 80, an obvious pectoral outline can be seen, however an internal region also displays the properties of a straight-line boundary between two intensity regions and is extracted instead.
Further use of the expanding window is being investigated for extraction of the pectoral muscle edge as well as a general segmentation algorithm.
4
Conclusion
An algorithm for segmenting the pectoral muscle from mediolateral oblique view mammograms has been presented. A series of intensity thresh- olds is found for the pectoral edge by applying the minimum cross-entropy thresholding algo- rithm to variable sized areas around the pectoral muscle. Each threshold is graphed as a point in a function against the window size it came from. Properties of this function determine a threshold
to segment the pectoral muscle and straight line fitting is used to generate a cleaner pectoral line.
5
References
N. Karssemeijer, "Automated Classifica- tion of Parenchymal Patterns in Mammo- grams", Phys. Med. Biol., vol. 43, pp.
F. Georgsson, "3D - Reconstruction of Points in Mammograms Based on Two Views", in proceedings of SSAB 2001,
M. Masek, "Automatic Breast Orientation in Mediolateral Oblique View Mammo- grams", Australian Research Centre for Medical Engineering, Technical Report
AR200 107,2001.
J. Suckling, J. Parker, D. R. Dance, S. Astley, and 1. Hutt et al., "The Mammo- graphic Image Analysis Society Digital Mammogram Database," in Digital Mammography (A. G. Gale, S. M. As- tley, D. R. Dance, and A. Y. Cairns, eds.), vol. 1069 of Excerpta Medica In- ternational Congress Series, (Amster- dam, The Netherlands), pp. 375-378, El- sevier Science, 1994.
S. Kullback, Information Theory and Sta- tistics, John Wiley, New York, 1959. A.D. Brink and N. E. Pendock, "Mini- mum Cross-Entropy Threshold Selec- tion", Pattern Recognition, 29 (l), pp.
365-378, 1998.
pp. 41-44, 2001.