*Corresponding author:Prakash L. Kondalkar ISSN: 0976-3031
Research Article
SIMULTANEOUS QUANTIFICATION OF HARMINE, KAEMPFEROL, OLEIC ACID AND
DIOSGENIN BY LCMS/MS (MRM) IN THE FRUIT EXTRACT OF TRIBULUS TERRESTRIS L.
AND ITS FORMULATION
Vikas V. Vaidya
1, Prakash L. Kondalkar
1*, Manjiri A. Shinde
1and Sulekha R. Gotmare
21
*Department of Chemistry, Ramnarain Ruia College, Matunga, Mumbai -400019,
Maharashtra, India
2
Department of Analytical Chemistry, S.N.D.T. Women’s University, Santacruz,
Mumbai-400049, Maharashtra, India
DOI: http://dx.doi.org/10.24327/ijrsr.2018.0904.1904
ARTICLE INFO ABSTRACT
A simple, accurate and reproducible LCMS/MS method has been developed for the simultaneous quantification of Harmine, Kaempferol, Oleic acid and Diosgenin from the methanolic extract of fruits of plant Tribulus terrestris L. and its marketed formulation. The Agilent 1100 series HPLC system and 3200 Q Trap LCMS/MS system of Applied Biosystem MDS/SCIEX was used for the analysis. The optimized conditions [Mobile phase A: 0.01 M Ammonium Acetate buffer; pH 7.5 adjusted with ammonia And Mobile phase B: Acetonitrile: Methanol (80:20)] gradient elution system on a C8 reversed-phase column with a flow rate of 1 mL/min. The separated compounds were detected as peak response of precursor ion (Q1)/ product ion (Q3) for Harmine 213.1/198.1 and Diosgenin 415.2/271.2 by positive mode(+MRM) and for Kaempferol 284.9/284.9 and Oleic acid 281.2/281.2 by negative mode (-MRM) in single injection. The quantity of Harmine was found to be 0.016 % and 0.008%, Kaempferol was 0.013% and 0.008%, Oleic acid was 0.254 % and 0.112 % and Diosgenin was 0.086 % and 0.019% in plant and formulation respectively. The developed method was then validated in accordance with the ICH guidelines in terms of specificity, linearity, LOD, LOQ, precision and recovery.
INTRODUCTION
Many countries (including developed ones) suffer a big problem in standardizing and quality control of the herbal plants. This is due to many factors among which are the complex form of these products and the inability of the traditional methods to precisely estimate the quality of the herbs. The quality of herbal medicines is defined in terms of the content of its bioactive compounds.
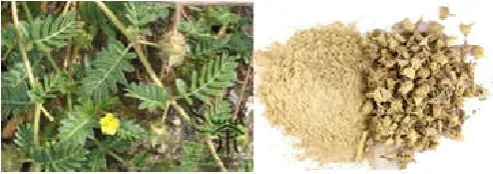
Tribulus terrestris L.is a valuable herb known for its application in the folk medicine in various parts of the world. In different regions the common names of this plant are Gokshura, Puncture vine, Caltrop, Yellow vine, Goathead, BurraGokharu and bindii. This plant is extremely rich in substances having potential biological significance, including: saponins, flavonoids, alkaloids, and other nutrients. Gokshura is extremely efficacious in most of the urinary tract disorders because it promotes the flow of urine, cools and soothes the
membranes of the urinary tract, and aids in the expulsion of urinary stones and gout. It also stops bleeding from the tract and rejuvenates the urogenital system, both in males as well as females. Gokshura effectively controls the bleeding, in large doses, it imparts the laxative action, hence is used as an adjunct in the treatment of piles. It is commonly used in treating diabetes, urinary calculi, dysuria, gout and sexual debility.
Figure 1 Tribulus terrestris L. and Its fruit with fruit powder
Available Online at http://www.recentscientific.com
International Journal of
Recent Scientific
Research
International Journal of Recent Scientific Research
Vol. 9, Issue, 4(B), pp. 25664-25669, April, 2018
Copyright © Prakash L. Kondalkar et al, 2018, this is an open-access article distributed under the terms of the Creative Commons Attribution License, which permits unrestricted use, distribution and reproduction in any medium, provided the original work is properly cited.
DOI: 10.24327/IJRSR
CODEN: IJRSFP (USA)
Article History:
Received 8th January, 2018 Received in revised form 21st February, 2018
Accepted 05th March, 2018 Published online 28th April, 2018
Key Words:
Tribulus terrestris L., Harmine, Kaempferol,
Prakash L. Kondalkar et al., Simultaneous Quantification of Harmine, Kaempferol, Oleic Acid And Diosgenin By Lcms/Ms (Mrm) In The Fruit
Many forms of raw plant material and herbal drugs derived from Tribulus terrestris L. are distributed in herbal market; however, the content of bioactive components in these products have not necessarily been quality-controlled. Therefore, a simple, low-cost, and rapid method for screening and quantitating bioactive components is strongly desir Literature survey revealed that no LCMS/MS method has been reported for simultaneous quantitation of Diosgenin, Oleic acid, Harmine and Kaempferol from methanolic extract of fruits of Tribulus terrestris L. plant materials that can be used to determine their content in commercial herbal drugs.
MATERIALS AND METHOD
Collection of plant
Tribulus terrestris L. were collected from Padadhari, around 30 km away from Rajkot, Gujarat, India in the month of Decemberand it was authenticated with specimen No. 10291(2) of H. Santapau at ‘Blatter Herbarium’ in St. Xavier’s college, Mumbai-400001
Preparation of plant material
The fruits were washed thoroughly with tap water. The fruits were dried initially using tissue paper to remove excess of water and later were air dried thoroughly under shade at room temperature to avoid direct loss of phytoconstituents from sunlight. The shade dried material was powdered using grinder and sieved through an ASTM 80 mesh. It was then homogenized to fine powder and stored in an air
for further analysis.
Preparation of the fruit extracts
About 5 gm of dried fruit powder of Tribulus terrestris L. weighed into a round bottom flask. 150 ml of mixture of 2 N hydrochloric acid and methanol in the ratio of 20:80 was added to the flask and the mixture was refluxed at controlled 80 ° C on a boiling water bath for about 6 hrs. The extract was then filtered through Whatman filter paper no. 41 (E. Merck, Mumbai, India) and extracted with chloroform (50 ml×3). The three chloroform extracts were combined and rinsed thrice times with 2 N NaOH and then rinsed thrice with distille water. The extract was then passed through a filter bed of Na2SO4 to eliminate any remaining water. The samples were
concentrated to dryness by evaporating the solvent at reduced pressure on Rotavapor buchi at 60°C and reconstituted the residue to final 50 ml volume with methanol in volumetric flask. This solution was further used for assay.
Preparation of the formulation extracts
About 15 gm of formulation Gokhshuradi Guggul
Tribulus terrestris L. was weighed into a round bottom flask. Table 1
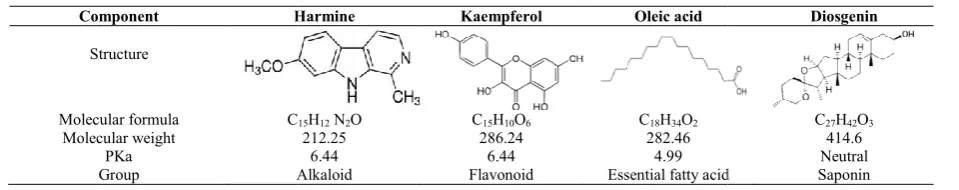
Component Harmine
Structure
Molecular formula C
Molecular weight PKa
Group Alkaloid
Simultaneous Quantification of Harmine, Kaempferol, Oleic Acid And Diosgenin By Lcms/Ms (Mrm) In The Fruit Extract of Tribulus Terrestris l. And its formulation
Many forms of raw plant material and herbal drugs derived distributed in herbal market; however, the content of bioactive components in these products controlled. Therefore, a cost, and rapid method for screening and quantitating bioactive components is strongly desired. Literature survey revealed that no LCMS/MS method has been reported for simultaneous quantitation of Diosgenin, Oleic acid, Harmine and Kaempferol from methanolic extract of plant materials that can be used their content in commercial herbal drugs.
were collected from Padadhari, around 30 km away from Rajkot, Gujarat, India in the month of Decemberand it was authenticated with specimen No. 10291(2) of H. Santapau at ‘Blatter Herbarium’ in St. Xavier’s college,
The fruits were washed thoroughly with tap water. The fruits were dried initially using tissue paper to remove excess of water and later were air dried thoroughly under shade at room temperature to avoid direct loss of phytoconstituents from t. The shade dried material was powdered using grinder and sieved through an ASTM 80 mesh. It was then homogenized to fine powder and stored in an air‐tight container
Tribulus terrestris L. was weighed into a round bottom flask. 150 ml of mixture of 2 N hydrochloric acid and methanol in the ratio of 20:80 was added to the flask and the mixture was refluxed at controlled 80 ° C hrs. The extract was then filtered through Whatman filter paper no. 41 (E. Merck, and extracted with chloroform (50 ml×3). The three chloroform extracts were combined and rinsed thrice times with 2 N NaOH and then rinsed thrice with distilled water. The extract was then passed through a filter bed of to eliminate any remaining water. The samples were concentrated to dryness by evaporating the solvent at reduced and reconstituted the 50 ml volume with methanol in volumetric flask. This solution was further used for assay.
Gokhshuradi Guggul containing was weighed into a round bottom flask.
150 ml of mixture of 2 N hydrochloric acid and methanol in the ratio of 20:80 was added to the flask and the mixture was refluxed at controlled 80 ° C on a boiling water bath for about 6 hrs. The extract was then filtered through Whatman filter paper no. 41 (E. Merck, Mumbai, India)
chloroform (50 ml×3). The three chloroform extracts were combined and rinsed thrice times with 2 N NaOH and then rinsed thrice with distilled water. The extract was then passed through a filter bed of Na2
water.
The samples were concentrated to dryness by evaporating the solvent at reduced pressure on
reconstituted the residue to final 50 ml volume with methanol in volumetric flask. This solution
Reagents and standards
All chemicals and solvents used were of analytical grade and purchased from Merck (Darmstadt, Germany). Analytical standards Diosgenin, Oleic acid, Harmine and Kaempferol were procured from Sigma-Aldrich (Bengaluru, India).
Preparation of standard soluti
Stock solutions of standards were prepared in methanol just before use. 50.29 mg of Diosgenin, 50.77 mg of Oleic acid and 25.18 mg of Harmine were dissolved separately in 25 ml of methanol and 44.40 mgKaempferol was dissolved and diluted to 10 ml methanol. These stock solution further diluted to make standard solution of a concentration of 32.19 µg/ml of Diosgenin and 81.23 µg/ml Oleic acid and 16.12 µg/ml to that of Harmine and 7.10 µg/ml Kaempferol.
Chromatographic conditions
LCMS/MS was performed on Agilent 1100 Series system. The system was equipped with quaternary pumps, auto
The column oven temperature was maintained at 40°C throughout the analysis. The
3200 QTRAP system from Applied
(Applied Biosystems, USA), a hybrid triple quadrupole linear ion trap mass spectrometer equipped with Turbo V sources, and a Turbo Ion Spray interface.
The method involves use of a
shield C8 column with length 150 mm and 5 μ particle size of stationary phase. The column temperature was kept constant at 40°.The injection volume was 5
20.017 min. Different compositions of solvents were tried as mobile phase in both isocratic a
gradient of Mobile phase A was Buffer [0.01 M Ammonium Acetate buffer; pH 7.5 adjusted with aqueous ammonia) and Mobile phase B was Acetonitrile: Methanol (80: 20)] was Table 1 Structures and properties of bioactive components
Harmine Kaempferol Oleic acid
15H12 N2O C15H10O6 C18H34O2
212.25 286.24 282.46
6.44 6.44 4.99
Alkaloid Flavonoid Essential fatty acid
Simultaneous Quantification of Harmine, Kaempferol, Oleic Acid And Diosgenin By Lcms/Ms (Mrm) In The Fruit
l of mixture of 2 N hydrochloric acid and methanol in the ratio of 20:80 was added to the flask and the mixture was refluxed at controlled 80 ° C on a boiling water bath for about 6 hrs. The extract was then filtered through Whatman filter paper Merck, Mumbai, India) and extracted with chloroform (50 ml×3). The three chloroform extracts were combined and rinsed thrice times with 2 N NaOH and then rinsed thrice with distilled water. The extract was then passed
2SO4 to eliminate any remaining
The samples were concentrated to dryness by evaporating the solvent at reduced pressure on Rotavapor buchi at 60° Cand reconstituted the residue to final 50 ml volume with methanol in volumetric flask. This solution was further used for assay.
All chemicals and solvents used were of analytical grade and purchased from Merck (Darmstadt, Germany). Analytical standards Diosgenin, Oleic acid, Harmine and Kaempferol
Aldrich (Bengaluru, India). Preparation of standard solutions
Stock solutions of standards were prepared in methanol just before use. 50.29 mg of Diosgenin, 50.77 mg of Oleic acid and 25.18 mg of Harmine were dissolved separately in 25 ml of methanol and 44.40 mgKaempferol was dissolved and diluted anol. These stock solution further diluted to make standard solution of a concentration of 32.19 µg/ml of Diosgenin and 81.23 µg/ml Oleic acid and 16.12 µg/ml to that of Harmine and 7.10 µg/ml Kaempferol.
LCMS/MS was performed on Agilent 1100 Series system. The system was equipped with quaternary pumps, auto-sampler. The column oven temperature was maintained at 40°C throughout the analysis. The detection was performed using a 3200 QTRAP system from Applied Biosystems/MDS Sciex (Applied Biosystems, USA), a hybrid triple quadrupole linear ion trap mass spectrometer equipped with Turbo V sources, and
The method involves use of a Waters reversed-phase symmetry length 150 mm and 5 μ particle size of stationary phase. The column temperature was kept constant at 40°.The injection volume was 5 μL and the total run time was Different compositions of solvents were tried as mobile phase in both isocratic and gradient mode. Finally a gradient of Mobile phase A was Buffer [0.01 M Ammonium Acetate buffer; pH 7.5 adjusted with aqueous ammonia) and Mobile phase B was Acetonitrile: Methanol (80: 20)] was
Diosgenin
International Journal of Recent Scientific Research Vol. 9, Issue, 4
selected which gave a good resolution between the sample components. The flow rate was maintained at 1 mL/min. Harmine and Diosgenin were ionized via electrospray ionization (ESI) in positive ion, multiple reaction monitoring (+MRM) mode. Kaempferol and Oleic acid were pseudo ionized with negative ion mode. The turbo-gas temperature was 450 °C, with an ion spray voltage of 2500 V. Nitrogen was used as nebulizer gas. Curtain gas setting was 15, and collision gas setting was 10.
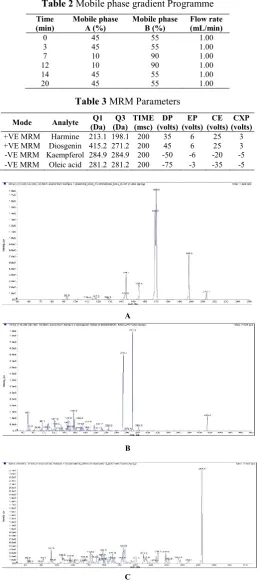
Table 2 Mobile phase gradient Programme
Time (min)
Mobile phase A (%)
Mobile phase B (%)
0 45 55
3 45 55
7 10 90
12 10 90
14 45 55
20 45 55
Table 3 MRM Parameters
Mode Analyte Q1 (Da)
Q3 (Da)
TIME (msc)
DP (volts)
+VE MRM Harmine 213.1 198.1 200 35 +VE MRM Diosgenin 415.2 271.2 200 45 -VE MRM Kaempferol 284.9 284.9 200 -50 -VE MRM Oleic acid 281.2 281.2 200 -75
A
B
C
International Journal of Recent Scientific Research Vol. 9, Issue, 4(B), pp. 25664-25669
selected which gave a good resolution between the sample mponents. The flow rate was maintained at 1 mL/min. Harmine and Diosgenin were ionized via electrospray ionization (ESI) in positive ion, multiple reaction monitoring (+MRM) mode. Kaempferol and Oleic acid were pseudo gas temperature was 450 °C, with an ion spray voltage of 2500 V. Nitrogen was used as nebulizer gas. Curtain gas setting was 15, and collision
Mobile phase gradient Programme
Mobile phase Flow rate (mL/min)
1.00 1.00 1.00 1.00 1.00 1.00
MRM Parameters
EP (volts)
CE (volts)
CXP (volts)
6 25 3
6 25 3
-6 -20 -5 -3 -35 -5
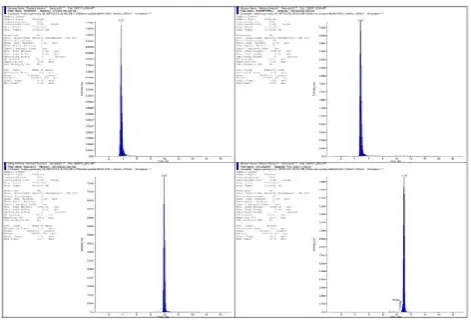
Figure 2 Fragmentation spectra of (A) Harmine (B) Diosgenin (C) Kaempferol (D) Oleic acid
Validation of the Method
Selectivity
The selectivity of this method was performed by analysing μL diluent blank, mobile phase blank. In order to interference at the retention time of each bioactive component, 5 μL of each of Tribulus terrestris L.
formulation extract, 32.19 µg/mLDiosgenin standard solution, standard solution of 16µg/mL of Harmine, 7.10 µg/mL Kaempferol standard solution, 81.23µg/mL of Oleic acid standard solution were injected separately.
Precision and Accuracy
The intra-day data reflects the precision and accuracy of the method under the same conditions within one day. Intra accuracy and precision were obtained by analysing six replicates of three sample preparation of each of Tribulu terrestris L. fruits methanolic extract, formulation extract (low, medium and high levels). Accuracy was determined by the regressed (measured) concentration represented as a percentage of the target (nominal) concentration. The percent relative standard deviation (% RSD) of the regressed (measured) concentrations was used to report precision. The inter precision and accuracy were verified by repeating the above procedure at three different occasions.
Recovery (%) = [(amount found
added] x 100. Values within the range of 85 accepted.
Limit of Detection (LOD) and Limit of Quantification (LOQ)
The detection limit was estimated from the signal This parameter was defined as the lowest concentration resulting in a peak area of three times the baseline noise. The quantitation limit was defined as the lowest concentration level that provided a peak area with a signal
than 10, with precision (% CV) within ± 20% and accuracy ( recovery) between 80% and 120%.
Linearity
The Linearity of a method is the measure of how well a calibration plot of detector response
approximates to a straight line. Eight concentration levels of each marker were selected for
experiment. For Harmine, concentration levels of 0.16
80.58 μg/mL were selected. Concentrations of Kaempferol were 0.07μg/mL to 35.52 μg/mL, Concentrations of Oleic acid were 0.13to 324.93 μg/mL, For Diosgenin, concentratio
25669, April, 2018
D
Fragmentation spectra of (A) Harmine (B) Diosgenin (C) Kaempferol Oleic acid
The selectivity of this method was performed by analysing 5 diluent blank, mobile phase blank. In order to test interference at the retention time of each bioactive component, terrestris L. fruits methanolic extract, formulation extract, 32.19 µg/mLDiosgenin standard solution, standard solution of 16µg/mL of Harmine, 7.10 µg/mL Kaempferol standard solution, 81.23µg/mL of Oleic acid standard solution were injected separately.
day data reflects the precision and accuracy of the method under the same conditions within one day. Intra-day accuracy and precision were obtained by analysing six replicates of three sample preparation of each of Tribulus
fruits methanolic extract, formulation extract (low, medium and high levels). Accuracy was determined by the regressed (measured) concentration represented as a percentage of the target (nominal) concentration. The percent relative d deviation (% RSD) of the regressed (measured) concentrations was used to report precision. The inter-day precision and accuracy were verified by repeating the above procedure at three different occasions.
Recovery (%) = [(amount found - original amount) / amount added] x 100. Values within the range of 85 - 115% were
Limit of Detection (LOD) and Limit of Quantification (LOQ)
The detection limit was estimated from the signal-tonoise ratio. This parameter was defined as the lowest concentration level resulting in a peak area of three times the baseline noise. The quantitation limit was defined as the lowest concentration level that provided a peak area with a signal-to noise ratio higher than 10, with precision (% CV) within ± 20% and accuracy (% recovery) between 80% and 120%.
Prakash L. Kondalkar et al., Simultaneous Quantification of Harmine, Kaempferol, Oleic Acid And Diosgenin By Lcms/Ms (Mrm) In The Fruit Extract of Tribulus Terrestris l. And its formulation
0.32μg/mL to 160.93μg/mL, were selected for linear dynamic range for experiment. The correlation coefficient was found to be ≥0.995.
Assay
5 μL of six sample preparation solution, i.e. Tribulus terrestris L. fruits extract and 5 μL of six preparation formulation were injected separately and analysed using the optimized chromatographic conditions. Peak areas were recorded for each analyte of interest and the amount of all the four analytes (Harmine, Kaempferol, Oleic acid and Diosgenin) was calculated by use of the calibration plot.
Robustness
Robustness of the method was studied by determining the effects of small variations of mobile phase pH (±0.2%), flow rate (1.00 ± 0.1 mL/min), column oven temperature (40 0C + 2
0
C). Effect of these deliberate changes on the response (area) and retention time of QC samples of Harmine, Kaempferol, Oleic acid and Diosgenin was observed during the analysis. The results were expressed in terms of % mean difference. Values within a difference range of ±5% were accepted.
Solution Stability
The stability of the stock solutions of all the three standards was evaluated by storing the solutions in refrigerator at 2-8 ºC for 72 hours and then comparing the results against freshly prepared stocks for each standard. Samples in triplicate were also subjected to bench top stability at 0 hrs, 24hrs, 48 hrs and 72 hrs respectively. Values within a difference range of ±5% were accepted.
RESULTS AND DISCUSSION
Extraction and sample preparation
Reflux extraction with mixture of 2 N hydrochloric acid and methanol in the ratio of 20:80 and finally liquid-liquid extraction with chloroform was the method of choice because of it was fastest, low experimental cost and efficient. In addition, Soxhletextraction provided low recovery and yield using different organic solvents. Various solvents along with reflux temperature and time were evaluated (methanol, acetonitrile, chloroform, Ethyl acetate).
Optimization of the Chromatography
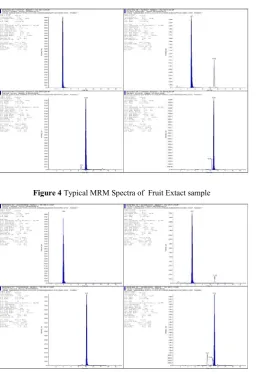
Gradient of Mobile phase A was Buffer [0.01 M Ammonium Acetate buffer; pH 7.5 adjusted with aqueous ammonia) and Mobile phase B was Acetonitrile: Methanol (80: 20)] was selected which gave a good resolution between the sample components. The MS spectra of Diosgenin and Harmine were recorded in positive ion mode [M + H]+, was the predominant ion in the Q1 spectrum was used as the precursor ion to obtain product ion spectra. The MS spectra of Kaempferol and Oleic acid were recorded in negative ion mode [M - H]- , was the predominant ion in the Q1 spectrum. The most sensitive and selective mass transitions were m/z 213.1 → m/z 198.1, m/z 415.2 → m/z 271.2 and pseudo transition for both m/z 284.9 → m/z 284.9as well as m/z 281.2 → m/z 281.2 for Harmine, Diosgenin, Kaempferol and Oleic acid respectively, obtained after the optimization of collision energy. Figure 2 illustrates the fragmentation spectra of each compound. Figure 3 to 5
shows typical MRM spectra with response for top left of Harmine, top right of Kaempferol, bottom left of Oleic acid and bottom right of Diosgenin.
Method Validation
Selectivity
No interference Peak was detected for all four biomarkers with acceptance criteria for all markers had mean interference per sample < 20% of the signal at the limit of quantification. Hence, the method demonstrated a high degree of selectivity. LOD, LOQ and Linearity
The method was found to be linear from 4.01-80.26 μg/mL for Harmine, 1.71-34.16 μg/mL for Kaempferol, 8.15-162.94 μg/mL for Oleic acid and 8.03-160.58 μg/mL for Diosgenin respectively. The correlation coefficient was found to be ≥0.995 for all the four components. Results of regression analysis are summarized in Table 4.
Table 4 LOD, LOQ and Linearity
Compound RT* Regression equation r 2 Linear range (μg/mL)
LOD (μg/mL)
LOQ (μg/mL)
Harmine 3.8 Y=307685 X +189809 0.9992 0.16-80.58 0.07 0.16
Kaempferol 5.0 Y=234117 X -48807 0.9997 0.07-35.52 0.02 0.07
Oleic acid 10.0 Y=95763 X +180609 0.9990 0.13-324.93 0.03 0.13
Diosgenin 11.0 Y=20882 X -18288 0.9994 0.32-160.93 0.12 0.32
RT* Retention time
Precision and Accuracy
In the repeatability study intra-day and inter-day precision of the HPLC method were investigated using replicate injection (n=3) of quality control samples of all the four standards. The developed method was found precise with % CV<2%.
International Journal of Recent Scientific Research Vol. 9, Issue, 4(B), pp. 25664-25669, April, 2018
Figure 4 Typical MRM Spectra of Fruit Extact sample
Figure 5 Typical MRM Spectra of formulation sample
Stability
Stock solution stability study of all the three standards stored for the period of 72 hours at 2-8°C showed % CV <2% with the % mean difference within ±5%. During bench top stability study, similar results were obtained. Stability studies showed that For Harmine, Kaempferol, Oleic acid and Diosgenin were found stable for at least 6.0 h at room temperature and 72 hours at 2-8°C of storage condition.
Robustness
Proposed method was not influenced by the factors considered for robustness study. Change in flow rate, mobile phase pH and column oven temperature affected the retention time of the four analytes but the area results were satisfactory since % CV was <2% with % mean difference <5%.
Recovery
The recovery values summarized in Table 5 and Table 6, for Tribulus terrestris Fruit Extract and Formulation Extract respectively all the four components were within acceptable limits (85.0 to 115.0%). This indicated that the method was reliable and accurate.
Table 5 Precision and accuracy data of fruit extract of Tribulus terrestris L.
Analyte Nominal conc. Measured conc. Precision Accuracy (μg/mL) MEAN + S.D. (%) (%) Harmine 0.16 0.15 + 0.0038 0.25 93.61
16.02 15.56 + 0.17 0.11 97.16 32.04 31.26 + 0.33 0.11 97.57
Kaempferol 0.07 0.07 + 0.02 0.36 101.12 7.02 6.98 + 0.02 0.02 99.36 14.05 13.54 + 0.20 0.15 96.40
Oleic Acid 0.12 0.13 + 0.0020 0.16 106.88 80.04 77.99 + 1.16 0.15 97.43 160.08 153.21 + 3.54 0.23 95.71
Diosgenin 0.32 0.33 + 0.0077 0.23 104.26 32.04 30.97 + 0.31 0.10 96.68 64.07 63.43 + 0.75 0.12 99.01
Table 6 Precision and accuracy data of Formulation extract of Tribulus terrestris L.
Analyte Nominal conc.
Measured
conc. Precision Accuracy
(μg/mL) MEAN + S.D. (%) (%)
Harmine 0.16 0.15 + 0.0060 0.39 96.74 16.02 15.63 + 0.07 0.05 97.56 32.04 30.49 + 1.58 0.52 95.18 Kaempferol 0.07 0.07 + 0.0017 0.26 93.24 7.02 6.85 + 0.08 0.12 97.48 14.05 14.05 + 0.29 0.21 100.04 Oleic Acid 0.12 0.13 + 0.0027 0.21 104.54 80.04 78.55 + 0.48 0.06 98.14 160.08 153.84 + 1.53 0.10 96.11 Diosgenin 0.32 0.32 + 0.0120 0.37 100.52
32.04 31.03 + 0.72 0.23 96.86 64.07 60.05 + 1.69 0.28 93.73
Table 7 Summary of method validation parameters
Parameter Harmine KaempferolOleic acid Diosgenin
Specificity Specific Specific Specific Specific Quantity in fruit Extract 0.016% 0.013% 0.254% 0.086% Quantity in Formulation Extract 0.008% 0.008% 0.112% 0.019%
Robustness*
Flow rate 0.42% 0.55% 1.08% 0.92% mobile phase 0.88% 1.12% 1.22% 1.32% Column temperature 0.64% 0.88% 0.89% 0.58% Stability at RT** 6hrs 6hrs 6hrs 6hrs Stability at 2-8° C 72 hrs 72 hrs 72 hrs 72 hrs
*Values are average % CV for robustness study ** Room temperature
CONCLUSION
A precise, accurate and reproducible LCMS/MS method is validated for simultaneous quantification of four bioactive markers Harmine, Kaempferol, Oleic acid and Diosgenin. Proposed method can be used as an analytical tool for quality evaluation of plants and formulations containing Harmine, Kaempferol, Oleic acid and Diosgenin as chemical markers. It is an efficient method to screen Tribulus terrestris L. fruit samples in order to assess its quality and authenticity. Hence, it can be demonstrated that LCMS/MS is a powerful practical tool for comprehensive quality control of plant raw materials and its formulations.
References
Prakash L. Kondalkar et al., Simultaneous Quantification of Harmine, Kaempferol, Oleic Acid And Diosgenin By Lcms/Ms (Mrm) In The Fruit Extract of Tribulus Terrestris l. And its formulation
evaporative light scattering detection. J Pharm Sci.; 90: 1752-1758.
2. Amin A, Lotfy M, Shafiullah M, Adeghate E. (2006) The protective effect of Tribulus terrestris L. in diabetes. Ann N Y Acad Sci.; 1084: 391-401.
3. Dinchev D., Janda B., Evstatieva L., Oleszek W., Aslani M. R., Kostova I.(2008) Distribution of steroidal saponins in Tribulus terrestris from different geographical regions. Phytochemistry.; 69(1):176-186. doi: 10.1016/j.phytochem.2007.07.003.
4. General Chapter <1225>, Validation of compendial methods, United States Pharmacopeia 32, National Formulary 27, Rockville, Md., USA, The United States Pharmacopeial Convention, Inc (2009).
5. General Chapter, Chromatography, United States Pharmacopeia 32, National Formulary 27, Rockville, Md., USA, The United States Pharmacopeial Convention, Inc (2009).
6. Gupta PK, Nagore DH, Kuber VV, Purohit S. (2012). A validated RP-HPLC method for the estimation of Diosgenin from polyherbal formulation containing Tribulus terrestris Linn. Asian J Pharm Clin Res. 5:91-94.
7. H. J. Fang, K. S. Bi, Z. Z. Qian et al. (2012) “HPLC-DAD-ELSD determination of five active components in Tribulus terrestris L. Chinese,” Journal of Pharmaceutical Analysis, vol. 32, article 6.
8. G. Saravanan, P. Ponmurugan, M. A. Deepa, and B. Senthilkumar (2014) Modulatory effects of diosgenin on attenuating the key enzymes activities of carbohydrate metabolism and glycogen content in streptozotocin-induced diabetic rats, Canadian Journal of Diabetes, vol. 38, no. 6, pp. 409-414.
9. ICH Q2R1: Validation of Analytical Procedures: Text and Methodology. Proceeding of the International Conference on Harmonization of Technical Requirements for the Registration of Drugs for Human Use, Geneva, Switzerland, (1996).
10. Louveaux A, Jay M, El Hadi OTM and Roux G. (1998) Variability in flavonoid content of four Tribulus terrestris. Journal of Chemical Ecology; 24(9): 1465-1481.
11. L. Xu, Y. Liu, T. Wang et al. (2009) Development and validation of a sensitive and rapid non-aqueous LC-ESI-MS/MS method for measurement of diosgenin in the plasma of normal and hyperlipidemic rats: a comparative study, Journal of Chromatography B, vol. 877, no. 14-15, pp. 1530-1536.
12. Vol. 126. The book has no author; it's a publication of Govt. of India. Ayurvedic Pharmacopoeia of India, 1st Ed, Vol. 1. Govt of India, Ministry of Health and Family Welfare Gokshura (Rt.) pp. 49-52 9 (1998).
13. Lehmann RP, Penman KG and Halloran KG. (2002) Comparison of photometric and HPLC-ELSD analytical methods for Tribulus terrestris. Revista de Fitoterapia; 2(S1): 217.
14. Kozlova OI, Perederiaev OI and Ramenskaia GV. (2011) Determination by high performance chromatography, steroid saponins in a biologically active food supplements containing the extract of Tribulus terrestris. VoprosyPitaniia; 80(6): 67-71. 15. Kole PL, Venkatesh G, Kotecha J, Sheshala R. (2011) R
ecent advances in sample preparation techniques for effective bioanalytical methods. Biomed Chromatogr. 25:199-217.
16. Obreshkova D, Pangarova T, Milkov S and Dinchev D.(1998) Comparative analytical investigation of Tribulus terrestris preparations. Pharmacia; 45(2): 11. 17. Q. Shi, B. Y. Yu, L. S. Xu, and G. J. Xu, (1999)
Determination of three hydrolytic flavonoid aglycones in Tribulus terrestris and atriplexcentralasiatica by RP -HPLC. Chinese Journal of Pharmaceutical Analysis, vol. 19:75-77.
18. Soni H, Patgiri B, Bhatt S. (2014) Quantitative determination of three constituents of RasayanaChurna (a classical Ayurvedic formulation) by a reversed phase HPLC. Int J Res Ayurveda Pharm. 5:17-22.
How to cite this article:
Prakash L. Kondalkar et al.2018, Simultaneous Quantification of Harmine, Kaempferol, Oleic Acid And Diosgenin By Lcms/Ms (Mrm) In The Fruit Extract of Tribulus Terrestris l. And its formulation. Int J Recent Sci Res. 9(4), pp.25664-25669.
DOI: http://dx.doi.org/10.24327/ijrsr.2018.0904.1904