Please cite this article as: M. Sarvi, M. Parpaei, I. Soltani, M. A. Taghikhani, Eagle Strategy Based Maximum Power Point Tracker for Fuel Cell System, International Journal of Engineering (IJE), TRANSACTIONS A: Basics Vol. 28, No. 4, (April 2015) 529-536
International Journal of Engineering
J o u r n a l H o m e p a g e : w w w . i j e . i r
Eagle Strategy Based Maximum Power Point Tracker for Fuel Cell System
M. Sarvi*, M. Parpaei, I. Soltani, M. A. Taghikhani
Department of Electrical Engineering, Imam Khomeini International University, Qazvin, Iran
P A P E R I N F O
Paper history:
Received 07 August 2013
Accepted in revised form 13 March 2015
Keywords:
Maximum Power Point Tracking Fuel Cell
Eagle Strategy Differential Evolution
A B S T R A C T
A bunch of factors including the limited fossil resources and rising of fossil fuel price have caused moving to create new structure that is based on providing energy security and protecting the environment. One of the alternatives is the fuel cell (FC). Maximum power point tracker has an important role in increasing the efficiency of the FC systems. One of the difficulties in maximum power point tracking methods is rapid changes in operating conditions which affects the maximum power point (MPP) of FC. The main contribution of this paper is presentation of a robust and reliable maximum power point tracking (MPPT) method for tracking of MPP of FC under fast variation of operating conditions. The proposed method is based on eagle strategy. In order to verify the accuracy of the proposed method, simulations are performed in MATLAB/SIMULINK. The proposed method is compared with perturb and observe (P&O) and fuzzy MPPT methods. The results show that eagle strategy based MPPT approach can track the MPP of fuel cell better than P&O and fuzzy MPPT. The main features of the proposed approach are high speed and high accuracy in MPP tracking of FC in any contingency.
doi: 10.5829/idosi.ije.2015.28.04a.06
1. INTRODUCTION1
Among renewable energy sources, fuel cell is getting more attention, because the efficiency of fuel cells is usually higher than other renewable energy sources [1]. Fuel cells are novel energy conversion methods that convert chemical energy to electric energy through chemical processes [2, 3]. Hydrogen can be found in abundance and it has low emission of pollutants and its production cycle reduces the greenhouse effect. In future hydrogen and fuel cell can play a pivotal role in controlling pollution in cities. Moreover fuel cell technology as well as consumers in the era of hydrogen, production technologies, storage, supply and transport of hydrogen is main component of the energy in the future.
There are several types of fuel cells, such as: proton exchange membrane fuel cell (PEMFC), phosphoric acid fuel cell, direct methanol fuel cell, molten carbonate fuel cell, solid oxide fuel cell, alkaline fuel cell, and regenerative fuel cell. The most common type
1*Corresponding Author’s Email: [email protected] (M. Sarvi)
of fuel cell that can be used in vehicle devices is the PEMFC [4, 5]. Features of this model of fuel cell are delivering high-power density, offering the advantages of low weight and volume, low temperature and quick start up. PEMFCs need only hydrogen, oxygen from the air, and water to operate and do not require corrosive fluids like some fuel cell. They are typically fueled with pure hydrogen supplied from storage tanks or on-board reformers [6]. Voltage that is produced by each cell is about 0.6 to 0.7 Volt at full rated load and the normal cell current density is about 1 ( / ). Therefore cells should be connected with each other in series and/or parallel, until the needed voltage is produced by fuel cell [7].
The main contribution of this paper is the presentation of a robust and reliable MPP method for tracking of MPP of FC under fast variation of operating conditions. The proposed method is based on eagle strategy. In the proposed method, eagle strategy based MPPT with a couple of differential evolution (DE-DE) and fuzzy logic controller are used. The proposed approach and fuzzy controller are integrated for making the intelligent controller. One of the important parameters in the optimization method is that the algorithm can find a point of maximal absolute and not with the local maximal points. Thus an intelligent optimization method is chosen that has the capability to find the absolute maximum point of object function, and accordingly output power of fuel cell is maximized.
The rest sections of paper are organized as following: section 2 describes fuel cell model. The proposed maximum power point tracking method is explained in section 3. Section 4 presents the results. Discussions and performance comparisons are presented in section 5. Finally, the conclusions are given in section 6.
2. FUEL CELL MODEL
A hydrogen PEMFC operates on two coupled half reactions; hydrogen oxidation reaction (HOR) at the anode, and oxygen reduction reaction (ORR) at the cathode. Other fuels can also be oxidized at a PEM fuel cell anode, such as methanol, ethanol, and formic acid. The anode and cathode electrochemical reactions are shown below [12]:
ïî ï í ì ® + + ® -+ 2 2 2 2 4 2 2 O e O e H H (1)
The overall hydrogen PEMFC reaction is: energy electrical heat O H O
H2+1/2 2= 2 + (2)
And the output voltage of each cell can be defined by following expression [10, 11]:
Conc ohm act Nerst
FC E V V V
V = - - - (3)
TheENerstequation with respect to standard reference temperature, 30℃ is [10]:
H2 O2
G S RT
ENerst T Tref P 1 2 P
2 F. 2 F. ( ) 2 F. [ln( ) / ln( )]
D D
= + - + + (4)
The defined parameters of Equation (4) are shown in Table 1. With standard pressure and temperature (SPT) values for ∆ and ∆ , Equation (4) can be changed to Equation (5) [13]:
2 2
3
1.229 0.85 10 ( 298.15)
5
4.30 10 [ln( ) 1 / 2 ln( )]
Nerst
H O
E T
T P P
-= - ´ - +
-´ +
(5)
Activation loss is caused by current flow. The total activation overvoltage is the sum of the anodic and cathodic voltage drops ( and ) [14, 15]:
) ln( ) ln( | | |
| a c 1 2T 3T Co2 4T Istack
Vact=h +h =x +x +x +x (6)
These values are defined based on theoretical equations with kinetic, thermodynamic, and electrochemical foundations. The defined parameters of Equation (6) are shown in Table 2; where
2
O
C is equal to [13]:
) 10
08 . 5
( 6 498/
2 2 T O O e P C -´ ´ = (7)
Resistance of the polymer membrane in the electron and proton transfers creates ohmic losses and it can be expressed as:
ohmic stack
ohm I R
V = (8)
where Rohmic is equal to:
A t r
R mm
ohmic = (9)
The defined parameters of Equation (9) are shown in Table 3.
TABLE 1. Parameter explanations of ENerst.
Quantity Explanations Dimension
∆G The change in the free Gibbs energy (J/mol) F Constant of Faraday (96.487C)
∆S Change of the entropy (J/mol) R The universal constant of the gases (8.314J/kmol) PH2 Partial pressure of hydrogen (atm)
PO2 Partial pressure of oxygen (atm)
T Cell operation temperature (K) Tref Reference temperature (K)
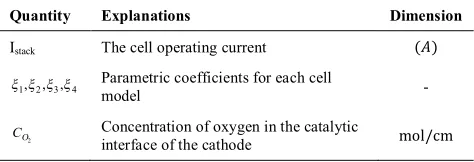
TABLE 2. Parameter explanations of Vact (voltage) drop.
Quantity Explanations Dimension
Istack The cell operating current ( )
4 3 2 1,x,x,x
x Parametric coefficients for each cell
model -
2
O
C Concentration of oxygen in the catalytic
interface of the cathode mol/cm
TABLE 3. Parameter explanations of Rohmic (Equation (9)).
Quantity Explanations Dimension
rm Resistance of membrane to proton conductivity Ωcm
A The cell active area cm2
Membrane resistivity depends on membrane temperature and it can be expression by [13]:
)]] 303 ( 18 . 4 exp[ ) ( 3 634 . 0 [ ] ) ( ) 303 ( 0062 . 0 ) ( 03 . 0 1 [ 6 .
181 2 2.5
2 T T A I A I T A I C m stack stack O -+ + = l (10)
That λm is the membrane water content and it is variable between 0 and 23, which is equivalent to the relative humidity of 0 and 100% . The resulting concentration polarization will cause mass transport loss, and a rapid drop in cell voltage at high current densities. Total mass transfer is sum of the anode mass transfer voltage and cathode mass transfer voltage. This voltage drop is expressed as:
) 1 ln(
,
, i A
I nF RT V V V L c conc a conc
conc =D +D =
-D (11)
is the limiting current that denotes the maximum rate of a reactant can be supplied to an electrode.
3.MAXIMUM POWER POINT TRACKING
DESCRIPTION
Different methods for maximum power point tracking (MPPT) have been reported such as Fuzzy maximum power point tracking [8, 16], Perturb and Observe (P&O) [9], adaptive maximum power point tracking (MPPT) control [10], voltage and current based MPPT [11]. In this section, the proposed MPP method for tracking of MPP of FC under fast variation of operating conditions is presented. The proposed method is eagle strategy with the couple of differential evolution. The block diagram of the proposed maximum power point tracker is shown in Figure 2.
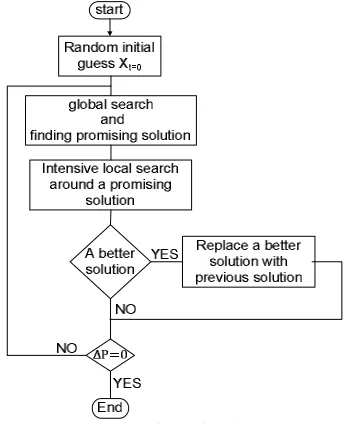
3. 1. The Proposed Eagle Strategy based MPPT Eagle strategy has two-stage method including the global search and intensive local search [17]. In this strategy, at the first stage, the global optimization algorithms with levy distribution are employed for generating stochastic population and then in the second stage, intensive local stage is employed for obtaining more accuracy and then two stage process is restarted again. One of the advantages of this strategy is ability of using different algorithms in different stages. In this paper differential evolution in both stages is employed. Figure 1 shows the proposed MPP tracker and Figure 2 shows the flowchart of eagle strategy.
3. 1. 1. Differential Evolution Differential evolution (DE) is a population-base and derivative-free [18]. The advantage of this algorithm over genetic algorithm (GA) is that DE treads solution as real-number strings and no encoding and decoding are needed.
FC
V
optimum
V
Figure 1. The block diagram of the proposed maximum power point tracker for FC.
In differential evolution, a difference vector of two randomly-chosen population vectors is used to remodel an existing vector as mutation. This is applied in each population vector. In every generation , we have that is equal to [17]:
) ,..., ,
( 1, 2, t, i d t i t i t
i x x x
x = (12)
where is stochastic point, is number of repeat, is
ℎ stochastic variable, and is dimension of object function. Mutation, crossover, and selection are three main steps of differential evolution.
· Mutation step - For movement of stochastic vectors,
three points are chosen randomly form
) ,..., ,
( 1t 2t npt t
i x x x
x Î that
is population size of
differential evolution algorithm.
) ( 1 t r t q t p t
i x F x x
v+ = + - (13)
where v is mutation vector, t
r t q t
p x x
x , , are three
random vectors and parameter F is in the range of [0, 2] called differential weight.
· Crossover step- This step is defined as follows [18]:
ïî ï í ì = £ = + + + otherwise x u C r v u t j i t j i r i j i t j i 1 , 1 , , 1 , (14)
where u is crossover vector that it is controlled by crossover probability (Cr ∈ [0, 1]) and ri is uniformly distributed random number ri ∈ [0, 1] and j is jth component of vi.
·Selection step- Selection step for maximization is
detecting of the maximum object value.
for search stage, randomization via levy flight can be used. Stochastic data is generated by levy distribution with an index β as follows:
t t
p
b
at d
e s s
L =
ò
¥-0 cos( )
1 )
( (15)
where L(s) is levy distribution, α and β are constant coefficient. For most applications, we can set α=1. It is relevant to note that if set β=1, L(s) becomes Cauchy distribution and if set β=2, L(s) becomes normal distribution.
3. 1. 3. Fuzzy Logic Controller The active power flow from fuel cell is controlled by fuzzy logic controller. The error term is difference between output of eagle strategy (optimal point for output power) and fuel cell flowing power. The fuzzy controller has following five steps:
· definition of input-output variable
· fuzzy control rule
· fuzzification
· inference
· defuzzification
The block diagram of fuzzy controller is shown in Figure 3.
Figure 2.Flowchart of eagle strategy.
Figure 3. Fuzzy controller block diagram.
Figure 4. Membership function of E, CE, and d.
TABLE 4. Fuzzy rules.
E
CE NB NM Z PM PB
NB NB NB NM NM Z
NM NB NM NM Z PM
Z NM NM Z PM PM
PM NM Z PM PM PB
PB Z PM PM PB PB
The maximum of fuel cell power function is calculated by eagle strategy. This amount is as set point of controller and it is compared with the actual power of fuel cell. The difference between actual and calculated power of fuel cell is called error (E). Error and changing of error (CE) are inputs of fuzzy controller and duty cycle of converter (d) is output. E and CE parameters are determined as follows:
) ( )
(K V V K
E = FCactual - FCcalculated (16)
) 1 ( ) ( -
-=E K E K
CE (17)
A Mamdani inference is used as fuzzy inference system. Fuzzy controller based on these inputs and fuzzy rules change operating point of fuel cell. The inputs and output membership functions are similar and are shown in Figure 4. Fuzzy rules are shown in Table 4.
4. SIMULATION RESULTS
Case 1. Constant temperature and membrane water content condition (T=343°K, λ=13) with eagle strategy based MPPT and fuzzy controller
Case 2. Temperature variations and constant membrane water content with eagle strategy based MPPT and fuzzy controller
Case 3. Membrane water content variations and constant temperature with eagle strategy based MPPT and fuzzy controller
4. 1. Constant Temperature and Membrane Water Content Condition with Eagle Strategy based MPPT and Fuzzy Controller The eagle strategy and fuzzy controller is imposed on the fuel cell and simulations are performed in constant conditions (T=343°K, λ=13). The results are shown in Figures 6 and 7. Fuel cell power and voltage versus time in constant membrane water content (λ=13) and constant temperatures (T=343 K) are shown in Figures 6 and 7, respectively. These results show that this strategy can control the maximum power point of fuel cell.
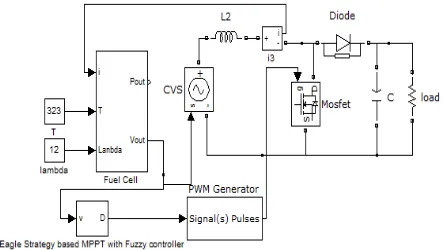
Figure 5. Configuration of simulation.
TABLE 5. Model parameters.
Model parameters
Faraday’s constant: F (Ckmol-1) 96484600
Number of cell 35
The partial pressures of oxygen: PO2(atm) 1
The partial pressures of hydrogen: PH2 (atm) 3
The cell active area: A (cm2) 232
Parametric coefficients for each cell model :
4 3 2 1,x ,x ,x
x
ï ï î ï ï í ì
-=
-= = -=
4 96 . 1
8 8 . 7
00354 . 0
944 . 0
4 3 2 1
e e
x x x x
Membrane thickness: tm (cm) 0.0178
Universal gas constant:R (Jkmol-1K-1) 8314.47
Limiting current: il (A) 2
Switching frequency 20000 Inductance of boost converter: L (H) 4.8e-3 Capacitance of boost converter: C (F) 1200e-6
Figure 6. Power of fuel cell with eagle strategy and fuzzy controller in T=343 K and λ=13.
Figure 7. Voltage of fuel cell with eagle strategy and fuzzy controller in T=343 K and λ=13.
The results show that proposed approach can control the fuel cell in the maximum power point. The optimal power corresponding to λ=13 and T=343 K is 8.0694 kW. As seen in above figures, eagle strategy can control power of fuel cell in 0.998% of maximum power point (8.058 kW).
4. 2. Temperature Variations and Constant Membrane Water Content with Eagle Strategy
based MPPT and Fuzzy Controller In this case,
it has been assumed that, the membrane water content (λ) is constant and temperature is changed. The value of
λ is considered 13 and the step changing is considered for temperature (as shown in Figure 8). Fuel cell power and voltage versus time in constant membrane water content (λ=13) and various temperatures are shown in Figures 9 and 10, respectively. As seen in figures, the eagle strategy can track the maximum power point with high speed and low error. These are the advantages of this strategy.
Figure 8. Step variations of temperature.
Figure 9. Temperature variations at λ =13 and tracking the new maximum power point.
Figure 10. Temperature variations at λ =13 and tracking the new voltage for maximum.
Figure 11. Step variations of membrane water content.
Figure 12. Membrane water content variations at T=323K and tracking the new maximum power point.
Figure 13. Membrane water content variations at T=323K and tracking the new voltage for maximum power point.
Fuel cell power and voltage versus time at constant temperatures (T=323 K) and various membrane water contents are shown in Figures 12 and 13, respectively. As seen in these figures, with imposing the step variations of temperature or membrane water content, the proposed method can accuratly track maximum power point of fuel cell.
5. COMPARISONS AND DISCUSSIONS
TABLE 6. Comparison among three types of methods at the same condition (λ=13 and temperature variations).
Temperature
MPPT method
T=313 (K) T=353 (K)
Maximum power (kW) Accuracy (%) Maximum power (kW)
Accuracy (%)
Real value Simulated value Real value Simulated value
Eagle strategy 6.1625 6.1570 99.8 8.6999 8.688 99.7
Fuzzy 6.1625 6.050 98 8.6999 8.496 97.6
P&O 6.1625 5.764 93.5 8.6999 7.652 87.9
TABLE 7. Comparison between 3 types of methods at the same condition (T=323K and membrane water content variations).
Memberane water content MPPT method
λ=11 λ=15
Maximum power (kW) Accuracy (%) Maximum power (kW)
Accuracy (%)
Real value Simulated Value Real value Simulated value
Eagle strategy 5.860 5.854 99.8 7.6871 7.676 99.8
Fuzzy 5.860 5.797 98.9 7.6871 7.472 97.2
P&O 5.860 5.637 96.1 7.6871 6.742 87.7
Figure 14. Temperature variations at λ=13.
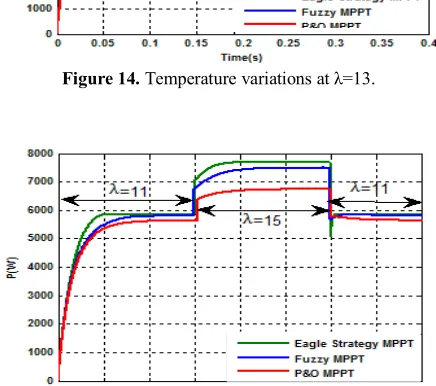
Figure 15. Membrane water content variations at T=323K.
Comparisons are summarized in Tables 6 and 7. As seen in Figures 14 and 15, as well as Tables 6 and 7, the proposed method (eagle strategy based MPPT) can find and track the maximum power point of fuel cell better than P&O and Fuzzy MPPT. On the other hand, the proposed approach has higher accuracy and is more reliable in comparison with the P&O and fuzzy MPPT methods. Advantages of the proposed approach are low steady state error of about less than 1%, and no overshoot and swift.
6. CONCLUSION
In this paper, in order to determin the optimal operation condition of fuel cell, a new MPP tracker is proposed. In order to investigate the performance and accuracy of the proposed maximum power point tracking method, a system consisting of a PEM fuel cell, a DC/DC boost converter, a resistive load, and MPP tracker is considered and simulated. Simulations are performed in MATLAB/SIMULINK environment at different conditions. Furthermore, the performance of the proposed method are compared with fuzzy and P&O MPPT methods. The main features of the proposed approach are high speed for duty cycle determining and high accuracy in maximum power point tracking in any contingency. The other advantage of the proposed strategy is that it can be programmed with any optimization algorithm in the global search space and intensive local search space. The comparison of the performance of the proposed method with P&O and fuzzy MPPT indicates that the proposed method can track the maximum power point of fuel cell better than P&O and fuzzy MPPT. On the other hand, the proposed approach has higher accuracy and is more reliable in comparison with the P&O and fuzzy MPPT methods.
7. REFERENCES
1. Kouhi, S., Ranjbar, M.R., Mohammadian, M., and Khavaninzadeh, M., “Economic Aspect of Fuel Cell Power as Distributed Generation”, International Journal of Engineering Transactions A: Basics, Vol. 27, No. 1 (2014), 57-62. 2. Sedighizadeh, M., Farhangian Kashani, M., “A Tribe Particle
Swarm Optimization for Parameter Identification of Proton Exchange Membrane Fuel Cell”, International Journal of Engineering, Transactions A: Basics, Vol. 28, No.1, (2015), 16-24
Journal of Engineering,Transactions B: Applications , Vol. 20, No. 2 (2007), 179-192.
4. Andujar, J.M. and Segura, F., “Fuel cells: History and updating a walk along two centuries”, Renewable and Sustainable Energy Reviews, Vol. 13, (2009), 2309–2322.
5. Zhang, X., Guo, J., and Chen, J., “The Parametric Optimum Analysis of a Proton Exchange Membrane (PEM) Fuel Cell and Its Load Matching”, Energy, Vol. 35, (2010), 5294-5299 6. Anne-Claire D., “Proton exchange membranes for fuel cells
operated at medium temperatures: Materials and experimental techniques”, Progress in Materials Science, Vol. 56, (2011), 289–327.
7. Anthony, D.S., john, B., and Jae, W. P., “Design strategy for a polymer electrolyte membrane fuel cell flow-field capable of switching between parallel and interdigitated configurations”, Hydrogen Energy, Vol. 38, (2013), 5807-5812.
8. Algazar, M., AL-monier, H., and Abd El-halim, H., “Maximum Power point tracking using fuzzy logic controller”, Electrical Power and Energy System, Vol. 39, (2012), 21-28.
9. Femia, N., Petrone, G., Spagnuolo, G., and Viteli, M.,
“Optimization of Perturb and Observe Maximum Power Point Tracking Method”, IEEE Transaction on Power Electronics,
Vol. 20, (2005), 963-973.
10. Zhi-dan Z., Hai-bo, H., Jian, Z.X., Yi, C.G., and Yuan, R.,
“Adaptive maximum power point tracking control of fuel cell power plants”,Journal of Power Sources, Vol. 176, (2008), 259–269.
11. Sarvi, M. and Barati, M.M., “Voltage and Current Based MPPT of Fuel Cells under Variable Temperature Conditions”,
International UPEC, 31st Aug. – 3rd Sep., Cardiff, Wales, UK, (2010) 1-4.
12. Das, P. K., li, X., and liu, Z., “Analysis of liquid water transport in cathode catalyst layer of PEM fuel cells”, Hydrogen Energy,
Vol. 35, (2010), 2403-2416.
13. Corrêa, J. M., Farret, FA., Canha, L. N. and Simões, M. G., “An Electrochemical-Based Fuel-Cell Model Suitable for Electrical Engineering Automation Approach”, IEEE Transactions on Industrial Electronics, Vol. 51, (2004), 1103-1112.
14. Corrêa, J. M., Farret, FA., Gomes, J. R., and Simões, M. G.,
“Simulation of Fuel-Cell Stacks Using a Computer- Controlled Power Rectifier With the Purposes of Actual High- Power Injection Applications”, IEEE Transactios on Industrial Applications, Vol. 39, (2003), 1136-1142.
15. Sarvi, M., Parpaei, M., Bagheri, H., Alkaei kojoori, M.R.,
“Optimal Operation and Output Oscillations Reduction of PEMFC by using an Intelligent Strategy”, International Journal of Electrochemical Science, Vol. 9, (2014), 4172 - 4189.
16. Mammar, K. and Chaker, A., “Fuzzy logic control of fuel cell system for residential power generation”,Journal of Electrical Engineering, Vol. 60, (2009), 328-334.
17. Gandomi, A.H., Yang, X.S., Talatahari, S. and Debd, S.,
“Coupled eagle strategy and differential evolution for unconstrained and constrained global optimization”, Computers and Mathematics with Applications, Vol. 63, (2012), 191–200. 18. Storn, R. and Price, K.V., “Differential evolution a simple and
efficient heuristic for global optimization over continuous spaces”, Journal of Global Optimization, Vol. 11, (1997), 341–
359.
Eagle Strategy Based Maximum Power Point Tracker for Fuel Cell System
M. Sarvi, M. Parpaei, I. Soltani, M. A. Taghikhani
Department of Electrical Engineering, Imam Khomeini International University, Qazvin, Iran
P A P E R I N F O
Paper history:
Received 07 August 2013
Accepted in revised form 13 March 2015
Keywords:
Maximum Power Point Tracking Fuel Cell
Eagle Strategy Differential Evolution
هﺪﯿﮑﭼ
ﺖﺧﻮﺳﺶﯾاﺰﻓالﺎﺣردﺖﻤﯿﻗودوﺪﺤﻣﯽﻠﯿﺴﻓﻊﺑﺎﻨﻣﻞﻣﺎﺷيدﺪﻌﺘﻣﻞﻣاﻮﻋ
دﺎﺠﯾاﺖﻤﺳ ﻪﺑﺖﮐﺮﺣﺐﺟﻮﻣﯽﻠﯿﺴﻓ يﺎﻫ
ﻂﯿﺤﻣزا ﺖﻈﻓﺎﺤﻣويژﺮﻧاﺖﯿﻨﻣاﺮﺑﯽﻨﺘﺒﻣﺪﯾﺪﺟيرﺎﺘﺧﺎﺳ
ﺖﺳاهﺪﺷﺖﺴﯾز
.
هارﻦﯾازاﯽﮑﯾ
ﺖﺳاﯽﺘﺧﻮﺳﻞﯿﭘﺎﻫرﺎﮐ
.
ﻣﺶﻘﻧﻪﻨﯿﺸﯿﺑناﻮﺗﯽﺑﺎﯾدر
ﻢﺘﺴﯿﺳهدزﺎﺑﺶﯾاﺰﻓاردﯽﻤﻬ
ﯽﻣﺎﻔﯾاﯽﺘﺧﻮﺳﻞﯿﭘيﺎﻫ
ﺪﻨﮐ .
لﺎﺒﻧديﺎﻫشورردتﻼﮑﺸﻣزاﯽﮑﯾ
دراﺬﮔﯽﻣﺮﯿﺛﺄﺗناﻮﺗﺮﺜﮐاﺪﺣﻪﻄﻘﻧيورﻪﮐﺖﺳادﺮﮑﻠﻤﻋﻂﯾاﺮﺷرد ﻊﯾﺮﺳتاﺮﯿﯿﻐﺗ،ناﻮﺗﺮﺜﮐاﺪﺣﻪﻄﻘﻧندﺮﮐ
. ﻢﻬﻣ ﻦﯾﺮﺗ
وموﺎﻘﻣﯽﺘﺧﻮﺳﻞﯿﭘﻪﻨﯿﺸﯿﺑناﻮﺗﯽﺑﺎﯾدرشورﮏﯾﻪﺋارا،ﻪﻟﺎﻘﻣﻦﯾايروآﻮﻧ
ﺖﺤﺗناﻮﺗﺮﺜﮐاﺪﺣﻪﻄﻘﻧﯽﺑﺎﯾدرياﺮﺑﻦﺌﻤﻄﻣ
ﺖﺳاﯽﺘﺧﻮﺳﻞﯿﭘﻢﺘﺴﯿﺳدﺮﮑﻠﻤﻋﺖﯿﻌﺿوﻊﯾﺮﺳتاﺮﯿﯿﻐﺗ
.
ﺖﺳابﺎﻘﻋيﮋﺗاﺮﺘﺳاﺮﺑﯽﻨﺘﺒﻣهﺪﺷﻪﺋاراشور
.
ﺪﯿﯾﺄﺗرﻮﻈﻨﻣﻪﺑ
ﺖﺤﺻ
ﻪﯿﺒﺷ،يدﺎﻬﻨﺸﯿﭘشور ﺖﻗد و
يزﺎﺳ
ﻂﯿﺤﻣ ردﺎﻫ
/SIMULINK MATLAB
هدﺎﯿﭘ
ﺖﺳاهﺪﺷيزﺎﺳ
. شور
شورﺎﺑيدﺎﻬﻨﺸﯿﭘ
ﺑﺎﯾدريﺎﻫ
هﺪﻫﺎﺸﻣوشﺎﺸﺘﻏاﺮﺑﯽﻨﺘﺒﻣﯽ
(P&O)
ﺖﺳاهﺪﺷﻪﺴﯾﺎﻘﻣيزﺎﻓو
. ﺖﯾﺰﻣ
شورﯽﻠﺻايﺎﻫ
ﺖﺳاتوﺎﻔﺘﻣﻂﯾاﺮﺷردﯽﺘﺧﻮﺳﻞﯿﭘﻪﻨﯿﺸﯿﺑناﻮﺗﻪﻄﻘﻧﯽﺑﺎﯾدرردﺮﺗﻻﺎﺑﺖﻗدوﺖﻋﺮﺳ،هﺪﺷﻪﺋارا
.