Generators, International Journal of Engineering (IJE), TRANSACTIONS B: Applications Vol. 28, No. 2, (February 2015) 305-313
International Journal of Engineering
J o u r n a l H o m e p a g e : w w w . i j e . i rNumerical Study on Improvement of Hydrofoil Performance Using Vortex
Generators
Marine Engineering Department, AmirKabir University of Technology, Tehran, Iran
P A P E R I N F O
Paper history: Received 08 August 2014
Received in revised form 09 November 2014 Accepted 13 November 2014
Keywords:
Hydrofoil Drag Reduction Vortex Generators Finite Volume Method Source Term
A B S T R A C T
In this paper, the effects of rigid triangular passive vortex generators on a hydrofoilwere
modeled. Also, the results of lift and drag coefficients were validated using experimental data. In the next step, the hydrofoil equipped with vortex generators was modeled. So, its effect on the hydrofoil performance was examined. In the next step,by introducing a source term into the momentum equation the effect of vortex generators was considered. Their geometry, however, was completely removed. The results showed that this can significantly decrease the computational memory and calculation time. Furthermore, the results revealed that the use of vortex generators can delay the stall conditions by increase the stall angle leading to a higher lift coefficient in new stall angleand decreasing the drag coefficient. In a case study on NACA 0012 section profile results showed that the use of vortex generators increases the stall angle by 4 degrees and the lift coefficient at this point by 37%.
doi: 10.5829/idosi.ije.2015.28.02b.18 NOMENCLATURE
Wall shear stress Isotropic pressure
h VG height Energy
Boundary layer thickness Thermal coefficient
Angle of incidence for VG Temperature
Z Distance between two pairs of VGs ̇ Thermal transfer per unit mass
C Chord of VG Property of fluid flow
E Chord of VG Diffusion coefficient
d Distance between two VGs Source term
Control volume Function of lift force
s Control surface Area of VG plate
n Normal vector of surface Volume of effective cells
Velocity vector Summation of those cells exposed to forces
Density Flow velocity
T Time Unit vector
Volume forces per unit volume Coefficient for relaxation factor
̿ Tensor of viscous stress Lift coefficient
Drag coefficient
RESEARCH NOTE
*Corresponding Author’s Email: [email protected]
investigatednumerically. In the first step, using the Finite Volume Method forbare hydrofoil was A. Ashrafi, M. J. Ketabdari*,H. Ghassemi
r (M. J. Ketabdari)
1. INTRODUCTION
There is a large energy loss in boundary layer due to separation phenomenon. Flow control technics such as flow injection, suction, surface coating and cavitators are important tools to reduce this flow separation. Increasing the system performance such as reduction of take-off and landing length of an aircraft, and increasing airfoil maneuverability are the most positive effects of flow control technics. The way of approach as well as the cost of operations and technics for flow control is significant parts of the flow control. Therefore, it is the aim of designers to go for low-cost technics, simple and durable systems in aero and hydromechanics [1, 2].
The efficiency of these methods depends on the physical source of drag. One of the most practical drag reduction approaches is employment of some active or passive vortex generators (VGs) which are usually placed on the near wall regions. The main idea behind the employment of the vortex generators is to particularly increase the flow momentum inside the boundary layer region. Thus, the desired pressure gradient increases and causes a delay on flow separation [3].
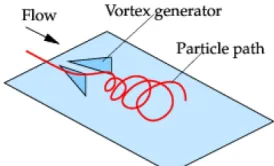
The VG is considered as a static mechanical device which modifies the fluid boundary layer motion to bring momentum from the outer region into the inner one. Figure 1 illustrates the operation of VGs on the surface transferring momentum towards the wall increasing the velocity in the inner region. Minimization of the boundary layer thickness leads to an increase in the wall shear stress ( ). This is desirable for the surface if it works near the stall point. For the stall point placed off to another point on the surface, lift and drag coefficients could be changed. The VG’s general function is generating helical stream wise vortex (seeFigure 1). All the passive and solid types of VGs operate by their geometry property [4, 5].
2. TYPE OF VGs:
VGs are divided into two types as:
· Active VGs
· Passive VGs
Active VGs are divided into three types as well [6-11]:
· Jet VGs
· Oscillating VGs
· Pop-up VGs
Conventional types of VGs are usually passive types like a plate installed on the surface. The VG height (h) is in the order of the boundary layer thickness ( ), introduced by Taylor in the late 1940s. This apparatus includes a row of small plates projected normal to the surface and set at an angle of incidence ( ) to the local flow to make an array of streamwise trailing vortices.
Kuethe developed and optimized some type of VGs with ℎ ⁄ of 0.27 to 0.42. These low-profile devices successfully reduce the wake region by vortex generation. For height of passive VGs two types are introduced. The first one is vane type which has somewhat equal height with boundary layer thickness (ℎ ⁄ ≈1) and the second one is micro VGs or sub-boundary layer VGs (low-profile) which has a height of 10% to 50% of boundary layer thickness.
Figure 2 demonstrates difference between two types of passive VGs clearly [1-9].
In 1961, Pearcy [12] studied the shape of VGs. Figure3 shows different types of VGs based on important design factors. For instance, distance between two pairs of VGs (z), chord (e or c), attack or incident angle ( ), height (h), distance between two VGs (d) and arrangement of VGs are some of these parameters [10, 11].
Figure 1. Function of VGs on the surface by generating vortex [4]
(a)
(b)
Pauly and Eaton performed experimental studies for counter-rotating arrangement of vortex pairs. They mentioned that VG system generating “common flow up” vortex structures has less effect on flow separation control (see Figure 4). It is because the vortices tend to travel away from the surface. Furthermore, recent studies showed that so-called sub-boundary layer VGs have major advantages in comparison to the bigger vane type VGs[12].
Figure 3. Types of passive VGs [12]
Figure 4. VGs generating vortex structure by their arrangement on the surface [12]
3. GOVERNER EQUATIONS
The governing equations for this problem in integration form of finite volume method (FVM) can be expressed as:
Continuity:
∫ ΩΩ +∮ ( ⃗. ⃗) =0 (1)
Momentum:
∫ ⃗ ΩΩ +∮ ⃗( ⃗. ⃗) =∫ Ω ⃗ Ω −
∮ ⃗ +∮ ( ̿. ⃗) (2)
And energy:
∫Ω Ω+∮ (⃗. ⃗) =∮ (∇ . ⃗) +
∫Ω( ⃗.⃗+ ̇) Ω − ∮ (⃗. ⃗) +∮ ( ̿.⃗). ⃗ (3)
where, Ω is the control volume, is the control surface, is the normal vector of surface, is the velocity vector, is the density, is the time, is the volume forces per unit volume, ̿ is the tensor of viscous stress, is the isotropic pressure, is the energy, is the thermal coefficient, is the temperature, and ̇ is the thermal transfer per unit mass [13]. These equations can be contracted to one equation so-called “Transfer equation” (Equation (4)):
∫ . ( ) =∫ . (Γ ) +∫Ω Ω (4)
where, denotes the property of fluid flow, Γ is the diffusion coefficient and is the source term [14].
Source Term (ST) method was developed by Bender [15] to describe the VG modeling in Navier-Stokes (N-S) codes. The ST was introduced by which is a function of lift force, normal to the local flow:
= (∆∆ ) (5)
where, is the area of VG plate, is the volume of effective cells, is the summation of those cells exposed to forces, is the incident angle, is the flow velocity, is the unit vector and is a coefficient for relaxation factor or a calibration constant [15].
4. NUMERICAL MODELING
In this section, the effect of installing a pair of passive VGs on a NACA 0012 hydrofoil was investigated using FVM. Three cases were studied here including:
1) Bare hydrofoil
The hydrofoil had a chord of 0.6 m and a spam of 0.1 m. The Reynolds number (Re) for creating turbulent flow around the hydrofoil was adjusted for about 106.
Developing a code the hydrofoil body was constructed using the NURBS curve. Figure 5 shows the profile for hydrofoil characteristics such as the coordinate of directions. Meanwhile, Table 1 gives full information for flow analysis around this body.
Figure 6 illustrates the arrangement for VGs and Figure 7 shows 3D hydrofoil equipped with VGs.
In the first place, bare hydrofoil (case one) was investigated. Also, − model was coupled with transfer equation to model the turbulence. In the second place, hydrofoil equipped with VGs (case two) was studied to consider the effect of VGs for flow around the hydrofoil. The results showed that studying the VGs needs a very fine grid generation.
TABLE 1. Necessary information for flow analysis around hydrofoil
Hydrofoil and flow information
= 0,4,8,16,20,24 ° = 1 = 10°
= 1000 kg⁄ = 0.1 = 1.307 × 10
≈2 × 10
= 4 ⁄ = 0.6 = 1.307 × 10
.
VGs Information
ℎ= 5 = 0.2 = 17.721
= 44.303 = 16.4° = 10
Information on flow analysis by FVM
Pressure based Implicit Steady
Green-Gauss cell based 2nd upwind Incompressible Fluid
Figure 5. Profile of 3D NACA 0012
Figure 6. VGs arrangement
Figure 7. 3D hydrofoil with VGs on the surface
Especially close to the vortex generators, the solution is very time consuming. In the next step, using semi-empirical models (case three) such as introducing a source term into momentum equation was tried to simulate the effects of VGs and completely remove the VGs’ geometry. To avoid demanding programming a new CFD code, Fluent software was used to carry out the simulation and its UDF ability helped to adding source terms to momentum equations. Therefore, the effort was concentrated on connecting the vortex model to source terms of momentum equations. In this step, the effect of VGs was factored in a source term. This method is supposed to significantly decrease the computational time by implementing of the ST in some cells where VGs were removed. In effect, the ST model is invoked in Fluent by specifying a region as a boundary condition to a small group of cells containing the VG to bemodeled.
It should be noticed that considering the incident angle of VGs needs 3D shape hydrofoil leading to a 3D mesh generation because of creating helix flow. Thus, in all cases the 3D meshes were used to simulate the hydrofoil. Figure 8 shows a 3D sample of meshes generated for this problem.
5. RESULTS
Figure 8. 3D fine mesh around VGs
The results for hydrofoil equipped with VGs are presented in Table 3. In addition, Figure 11 shows the lift and drag coefficients for different attack angles of hydrofoil with VGs and its comparison with experimental data of Abbott and Von Doenhoff (no VGs) [16]. In this case, the time to analyze each model was about 2.5 to 3 hours. The total elements in domain were about 538000. Figure 11 clearly shows that the peak of lift coefficient is shifted to hydrofoil angle of α=24° when using VGs. Thus, the stall point has been put off relevantly.
TABLE 2. Lift and drag coefficients for different attack angles of bare hydrofoil for model and experiment [16]
Experiment CFD/bare hydrofoil
°
0 0 0.01 0 0.011992
4 0.3 0.018 0.36336 0.014992
8 0.61 0.037 0.77369 0.029095
12 0.91 0.059 1.002 0.036439
16 1.2 0.098 1.1232 0.11577
20 1.43 0.14 1.4951 0.1486
24 1.12 0.32 1.1365 0.33744
Figure 9. Mesh independency study
(a)
(b)
Figure 10. Comparison between model and experimental data of bare hydrofoil in different attach angles a) Lift ( ) and b) Drag ( )coefficients [16]
TABLE 3. Lift and drag coefficients for different attack angles of hydrofoil equipped with VGs
CFD/ hydrofoil +VG
°
0 0 0.01019
4 0.39328 0.01721
8 0.68786 0.03665
12 0.9456 0.06348
16 1.103 0.1002
20 1.31 0.1845
24 1.78 0.2487
26 1.61821 0.5048
28 1.6152 0.64967
(a)
(b)
Figure 11. Comparison between model results (hydrofoil with VGs) and experimental data (bare hydrofoil) in different attach angles a) Lift ( ) and b) Drag ( )coefficients [16]
= 4 ° = 0 °
= 0.14
= 0.7
= 1
Figure 12. Downstream Velocity contours for hydrofoil equipped with VGs for = 0° and 4° and different cross-sections in x-direction
In x=0.14m tiny helixes are created by incident angle of VGs.As time marches on, the helixes are being stretched downstream as it is shown for x=0.7m. This causes the mixing between outer and inner flow in boundary layer district and prevent from separation at lower attack angles. Enhancement of lift coefficient is result of this phenomenon.Also, Figure 13 clearly shows the mixing in the first 20%-40% chord lengthon the suction side for = 20 ° and = 24 ° in XY planes.
= 0 °
= 4 °
= 8 °
= 16 °
= 20 °
= 24 °
Figure 13. Velocity contours for hydrofoil equipped with VGs for different hydrofoil attack angles ( )
and 22% more than case one. The time of simulation was in the range of 1 to 1.5 hours.
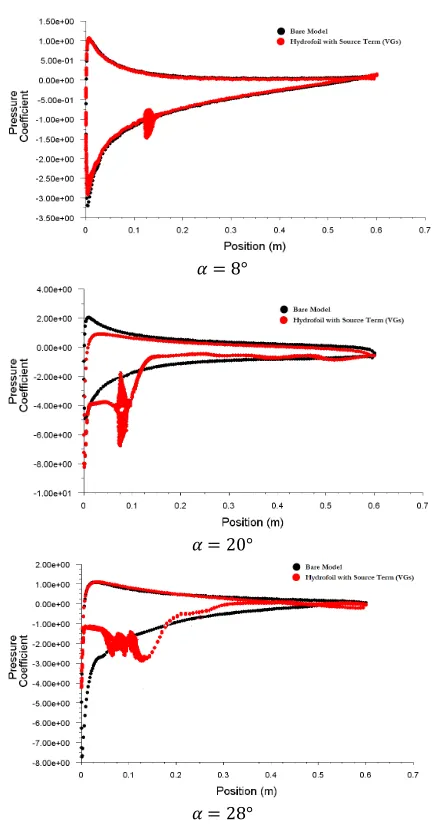
Figure 15 clearly shows the difference between pressure coefficient distributions along the chord of the bare hydrofoil and the hydrofoil with ST model for different angles of attack. Indeed, very good agreement is observed in the pressure side distributions. At the lower angle of attack, the effect of VGs is lower than the higher . The fluctuation part in the hydrofoil with VGs model is the place of installing VGs on the surface of hydrofoil. For higher angle of attacks, the main discrepancy appearing is restricted to the first 20%C on the suction side, where the transition of the boundary layer from laminar to turbulent occurs. With bringing the flow into the boundary layer, separation point is being put off to another point and CP is being changed
by this effect around the VGs area. The increase in the suction-pressure levels results in significant lift enhancement at the higher .
TABLE 4. Lift and drag coefficients for different attack angles of hydrofoil with ST
Experimental [16] CFD/hydrofoil +ST
°
0 0 0.01 0.00134 0.01217
4 0.3 0.018 0.28336 0.01953
8 0.61 0.037 0.5847 0.03946
12 0.91 0.059 0.8538 0.06572
16 1.2 0.098 1.312 0.08105
20 1.43 0.14 1.253 0.1746
24 1.12 0.32 1.6454 0.2794
26 - - 1.563 0.4353
28 - - 1.6355 0.6574
(a)
(b)
Figure 14. (a) Lift ( ) and (b) Drag ( )coefficients for different attack angles of hydrofoil with ST
= 8°
= 20°
= 28°
6. CONCLUSION
In this research, a FVM code was developed to investigate the effect of VGs on a hydrofoil. In the first case, a bare hydrofoil of NACA 0012 was modeled. So, its relevant coefficients of lift and drag were compared with experimental data. The results showed the accuracy of FVM method for simulation of such a fluid structure interaction. In the second case, the hydrofoil equipped with passive VGs was simulated. The results revealed that VGs have positive effect on flow around the hydrofoil by putting off the separation and stall point. In the third case, the effect of VGs on hydrofoil was simulated using source term technic. The results showed that this technic not only has enough accuracy for modeling the VGs effect but also can optimize calculation grids leading to dramatic decrease of run time of the model.
Furthermore, the results demonstrated that using VGs on the surface of hydrofoil can delay the stall and separation point by improving the lift and drag coefficients at higher hydrofoil attack angles.
For further investigations, it is wise to investigate VGs effect on different rudders. Besides, the zig-zag and turning tests of rudder with VGs may lead to important insights in relation tothe floating vessel maneuverability.
7. REFERENCES
1. Lin, J.C., "Review of research on low-profile vortex generators to control boundary-layer separation", Progress in Aerospace Sciences, Vol. 38, No. 4, (2002), 389-420.
2. McManus, L.P., "A preliminary study of three-dimensional turbulent flow over vortex generators with a plenoptic camera", (2014).
3. Islam, M.R., Hossain, M.A., Mashud, M. and Gias, M.T.I., "Drag reduction of a car by using vortex generator", (2010)
4. Reck, M., Hansen, M.O.L., Sørensen, J.N. and Michelsen, J., "Computational fluid dynamics, with detached eddy simulation and the immersed boundary technique, applied to oscillating airfoils and vortex generators", Technical University of DenmarkDanmarks Tekniske Universitet, Department of Energy EngineeringInstitut for Energiteknik, (2004),
5. Paul, A.R., Ranjan, P., Patel, V.K. and Jain, A., "Comparative studies on flow control in rectangular s-duct diffuser using submerged-vortex generators", Aerospace Science and Technology, Vol. 28, No. 1, (2013), 332-343.
6. Godard, G. and Stanislas, M., "Control of a aecelerating boundary layer . Part 3: Optimization of round jets vortex generators", Aerosp. Sci. Technol, Vol. 10, (2006), 455-464. 7. Quackenbush, T.R., Danilov, P.V. and Whitehouse, G.R., "Flow
driven oscillating vortex generators for control of boundary layer separation", in 40th Fluid Dynamics Conference and Exhibit. (2010), 1-15.
8. Quackenbush, T.R., McKillip Jr, R.M. and Whitehouse, G.R., "Development and testing of deployable vortex generators using sma actuation", in Proceedings of the 28th AIAA Applied Aeroacoustics Conference. (2010), 1-16.
9. Jahanmiri, M. and Abbaspour, M., "Experimental investigation of drag reduction on ahmed car model using a combination of active flow control methods", International Journal of Engineering, Vol. 24, No. 4, (2011), 403-410.
10. Jafari, M., Toloei, A., Ghasemlu, S. and Parhizkar, H., "Simulation of store separation using low-cost cfd with dynamic meshing", International Journal of Engineering-Transactions B: Applications, Vol. 27, No. 5, (2013), 775-781.
11. Karim, M.M., Rahman, M. and Alim, M.A., "Performance of sst k-ω turbulence model for computation of viscous drag of axisymmetric underwater bodies", International Journal of Engineering, Vol.26, No.4, (2011), 345-352.
12. Von Stillfried, F., "Computational studies of passive vortex generators for flow control, Skolan för teknikvetenskap, Kungliga Tekniska högskolan, (2009).
13. Durst, F., "Fluid mechanics: An introduction to the theory of fluid flows, Springer, (2008).
14. Versteg, H. and Malalasekera, W., "An introduction to computational fluid dynamics", Finite Volume Method, Essex, Longman Scientific & Technical, (1995).
15. Waithe, K.A., "Source term model for vortex generator vanes in a navier-stockes computer code", The 42nd AIAA Aerospace Sciences Meeting and Exhibit, (2004), 1-11.
Numerical Study on Improvement of Hydrofoil Performance Using
Vortex Generators
RESEARCH NOTE
Marine Engineering Department, AmirKabir University of Technology, Tehran, Iran
P A P E R I N F O
Paper history: Received 08 August 2014
Received in revised form 09 November 2014 Accepted 13 November 2014
Keywords:
Hydrofoil Drag Reduction Vortex Generators Finite Volume Method Source Term
ﺪﯿﮑﭼ
ﺪﯿﻟﻮﺗﮏﯾﺐﺼﻧتاﺮﺛاﻪﻟﺎﻘﻣﻦﯾارد
ﻪﺑادﺮﮔهﺪﻨﻨﮐ
يدﺪﻋشورﻪﺑﻞﯾﻮﻓورﺪﯿﻫيورﻞﮑﺷﯽﺜﻠﺜﻣلﺎﻌﻓﺮﯿﻏ
راﺮﻗﯽﺳرﺮﺑدرﻮﻣ
ﺖﺳاﻪﺘﻓﺮﮔ
.
ﺪﯿﻟﻮﺗنوﺪﺑﻞﯾﻮﻓورﺪﯿﻫلوامﺪﻗرد
ﮏﻤﮐﻪﺑيدﺪﻋيزﺎﺴﻟﺪﻣﺞﯾﺎﺘﻧولﺪﻣدوﺪﺤﻣﻢﺠﺣشورﻪﺑﻪﺑادﺮﮔهﺪﻨﻨﮐ
ﻣزآﺞﯾﺎﺘﻧ
ﺪﯾدﺮﮔﺮﺒﺘﻌﻣﯽﻫﺎﮕﺸﯾﺎ
.
ﺪﯿﻟﻮﺗمودمﺪﻗرد
هﺪﺷلﺪﻣﻪﺑادﺮﮔهﺪﻨﻨﮐ
راﺮﻗﻪﻌﻟﺎﻄﻣدرﻮﻣ ﻞﯾﻮﻓورﺪﯿﻫيورنآﺮﺛاو
ﺖﻓﺮﮔ
.
ﻪﻤﺸﭼمﺮﺗشورزاهدﺎﻔﺘﺳاﺎﺑﺪﻌﺑمﺪﻗرد
ﺪﯿﻟﻮﺗﺮﺛامﻮﺘﻨﻤﻣﻪﻟدﺎﻌﻣﻪﺑنآندﺮﮐﻪﻓﺎﺿاو
ﺎﻣا،ﺪﺷرﻮﻈﻨﻣﻪﺑادﺮﮔهﺪﻨﻨﮐ
ﻞﯾﻮﻓورﺪﯿﻫيورزاﻪﺳﺪﻨﻫ
ﺪﺷفﺬﺣﻞﻣﺎﮐرﻮﻄﺑ
.
ﯽﻣنﺎﺸﻧﺞﯾﺎﺘﻧ
ﻦﯾاﺎﺑ ﻪﮐﺪﻫد
ياﺮﺑﯽﺗﺎﺒﺳﺎﺤﻣنﺎﻣزومزﻻﻪﻈﻓﺎﺣرﺎﮐ
ﯽﻣﺶﻫﺎﮐﯽﻬﺟﻮﺗﻞﺑﺎﻗهزاﺪﻧاﻪﺑهﺪﺷﻪﺘﻓﺮﮔﺮﻈﻧردﻪﮐﯽﻟﺪﻣ
ﺪﺑﺎﯾ
.
ﯽﻣنﺎﺸﻧﺞﯾﺎﺘﻧﻦﯿﻨﭽﻤﻫ
ﺪﯿﻟﻮﺗزاهدﺎﻔﺘﺳاﻪﮐﺪﻫد
هﺪﻨﻨﮐ
ﺚﻋﺎﺑﻞﯾﻮﻓورﺪﯿﻫيورﺮﺑﻪﺑادﺮﮔ
ﻒﻗﻮﺗﺖﻟﺎﺣﺮﯿﺧﺎﺗ
)
لﺎﺘﺳا
(
ﯽﻣﻪﯾوازﻦﯾاﺶﯾاﺰﻓاﻊﻗاوردو
ددﺮﮔ
.
ﺚﻋﺎﺑدﻮﺧﻪﺑﻮﻧﻪﺑﻦﯾا
ﯽﻣ ﺎﺴﭘ ﺐﯾﺮﺿ ﺶﻫﺎﮐ وﻞﯾﻮﻓورﺪﯿﻫ ﺪﯾﺪﺟ ﻪﻠﻤﺣ ﻪﯾواز رداﺮﺑ ﺐﯾﺮﺿ ﺶﯾاﺰﻓا
ددﺮﮔ
.
يور يدرﻮﻣ ﻪﻌﻟﺎﻄﻣ ﮏﯾ رد
ﻊﻄﻘﻣﺎﺑﯽﻠﯾﻮﻓورﺪﯿﻫ
NACA 0012
ﺮﺑاﺮﺑﻞﯾﻮﻓورﺪﯿﻫلﺎﺘﺳاﻪﯾوازياﺮﺑﺶﯾاﺰﻓاﻦﯾا
4
اﺮﺑﺐﯾﺮﺿياﺮﺑوﻪﺟرد
37 %
ﺖﺳاهﺪﻣآﺖﺳﺪﺑ
.
![Figure 3. Types of passive VGs [12]](https://thumb-us.123doks.com/thumbv2/123dok_us/229069.2017475/3.595.67.279.237.539/figure-types-of-passive-vgs.webp)

![TABLE 2. Lift and drag coefficients for different attack angles of bare hydrofoil for model and experiment [16]](https://thumb-us.123doks.com/thumbv2/123dok_us/229069.2017475/5.595.325.524.100.418/table-lift-coefficients-different-attack-angles-hydrofoil-experiment.webp)
![Figure 11. Comparison between model results (hydrofoil with VGs) and experimental data (bare hydrofoil) in different attach angles a) Lift ( ) and b) Drag ( )coefficients [16]](https://thumb-us.123doks.com/thumbv2/123dok_us/229069.2017475/6.595.309.518.100.584/figure-comparison-results-hydrofoil-experimental-hydrofoil-different-coefficients.webp)