NSW Public
Health
Bulletin
CONTENTS
Volume 14, Number 9–10
September–October 2003
ISSN 1034 7674
State Health Publication PH 030249
YEAR IN REVIEW: COMMUNICABLE
DISEASE SURVEILLANCE, 2002
I
n this issue, we review the trends in reports of notifiable diseases
among NSW residents received by the NSW public health units
for 2002. Readers interested in the details of notifications for
specific diseases are referred to Tables 1–5 where diseases are
reported by: year of onset; month of onset; rate per 100,000
population and number of cases by area health service; and
age group and sex. Table 6 shows the number of people with
notifiable conditions who were reported to have died by the
time of follow-up by their local public health unit.
TRENDS
Among the 35,142 NSW residents with medical conditions
notified by doctors, hospital staff, and laboratories for 2002:
Conditions most frequently reported
•
hepatitis C (6705 cases [101.9/100,000 population], with
the highest crude rates in Central Sydney, South Western
Sydney, and Northern Rivers Area Health Services);
•
chlamydia (5649 [85.9/100,000], with the highest crude rates
in Central Sydney, South Eastern Sydney, and Far West Area
Health Services);
•
gastroenteritis in institutions (4057 [61.7/100,000], with the
highest crude rates in Central Sydney, Southern and Far West
Area Health Services);*
•
hepatitis B (3550 cases [53.9/100,000], with the highest
crude rates in Central Sydney, South Western Sydney, and
Western Sydney Area Health Services);
•
salmonella infections (2102 cases [32.0/100,000], with the
highest crude rates in the Northern Rivers, Greater Murray,
and New England Area Health Services);
•
pertussis (2009 cases [30.5/100,000], with the highest crude
rates in the Macquarie, Hunter, and Mid North Coast Area
Health Services).
* Note: Surveillance recording practices for ‘gastroenteritis in an institution’
changed in 2002, leading to the significant rise in numbers of cases from 2001.
189
Year in Review:
Communicable Disease
Surveillance, 2002
200
Priorities for Communicable
Disease Control in
New South Wales, 2003
206
FactSheet : Viral
Gastroenteritis
207
Communicable Diseases,
NSW, for July 2003
207
Trends
207
Measles in Wentworth
208
A case of meningococcal
disease and chickenpox
Conditions with meaningful declines over previous
years
•
hepatitis C (6705 cases in total, down from 8692 in
2001);
•
pertussis (2009 cases, indicating the easing of the
statewide outbreak in 2000–01);
•
measles (eight cases, down from 31 in 2001, and a
record low).
Conditions with meaningful increases over previous
years
•
chlamydia infections (5649 cases, up from 4494 in
2001);
•
institutional gastroenteritis (4057 cases, up from 775
in 2001, largely reflecting the changes in foodborne
illness surveillance implemented during 2002);
•
salmonellosis (2102 cases, up from 1643 in 2001. The
most commonly reported serovars in 2002 were
S.typhimurium subtypes 9 and 135);
•
new HIV diagnoses (389 cases, up from 341 in 2001,
the first annual increase in case reports in recent years);
•
Q fever (305 cases, up from 142 in 2001, perhaps in
part due to increased screening related to the Q Fever
vaccination program);
•
cryptosporidiosis (305 cases, up from 195 in 2001);
•
adverse events after immunisation (174 cases, up from
111 in 2001, perhaps reflecting the broader
surveillance definition adopted in recent years and
improved reporting of adverse events after
immunisation).
Conditions least frequently reported
In 2002, there were no reported cases of botulism,
chancroid, diphtheria, leprosy, lymphogranuloma
venereum (LGV), donovanosis, plague, polio, rabies,
congenital rubella, tetanus, typhus, viral haemorrhagic
fevers, or yellow fever.
Conditions associated with the largest numbers of
reported deaths
Deaths for notifiable conditions reported via the
surveillance mechanisms may not include all deaths
associated with these conditions. Public health units
routinely investigate all cases of some notifiable
conditions (for example: tuberculosis, measles, and
meningoccocal disease) in order to put control measures
in place. However, there are other notifiable conditions
(for example: chlamydia and gonorrhoea) where no
routine investigation takes place but information is
collected for surveillance purposes. Where death occurs
either after the investigation of a case, or where there has
been no routine investigation, these deaths may not be
recorded in the surveillance systems. Deaths were most
frequently reported for the following notifiable diseases:
•
invasive pneumococcal disease (99);
•
tuberculosis (37);
•
AIDS (25);
•
meningococcal disease (19);
•
gastroenteritis in an institution (15);
•
hepatitis C (10).
Outbreaks and threats
In 2002, several notable disease outbreaks and threats
were reported in NSW. These include:
•
a large outbreak of psittacosis, linked to wild birds in
the Blue Mountains in Autumn;
•
the re-emergence of syphilis in inner Sydney,
especially among men who have sex with men;
•
an outbreak of Barmah Forest virus infection on the
northern coast of NSW, which saw it replace Ross River
Virus infection as the dominant mosquito-borne
disease in autumn;
•
an outbreak of Salmonella Typhimurium phage type 9
infections, some cases being linked to fried ice-cream
contaminated with raw-chicken juice in February;
•
an outbreak of five measles cases, linked to cases
acquired overseas or interstate, between March and
August;
•
increasing reports of community-acquired Methicillin
Resistant Staphylococcus Aureus (MRSA), notably in
the Greater Murray and the Far West Area Health
Services;
•
a cluster of two passengers on a cruise ship who were
diagnosed with meningococcal disease in January;
•
general public concern about meningococcal disease.
TRAINING AND INFORMATION
In 2002, the NSW Department of Health facilitated training
for public health professionals in communicable disease
control and developed new information resources,
including:
•
monthly Bug Breakfast seminars, journal clubs, and
epidemiological grand rounds seminars;
•
a two-day workshop on communicable disease
surveillance;
•
supervision of an officer on the NSW Public Health
Officer Training Program;
•
teaching students of public health and medicine at
the Universities of Sydney and New South Wales;
•
a variety of new fact sheets, available online at
www.health.nsw.gov.au/pubs/index.html.
PROGRESS ON PRIORITY AREAS
In 2000, communicable diseases priority areas were
identified for development in NSW.
1Here we report on
Eliminate the transmission of measles
Eight measles cases were reported among NSW residents
in 2002. Of these six were confirmed by laboratory testing.
Eliminate congenital rubella
There were no cases in 2002.
Eliminate congenital syphilis
There was one case in 2002.
Monitor risk factors for new hepatitis C infections
An evaluation of enhanced Hepatitis C (HCV)
surveillance (involving follow up of all cases reported by
pathology laboratories as having markers of HCV
infection) in 2002 found that enhanced surveillance
provided little new useful epidemiological information
about cases. Consequently, enhanced statewide
surveillance ceased in late 2002.
Better understand risk factors for invasive
pneumococcal disease
Enhanced surveillance for invasive pneumococcal disease
(IPD) was undertaken for children aged less than five years
and adults aged 50 years and over. Vaccination is
recommended for children with certain underlying
illnesses, and all adults aged 65 years and over. Underlying
illness was present in 14 per cent of children and 64 per
cent of adults aged 50 years and older diagnosed with
IPD. Vaccination may have prevented up to 85 per cent of
cases of disease.
Minimise the incidence and management of multi-drug
resistant tuberculosis
Four cases of multi-drug resistant tuberculosis (MDR-TB)
were identified in 2002; all were most likely acquired
overseas. An expert panel reviewed the management of
each case.
INITIATIVES FOR 2003
To strengthen communicable disease control activities in
2003, the following initiatives were planned:
•
a review of priorities for the control of communicable
diseases;
•
a review of systems and processes for statewide
surveillance;
•
strengthening surveillance for meningococcal disease
and tuberculosis;
•
convening a training workshop for disease control for
public health professionals.
SO WHAT DOES IT ALL MEAN?
In 2002, bloodborne viruses (notably hepatitis C, hepatitis
B, and HIV), sexually transmissible infections (notably
chlamydia and gonorrhoea), and enteric diseases (notably
norovirus and salmonella), were the most commonly
notified diseases in NSW. Prevention of these diseases
must therefore remain a priority.
The record low levels of measles is a testament to the
current high rates of immunisation among children.
However, because pertussis vaccine is less effective in
providing long term immunity than the measles vaccine,
it may be that the relatively low levels of pertussis
represents an inter-epidemic lull and a rise can be
anticipated in 2003–04.
Although the number of cases of meningococcal disease
was no higher than in the previous year, in 2002 there was
an increase in deaths from meningococcal disease (to 19,
up from seven in 2001) and a substantial increase in public
concern and media coverage about the disease.
Subsequently, the Commonwealth Department of Health
and Ageing funded, and NSW Health is implementing, a
meningococcal C vaccine program for pre-school and
school children.
The more commonly reported cause of death resulting
from a notifiable disease, however, was from pneumococcal
disease, and more complete vaccination coverage in young
children and older adults should lead to a reduction in
the number of both cases and deaths.
The outbreak of psittacosis in the Blue Mountains
highlights the need to remain vigilant for—and maintain
public health capacity to investigate and control—
outbreaks of novel or previously unknown diseases,
especially in light of the subsequent global outbreak of
severe acute respiratory syndrome in 2003, and concerns
about the potential for bioterrorism.
THANK YOU
It is important to recognise that disease control and
prevention depends on effective surveillance of
communicable diseases in the community. NSW Health
would like to thank all those general and specialist
medical practices, laboratories, hospitals, schools,
childcare centres, and others, who have notified diseases
of public health significance to their local public health
units for investigation and control. We also recognise the
cooperation that the patients with these diseases, and their
families and contacts, have demonstrated in helping
reduce the transmission of these infections.
REFERENCE
1. Public Health Division. Infectious Disease, NSW: May 2000.
TABLE 1
DISEASE NO TIFICATIONS BY YEAR OF ONSET OF ILLNESS, NSW, 1991 T O 2002
Conditions 1991 1992 1993 1994 1995 1996 1997 1998 1999 2000 2001 2002
AIDS 443 432 480 552 472 368 201 173 112 122 77 73 Adverse event after immunisation 9 31 23 40 28 56 70 94 13 42 111 174 Total Arboviral infection* 409 341 656 381 534 1225 1803 780 1218 975 1184 657 Arboviral: Barmah Forest virus infections* 6 6 25 39 271 172 185 134 249 195 399 393 Arboviral: Ross River virus infections* 297 324 599 332 236 1031 1597 583 953 749 716 182 Arboviral: other* 106 11 32 10 27 22 21 63 16 31 69 82 Blood lead level ≥ 15µg/dl* not notifiable until December 1996 710 874 691 990 515 524
Botulism 0 0 0 0 0 0 0 0 1 0 0 0
Brucellosis* 2 2 4 4 2 1 3 3 2 1 1 2
Chancroid not notifiable until December 1998 1 0 0 0 Chlamydia trachomatis infections* not notifiable until August 1998 2467 3496 4494 5649
Cholera* 1 0 1 0 1 3 1 1 2 0 1 1
Cryptosporidiosis* not notifiable until December 1996 157 1130 121 133 195 305 Food-borne illness (NOS) 2765 253 106 213 270 211 255 201 151 147 56 751 Gastroenteritis (institutional)* 158 406 443 296 1359 554 939 738 673 697 775 4057 Giardiasis* not notifiable until August 1998 1091 978 967 862 Gonorrhoea* 392 491 382 357 428 522 636 1054 1291 1059 1357 1470 Total H.influenzae type b infection* 212 217 124 61 29 13 17 11 13 8 7 10
H.influenzae type b epiglottitis* 15 57 32 21 6 2 5 1 2 2 1 1
H.influenzae type b meningitis* 48 103 53 17 11 4 3 3 3 1 1 1
H.influenzae type b septicaemia* 11 26 24 12 8 3 1 4 6 4 2 3
H.influenzae type b infection (NOS)* 138 31 15 11 4 4 8 3 2 1 3 5
HIV infection* 824 700 593 501 540 453 425 407 378 357 341 389 Haemolytic uraemic syndrome not notifiable until December 1996 3 6 11 9 2 7 Hepatitis A* 1119 903 579 586 614 958 1426 927 421 201 197 149 Hepatitis B: acute viral* 408 113 95 74 61 43 53 58 77 99 94 87 Hepatitis B: other* 1095 3059 3507 3910 3946 3469 3118 2895 3450 3900 4503 3463 Hepatitis C: acute viral* 22 26 22 16 32 18 19 111 113 224 298 152 Hepatitis C: other* 834 3869 5879 7809 6860 6986 6908 7109 8508 8079 8394 6553 Hepatitis D* 0 8 12 19 19 9 11 3 14 11 11 10
Hepatitis E* 0 0 1 2 0 3 6 4 7 9 6 6
Influenza* not notifiable until December 2000 243 1011 Total Legionnaires’ disease 37 104 66 60 75 74 33 46 41 41 68 45 Legionnaires’ disease: L. longbeachae* 0 14 13 8 16 30 9 19 12 12 29 22 Legionnaires’ disease: L. pneumophila * 16 80 34 30 35 34 18 22 22 26 38 22 Legionnaires’ disease: other 21 10 19 22 24 10 6 5 7 3 1 1
Leprosy 1 7 5 3 3 2 0 0 1 2 3 0
Leptospirosis* 28 21 16 14 6 33 33 50 56 54 66 39 Listeriosis* 11 13 12 10 14 22 23 28 22 18 12 11 Malaria* 171 110 174 184 96 203 173 157 173 228 153 130 Total Measles 496 805 2348 1484 596 191 273 119 32 36 31 8 Measles: laboratory confirmed cases* 20 76 460 302 138 35 98 19 13 22 18 6 Measles: other 476 729 1888 1182 458 156 175 100 19 14 13 2 Total Meningococcal disease 128 122 153 142 113 161 219 184 218 249 233 214 Meningococcal disease: type B* 0 3 7 7 23 36 54 55 95 93 92 104 Meningococcal disease: type C* 0 4 6 9 8 35 55 55 60 64 38 53 Meningococcal disease: type W135* 0 0 0 0 1 0 2 4 4 4 2 1 Meningococcal disease: type Y* 0 0 1 1 0 1 0 7 1 7 2 2 Meningococcal disease: other 128 115 139 125 81 89 108 63 58 81 99 54 Mumps* 8 23 13 11 14 27 29 39 33 92 28 29 Paratyphoid* 20 8 9 11 12 15 5 9 5 14 11 13 Pertussis 49 217 1533 1405 1369 1156 4249 2309 1414 3683 4436 2009 Pneumococcal disease (invasive)* not notifiable until December 2000 739 870 Psittacosis* not notifiable until December 2000 38 144 Q Fever* 167 213 404 267 201 287 258 236 164 130 142 305 Total Rubella* 60 324 1186 233 2376 636 153 78 46 191 58 35 Rubella* 59 324 1184 229 2375 631 153 78 45 191 58 35 Rubella (Congenital)* 1 0 2 4 1 5 0 0 1 0 0 0 Salmonella infections* 1171 802 980 1101 1365 1224 1698 1813 1438 1395 1643 2102 Shigellosis* not notifiable until December 2000 134 85 Total Syphilis 582 875 733 968 834 663 512 612 585 581 544 649 Syphilis: <1 year duration* 1 3 6 29 133 72 57 45 89 81 66 127 Syphilis: congenital 1 1 0 2 6 3 3 0 3 2 1 1 Syphilis: other* 580 871 727 937 695 588 452 567 493 498 477 521
Tetanus 5 2 5 4 0 1 3 3 1 2 0 0
Tuberculosis* 430 394 389 393 443 410 422 382 484 447 415 446 Typhoid* 38 20 28 25 27 30 28 18 32 26 33 23 Verotoxin-producing Escherichia coli infections* not notifiable until December 1996 0 2 0 1 1 5
No cases of the following diseases have been notified since 1991:
diphtheria*, Granuloma inguinale*, Lymphogranuloma venereum*, plague*, poliomyelitis*, rabies, typhus*, viral haemorrhagic fever, yellow fever.
TABLE 2
DISEASE NOTIFICATIONS BY MONTH OF ONSET OF ILLNESS, NSW, 2002
Month of Onset
Conditions JAN FEB MAR APR MAY JUN JUL AUG SEP OCT NOV DEC
AIDS 3 8 8 7 4 7 6 8 4 5 6 7
Adverse event after immunisation 7 16 17 18 20 14 13 14 13 26 13 3 Total Arboviral infection* 49 49 75 151 111 64 29 24 26 21 30 28 Arboviral: Barmah Forest virus infections* 21 21 54 98 69 37 18 16 15 12 19 13 Arboviral: Ross River virus infections* 20 20 12 42 36 18 6 3 6 6 4 9 Arboviral: other* 8 8 9 11 6 9 5 5 5 3 7 6 Blood lead level ≥ 15µg/dl* 29 26 34 25 52 41 46 65 25 42 40 99 Chlamydia trachomatis infections* 427 437 445 445 506 439 486 510 497 479 532 446
Cholera* 0 0 0 0 0 0 0 1 0 0 0 0
Cryptosporidiosis* 41 53 57 44 27 15 7 8 7 9 13 24 Food-borne illness(NOS) 28 320 11 125 2 11 34 2 7 37 79 95 Gastroenteritis (institutional) 55 210 58 26 164 375 945 1459 291 203 114 157 Giardiasis* 78 83 99 91 86 66 62 47 70 55 62 63 Gonorrhoea* 140 125 110 128 136 127 117 108 116 109 143 111 Total H.influenzae type b infection* 1 2 1 0 2 3 0 0 0 1 0 0
H.influenzae type b epiglottitis* 1 0 0 0 0 0 0 0 0 0 0 0
H.influenzae type b meningitis* 0 1 0 0 0 0 0 0 0 0 0 0
H.influenzae type b septicaemia* 0 0 1 0 1 0 0 0 0 1 0 0
H.influenzae type b infection (NOS)* 0 1 0 0 1 3 0 0 0 0 0 0
HIV infection* 36 30 39 33 27 23 34 30 32 37 42 26 Haemolytic uraemic syndrome 2 0 0 1 1 1 0 1 0 0 1 0 Hepatitis A* 18 19 15 12 20 5 6 13 6 18 8 9 Hepatitis B: acute viral* 8 7 8 5 8 8 10 11 8 3 6 5 Hepatitis B: other* 349 250 311 280 352 256 271 314 257 302 276 245 Hepatitis C: acute viral* 19 20 15 6 14 19 8 13 12 9 12 5 Hepatitis C: other* 691 593 558 540 636 457 527 530 521 535 528 437
Hepatitis D* 1 1 3 1 1 1 0 1 1 0 0 0
Hepatitis E* 0 0 0 1 1 1 1 2 0 0 0 0
Influenza* 5 11 7 16 39 156 271 319 110 45 14 18 Total Legionnaires’ disease 6 5 6 5 6 3 6 1 0 4 2 1 Legionnaires’ disease: L. longbeachae* 2 2 1 2 5 2 4 1 0 1 2 0 Legionnaires’ disease: L. pneumophila * 4 3 5 3 1 1 2 0 0 2 0 1 Legionnaires’ disease: other 0 0 0 0 0 0 0 0 0 1 0 0
Leprosy 0 0 0 0 0 0 0 0 0 0 0 0
Leptospirosis* 8 0 4 5 4 0 2 3 0 5 5 3
Listeriosis* 2 0 0 1 1 0 1 0 1 1 2 2
Malaria* 20 22 19 7 6 13 7 7 9 8 5 7
Total Measles 0 0 1 1 1 0 2 3 0 0 0 0
Measles: laboratory confirmed cases* 0 0 1 1 0 0 1 3 0 0 0 0 Measles: other 0 0 0 0 1 0 1 0 0 0 0 0 Total Meningococcal disease 10 10 10 12 24 25 25 28 24 16 15 15 Meningococcal disease: type B* 5 4 3 8 13 10 10 17 9 12 6 7 Meningococcal disease: type C* 2 2 2 2 8 7 5 5 8 3 4 5 Meningococcal disease: type W135* 0 0 0 0 0 0 0 0 0 0 1 0 Meningococcal disease: type Y* 0 0 0 0 0 0 1 0 1 0 0 0 Meningococcal disease: other 3 4 5 2 3 8 9 6 6 1 4 3
Mumps* 3 1 1 2 4 3 1 3 4 2 3 2
Paratyphoid* 2 1 2 0 0 0 2 0 1 3 1 1
Pertussis 261 189 170 143 184 122 130 126 151 175 186 172 Pneumococcal disease (invasive)* 37 33 45 42 68 117 112 102 108 83 62 61 Psittacosis* 0 1 4 2 6 47 27 31 17 3 3 3 Q Fever* 18 21 15 23 18 22 30 26 27 46 30 29
Rubella* 5 0 2 2 1 1 6 3 3 7 3 2
Salmonella infections* 227 271 239 271 155 83 85 108 80 181 186 216 Shigellosis* 5 9 8 6 6 6 12 10 3 6 11 3 Total Syphilis 46 48 42 52 61 49 60 51 56 52 73 59 Syphilis: <1 year duration* 6 7 8 7 7 7 10 8 13 19 17 18 Syphilis: congenital 0 0 0 0 0 0 0 0 0 0 1 0 Syphilis: other* 40 41 34 45 54 42 50 43 43 33 55 41 Tuberculosis* 52 40 38 42 36 37 37 30 35 36 38 25
Typhoid* 5 5 1 0 2 0 2 0 1 3 3 1
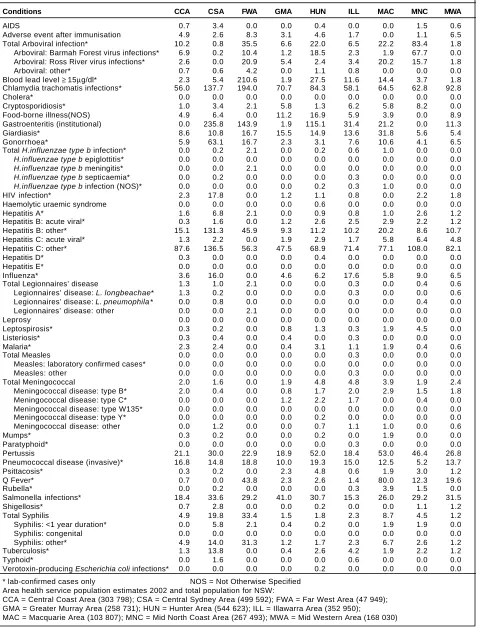
TABLE 3
DISEASE NO TIFICATIONS BY AREA HEALTH SERVICE OF RESIDENCE, CR UDE RATES PER 100,000 OF POPULATION, NSW, 2002
Conditions CCA CSA FWA GMA HUN ILL MAC MNC MWA
AIDS 0.7 3.4 0.0 0.0 0.4 0.0 0.0 1.5 0.6 Adverse event after immunisation 4.9 2.6 8.3 3.1 4.6 1.7 0.0 1.1 6.5 Total Arboviral infection* 10.2 0.8 35.5 6.6 22.0 6.5 22.2 83.4 1.8 Arboviral: Barmah Forest virus infections* 6.9 0.2 10.4 1.2 18.5 2.3 1.9 67.7 0.0 Arboviral: Ross River virus infections* 2.6 0.0 20.9 5.4 2.4 3.4 20.2 15.7 1.8 Arboviral: other* 0.7 0.6 4.2 0.0 1.1 0.8 0.0 0.0 0.0 Blood lead level ≥ 15µg/dl* 2.3 5.4 210.6 1.9 27.5 11.6 14.4 3.7 1.8 Chlamydia trachomatis infections* 56.0 137.7 194.0 70.7 84.3 58.1 64.5 62.8 92.8 Cholera* 0.0 0.0 0.0 0.0 0.0 0.0 0.0 0.0 0.0 Cryptosporidiosis* 1.0 3.4 2.1 5.8 1.3 6.2 5.8 8.2 0.0 Food-borne illness(NOS) 4.9 6.4 0.0 11.2 16.9 5.9 3.9 0.0 8.9 Gastroenteritis (institutional) 0.0 235.8 143.9 1.9 115.1 31.4 21.2 0.0 11.3 Giardiasis* 8.6 10.8 16.7 15.5 14.9 13.6 31.8 5.6 5.4 Gonorrhoea* 5.9 63.1 16.7 2.3 3.1 7.6 10.6 4.1 6.5 Total H.influenzae type b infection* 0.0 0.2 2.1 0.0 0.2 0.6 1.0 0.0 0.0
H.influenzae type b epiglottitis* 0.0 0.0 0.0 0.0 0.0 0.0 0.0 0.0 0.0
H.influenzae type b meningitis* 0.0 0.0 2.1 0.0 0.0 0.0 0.0 0.0 0.0
H.influenzae type b septicaemia* 0.0 0.2 0.0 0.0 0.0 0.3 0.0 0.0 0.0
H.influenzae type b infection (NOS)* 0.0 0.0 0.0 0.0 0.2 0.3 1.0 0.0 0.0
HIV infection* 2.3 17.8 0.0 1.2 1.1 0.8 0.0 2.2 1.8 Haemolytic uraemic syndrome 0.0 0.0 0.0 0.0 0.6 0.0 0.0 0.0 0.0 Hepatitis A* 1.6 6.8 2.1 0.0 0.9 0.8 1.0 2.6 1.2 Hepatitis B: acute viral* 0.3 1.6 0.0 1.2 2.6 2.5 2.9 2.2 1.2 Hepatitis B: other* 15.1 131.3 45.9 9.3 11.2 10.2 20.2 8.6 10.7 Hepatitis C: acute viral* 1.3 2.2 0.0 1.9 2.9 1.7 5.8 6.4 4.8 Hepatitis C: other* 87.6 136.5 56.3 47.5 68.9 71.4 77.1 108.0 82.1 Hepatitis D* 0.3 0.0 0.0 0.0 0.4 0.0 0.0 0.0 0.0 Hepatitis E* 0.0 0.0 0.0 0.0 0.0 0.0 0.0 0.0 0.0 Influenza* 3.6 16.0 0.0 4.6 6.2 17.6 5.8 9.0 6.5 Total Legionnaires’ disease 1.3 1.0 2.1 0.0 0.0 0.3 0.0 0.4 0.6 Legionnaires’ disease: L. longbeachae* 1.3 0.2 0.0 0.0 0.0 0.3 0.0 0.0 0.6 Legionnaires’ disease: L. pneumophila * 0.0 0.8 0.0 0.0 0.0 0.0 0.0 0.4 0.0 Legionnaires’ disease: other 0.0 0.0 2.1 0.0 0.0 0.0 0.0 0.0 0.0 Leprosy 0.0 0.0 0.0 0.0 0.0 0.0 0.0 0.0 0.0 Leptospirosis* 0.3 0.2 0.0 0.8 1.3 0.3 1.9 4.5 0.0 Listeriosis* 0.3 0.4 0.0 0.4 0.0 0.3 0.0 0.0 0.0 Malaria* 2.3 2.4 0.0 0.4 3.1 1.1 1.9 0.4 0.6 Total Measles 0.0 0.0 0.0 0.0 0.0 0.3 0.0 0.0 0.0 Measles: laboratory confirmed cases* 0.0 0.0 0.0 0.0 0.0 0.0 0.0 0.0 0.0 Measles: other 0.0 0.0 0.0 0.0 0.0 0.3 0.0 0.0 0.0 Total Meningococcal 2.0 1.6 0.0 1.9 4.8 4.8 3.9 1.9 2.4 Meningococcal disease: type B* 2.0 0.4 0.0 0.8 1.7 2.0 2.9 1.5 1.8 Meningococcal disease: type C* 0.0 0.0 0.0 1.2 2.2 1.7 0.0 0.4 0.0 Meningococcal disease: type W135* 0.0 0.0 0.0 0.0 0.0 0.0 0.0 0.0 0.0 Meningococcal disease: type Y* 0.0 0.0 0.0 0.0 0.2 0.0 0.0 0.0 0.0 Meningococcal disease: other 0.0 1.2 0.0 0.0 0.7 1.1 1.0 0.0 0.6 Mumps* 0.3 0.2 0.0 0.0 0.2 0.0 1.9 0.0 0.0 Paratyphoid* 0.0 0.0 0.0 0.0 0.0 0.3 0.0 0.0 0.0 Pertussis 21.1 30.0 22.9 18.9 52.0 18.4 53.0 46.4 26.8 Pneumococcal disease (invasive)* 16.8 14.8 18.8 10.0 19.3 15.0 12.5 5.2 13.7 Psittacosis* 0.3 0.2 0.0 2.3 4.8 0.6 1.9 3.0 1.2 Q Fever* 0.7 0.0 43.8 2.3 2.6 1.4 80.0 12.3 19.6 Rubella* 0.0 0.2 0.0 0.0 0.0 0.3 3.9 1.5 0.0 Salmonella infections* 18.4 33.6 29.2 41.0 30.7 15.3 26.0 29.2 31.5 Shigellosis* 0.7 2.8 0.0 0.0 0.2 0.0 0.0 1.1 1.2 Total Syphilis 4.9 19.8 33.4 1.5 1.8 2.3 8.7 4.5 1.2 Syphilis: <1 year duration* 0.0 5.8 2.1 0.4 0.2 0.0 1.9 1.9 0.0 Syphilis: congenital 0.0 0.0 0.0 0.0 0.0 0.0 0.0 0.0 0.0 Syphilis: other* 4.9 14.0 31.3 1.2 1.7 2.3 6.7 2.6 1.2 Tuberculosis* 1.3 13.8 0.0 0.4 2.6 4.2 1.9 2.2 1.2 Typhoid* 0.0 1.6 0.0 0.0 0.0 0.6 0.0 0.0 0.0 Verotoxin-producing Escherichia coli infections* 0.0 0.0 0.0 0.0 0.2 0.0 0.0 0.0 0.0 * lab-confirmed cases only NOS = Not Otherwise Specified
Area health service population estimates 2002 and total population for NSW:
CCA = Central Coast Area (303 798); CSA = Central Sydney Area (499 592); FWA = Far West Area (47 949); GMA = Greater Murray Area (258 731); HUN = Hunter Area (544 623); ILL = Illawarra Area (352 950);
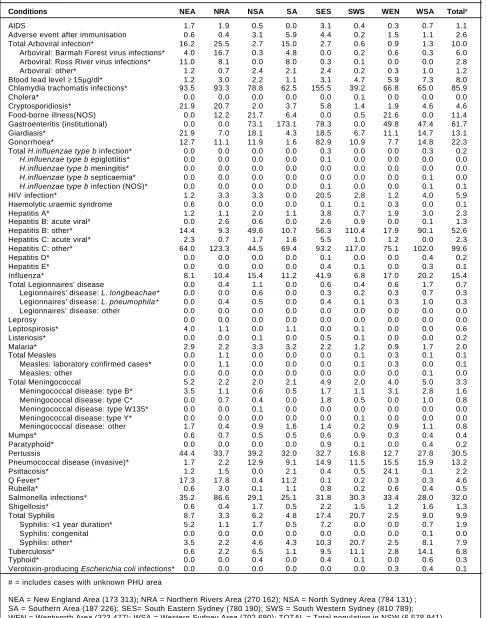
TABLE 3 continued
DISEASE NO TIFICATIONS BY AREA HEALTH SERVICE OF RESIDENCE, CR UDE RATES PER 100,000 OF POPULATION, NSW, 2002
Conditions NEA NRA NSA SA SES SWS WEN WSA Total#
AIDS 1.7 1.9 0.5 0.0 3.1 0.4 0.3 0.7 1.1 Adverse event after immunisation 0.6 0.4 3.1 5.9 4.4 0.2 1.5 1.1 2.6 Total Arboviral infection* 16.2 25.5 2.7 15.0 2.7 0.6 0.9 1.3 10.0 Arboviral: Barmah Forest virus infections* 4.0 16.7 0.3 4.8 0.0 0.2 0.6 0.3 6.0 Arboviral: Ross River virus infections* 11.0 8.1 0.0 8.0 0.3 0.1 0.0 0.0 2.8 Arboviral: other* 1.2 0.7 2.4 2.1 2.4 0.2 0.3 1.0 1.2 Blood lead level ≥ 15µg/dl* 1.2 3.0 2.2 1.1 3.1 4.7 5.9 7.3 8.0 Chlamydia trachomatis infections* 93.5 93.3 78.8 62.5 155.5 39.2 66.8 65.0 85.9 Cholera* 0.0 0.0 0.0 0.0 0.0 0.1 0.0 0.0 0.0 Cryptosporidiosis* 21.9 20.7 2.0 3.7 5.8 1.4 1.9 4.6 4.6 Food-borne illness(NOS) 0.0 12.2 21.7 6.4 0.0 0.5 21.6 0.0 11.4 Gastroenteritis (institutional) 0.0 0.0 73.1 173.1 78.3 0.0 49.8 47.4 61.7 Giardiasis* 21.9 7.0 18.1 4.3 18.5 6.7 11.1 14.7 13.1 Gonorrhoea* 12.7 11.1 11.9 1.6 82.9 10.9 7.7 14.8 22.3 Total H.influenzae type b infection* 0.0 0.0 0.0 0.0 0.3 0.0 0.0 0.3 0.2
H.influenzae type b epiglottitis* 0.0 0.0 0.0 0.0 0.1 0.0 0.0 0.0 0.0
H.influenzae type b meningitis* 0.0 0.0 0.0 0.0 0.0 0.0 0.0 0.0 0.0
H.influenzae type b septicaemia* 0.0 0.0 0.0 0.0 0.0 0.0 0.0 0.1 0.0
H.influenzae type b infection (NOS)* 0.0 0.0 0.0 0.0 0.1 0.0 0.0 0.1 0.1
HIV infection* 1.2 3.3 3.3 0.0 20.5 2.8 1.2 4.0 5.9 Haemolytic uraemic syndrome 0.6 0.0 0.0 0.0 0.1 0.1 0.3 0.0 0.1 Hepatitis A* 1.2 1.1 2.0 1.1 3.8 0.7 1.9 3.0 2.3 Hepatitis B: acute viral* 0.0 2.6 0.6 0.0 2.6 0.9 0.0 0.1 1.3 Hepatitis B: other* 14.4 9.3 49.6 10.7 56.3 110.4 17.9 90.1 52.6 Hepatitis C: acute viral* 2.3 0.7 1.7 1.6 5.5 1.0 1.2 0.0 2.3 Hepatitis C: other* 64.0 123.3 44.5 69.4 93.2 117.0 75.1 102.0 99.6 Hepatitis D* 0.0 0.0 0.0 0.0 0.1 0.0 0.0 0.4 0.2 Hepatitis E* 0.0 0.0 0.0 0.0 0.4 0.1 0.0 0.3 0.1 Influenza* 8.1 10.4 15.4 11.2 41.9 6.8 17.0 20.2 15.4 Total Legionnaires’ disease 0.0 0.4 1.1 0.0 0.6 0.4 0.6 1.7 0.7 Legionnaires’ disease: L. longbeachae* 0.0 0.0 0.6 0.0 0.3 0.2 0.3 0.7 0.3 Legionnaires’ disease: L. pneumophila * 0.0 0.4 0.5 0.0 0.4 0.1 0.3 1.0 0.3 Legionnaires’ disease: other 0.0 0.0 0.0 0.0 0.0 0.0 0.0 0.0 0.0 Leprosy 0.0 0.0 0.0 0.0 0.0 0.0 0.0 0.0 0.0 Leptospirosis* 4.0 1.1 0.0 1.1 0.0 0.1 0.0 0.0 0.6 Listeriosis* 0.0 0.0 0.1 0.0 0.5 0.1 0.0 0.0 0.2 Malaria* 2.9 2.2 3.3 3.2 2.2 1.2 0.9 1.7 2.0 Total Measles 0.0 1.1 0.0 0.0 0.0 0.1 0.3 0.1 0.1 Measles: laboratory confirmed cases* 0.0 1.1 0.0 0.0 0.0 0.1 0.3 0.0 0.1 Measles: other 0.0 0.0 0.0 0.0 0.0 0.0 0.0 0.1 0.0 Total Meningococcal 5.2 2.2 2.0 2.1 4.9 2.0 4.0 5.0 3.3 Meningococcal disease: type B* 3.5 1.1 0.6 0.5 1.7 1.1 3.1 2.8 1.6 Meningococcal disease: type C* 0.0 0.7 0.4 0.0 1.8 0.5 0.0 1.0 0.8 Meningococcal disease: type W135* 0.0 0.0 0.1 0.0 0.0 0.0 0.0 0.0 0.0 Meningococcal disease: type Y* 0.0 0.0 0.0 0.0 0.0 0.1 0.0 0.0 0.0 Meningococcal disease: other 1.7 0.4 0.9 1.6 1.4 0.2 0.9 1.1 0.8 Mumps* 0.6 0.7 0.5 0.5 0.6 0.9 0.3 0.4 0.4 Paratyphoid* 0.0 0.0 0.0 0.0 0.9 0.1 0.0 0.4 0.2 Pertussis 44.4 33.7 39.2 32.0 32.7 16.8 12.7 27.8 30.5 Pneumococcal disease (invasive)* 1.7 2.2 12.9 9.1 14.9 11.5 15.5 15.9 13.2 Psittacosis* 1.2 1.5 0.0 2.1 0.4 0.5 24.1 0.1 2.2 Q Fever* 17.3 17.8 0.4 11.2 0.1 0.2 0.3 0.3 4.6 Rubella* 0.6 3.0 0.1 1.1 0.8 0.2 0.6 0.4 0.5 Salmonella infections* 35.2 86.6 29.1 25.1 31.8 30.3 33.4 28.0 32.0 Shigellosis* 0.6 0.4 1.7 0.5 2.2 1.5 1.2 1.6 1.3 Total Syphilis 8.7 3.3 6.2 4.8 17.4 20.7 2.5 9.0 9.9 Syphilis: <1 year duration* 5.2 1.1 1.7 0.5 7.2 0.0 0.0 0.7 1.9 Syphilis: congenital 0.0 0.0 0.0 0.0 0.0 0.0 0.0 0.1 0.0 Syphilis: other* 3.5 2.2 4.6 4.3 10.3 20.7 2.5 8.1 7.9 Tuberculosis* 0.6 2.2 6.5 1.1 9.5 11.1 2.8 14.1 6.8 Typhoid* 0.0 0.0 0.4 0.0 0.4 0.1 0.0 0.6 0.3 Verotoxin-producing Escherichia coli infections* 0.0 0.0 0.0 0.0 0.0 0.0 0.3 0.4 0.1
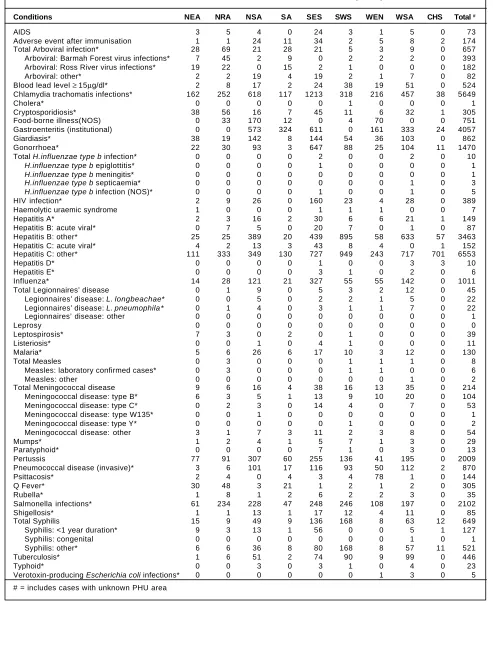
# = includes cases with unknown PHU area
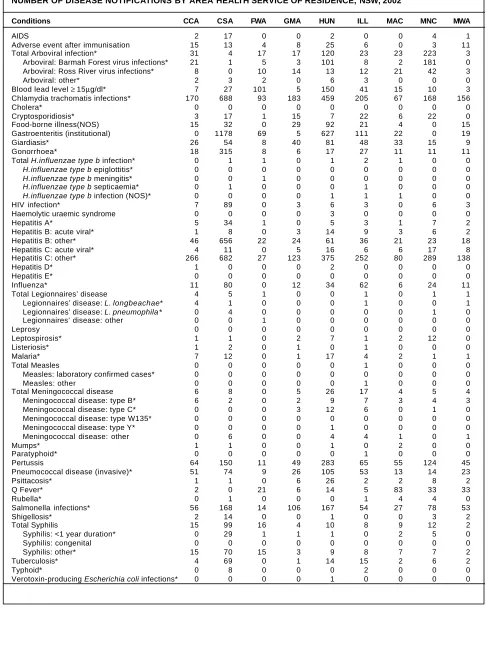
TABLE 4
NUMBER OF DISEASE NOTIFICATIONS BY AREA HEALTH SERVICE OF RESIDENCE, NSW, 2002
Conditions CCA CSA FWA GMA HUN ILL MAC MNC MWA
AIDS 2 17 0 0 2 0 0 4 1
Adverse event after immunisation 15 13 4 8 25 6 0 3 11 Total Arboviral infection* 31 4 17 17 120 23 23 223 3 Arboviral: Barmah Forest virus infections* 21 1 5 3 101 8 2 181 0 Arboviral: Ross River virus infections* 8 0 10 14 13 12 21 42 3
Arboviral: other* 2 3 2 0 6 3 0 0 0
Blood lead level ≥ 15µg/dl* 7 27 101 5 150 41 15 10 3 Chlamydia trachomatis infections* 170 688 93 183 459 205 67 168 156
Cholera* 0 0 0 0 0 0 0 0 0
Cryptosporidiosis* 3 17 1 15 7 22 6 22 0 Food-borne illness(NOS) 15 32 0 29 92 21 4 0 15 Gastroenteritis (institutional) 0 1178 69 5 627 111 22 0 19
Giardiasis* 26 54 8 40 81 48 33 15 9
Gonorrhoea* 18 315 8 6 17 27 11 11 11
Total H.influenzae type b infection* 0 1 1 0 1 2 1 0 0
H.influenzae type b epiglottitis* 0 0 0 0 0 0 0 0 0
H.influenzae type b meningitis* 0 0 1 0 0 0 0 0 0
H.influenzae type b septicaemia* 0 1 0 0 0 1 0 0 0
H.influenzae type b infection (NOS)* 0 0 0 0 1 1 1 0 0
HIV infection* 7 89 0 3 6 3 0 6 3
Haemolytic uraemic syndrome 0 0 0 0 3 0 0 0 0
Hepatitis A* 5 34 1 0 5 3 1 7 2
Hepatitis B: acute viral* 1 8 0 3 14 9 3 6 2 Hepatitis B: other* 46 656 22 24 61 36 21 23 18 Hepatitis C: acute viral* 4 11 0 5 16 6 6 17 8 Hepatitis C: other* 266 682 27 123 375 252 80 289 138
Hepatitis D* 1 0 0 0 2 0 0 0 0
Hepatitis E* 0 0 0 0 0 0 0 0 0
Influenza* 11 80 0 12 34 62 6 24 11
Total Legionnaires’ disease 4 5 1 0 0 1 0 1 1 Legionnaires’ disease: L. longbeachae* 4 1 0 0 0 1 0 0 1 Legionnaires’ disease: L. pneumophila * 0 4 0 0 0 0 0 1 0 Legionnaires’ disease: other 0 0 1 0 0 0 0 0 0
Leprosy 0 0 0 0 0 0 0 0 0
Leptospirosis* 1 1 0 2 7 1 2 12 0
Listeriosis* 1 2 0 1 0 1 0 0 0
Malaria* 7 12 0 1 17 4 2 1 1
Total Measles 0 0 0 0 0 1 0 0 0
Measles: laboratory confirmed cases* 0 0 0 0 0 0 0 0 0
Measles: other 0 0 0 0 0 1 0 0 0
Total Meningococcal disease 6 8 0 5 26 17 4 5 4 Meningococcal disease: type B* 6 2 0 2 9 7 3 4 3 Meningococcal disease: type C* 0 0 0 3 12 6 0 1 0 Meningococcal disease: type W135* 0 0 0 0 0 0 0 0 0 Meningococcal disease: type Y* 0 0 0 0 1 0 0 0 0 Meningococcal disease: other 0 6 0 0 4 4 1 0 1
Mumps* 1 1 0 0 1 0 2 0 0
Paratyphoid* 0 0 0 0 0 1 0 0 0
Pertussis 64 150 11 49 283 65 55 124 45 Pneumococcal disease (invasive)* 51 74 9 26 105 53 13 14 23
Psittacosis* 1 1 0 6 26 2 2 8 2
Q Fever* 2 0 21 6 14 5 83 33 33
Rubella* 0 1 0 0 0 1 4 4 0
Salmonella infections* 56 168 14 106 167 54 27 78 53
Shigellosis* 2 14 0 0 1 0 0 3 2
Total Syphilis 15 99 16 4 10 8 9 12 2
Syphilis: <1 year duration* 0 29 1 1 1 0 2 5 0 Syphilis: congenital 0 0 0 0 0 0 0 0 0
Syphilis: other* 15 70 15 3 9 8 7 7 2
Tuberculosis* 4 69 0 1 14 15 2 6 2
Typhoid* 0 8 0 0 0 2 0 0 0
TABLE 4 continued
NUMBER OF DISEASE NOTIFICATIONS BY AREA HEALTH SERVICE OF RESIDENCE, NSW, 2002
Conditions NEA NRA NSA SA SES SWS WEN WSA CHS Total #
AIDS 3 5 4 0 24 3 1 5 0 73
Adverse event after immunisation 1 1 24 11 34 2 5 8 2 174 Total Arboviral infection* 28 69 21 28 21 5 3 9 0 657 Arboviral: Barmah Forest virus infections* 7 45 2 9 0 2 2 2 0 393 Arboviral: Ross River virus infections* 19 22 0 15 2 1 0 0 0 182 Arboviral: other* 2 2 19 4 19 2 1 7 0 82 Blood lead level ≥ 15µg/dl* 2 8 17 2 24 38 19 51 0 524 Chlamydia trachomatis infections* 162 252 618 117 1213 318 216 457 38 5649
Cholera* 0 0 0 0 0 1 0 0 0 1
Cryptosporidiosis* 38 56 16 7 45 11 6 32 1 305 Food-borne illness(NOS) 0 33 170 12 0 4 70 0 0 751 Gastroenteritis (institutional) 0 0 573 324 611 0 161 333 24 4057 Giardiasis* 38 19 142 8 144 54 36 103 0 862 Gonorrhoea* 22 30 93 3 647 88 25 104 11 1470 Total H.influenzae type b infection* 0 0 0 0 2 0 0 2 0 10
H.influenzae type b epiglottitis* 0 0 0 0 1 0 0 0 0 1
H.influenzae type b meningitis* 0 0 0 0 0 0 0 0 0 1
H.influenzae type b septicaemia* 0 0 0 0 0 0 0 1 0 3
H.influenzae type b infection (NOS)* 0 0 0 0 1 0 0 1 0 5
HIV infection* 2 9 26 0 160 23 4 28 0 389 Haemolytic uraemic syndrome 1 0 0 0 1 1 1 0 0 7
Hepatitis A* 2 3 16 2 30 6 6 21 1 149
Hepatitis B: acute viral* 0 7 5 0 20 7 0 1 0 87 Hepatitis B: other* 25 25 389 20 439 895 58 633 57 3463 Hepatitis C: acute viral* 4 2 13 3 43 8 4 0 1 152 Hepatitis C: other* 111 333 349 130 727 949 243 717 701 6553
Hepatitis D* 0 0 0 0 1 0 0 3 3 10
Hepatitis E* 0 0 0 0 3 1 0 2 0 6
Influenza* 14 28 121 21 327 55 55 142 0 1011 Total Legionnaires’ disease 0 1 9 0 5 3 2 12 0 45 Legionnaires’ disease: L. longbeachae* 0 0 5 0 2 2 1 5 0 22 Legionnaires’ disease: L. pneumophila * 0 1 4 0 3 1 1 7 0 22 Legionnaires’ disease: other 0 0 0 0 0 0 0 0 0 1
Leprosy 0 0 0 0 0 0 0 0 0 0
Leptospirosis* 7 3 0 2 0 1 0 0 0 39
Listeriosis* 0 0 1 0 4 1 0 0 0 11
Malaria* 5 6 26 6 17 10 3 12 0 130
Total Measles 0 3 0 0 0 1 1 1 0 8
Measles: laboratory confirmed cases* 0 3 0 0 0 1 1 0 0 6
Measles: other 0 0 0 0 0 0 0 1 0 2
Total Meningococcal disease 9 6 16 4 38 16 13 35 0 214 Meningococcal disease: type B* 6 3 5 1 13 9 10 20 0 104 Meningococcal disease: type C* 0 2 3 0 14 4 0 7 0 53 Meningococcal disease: type W135* 0 0 1 0 0 0 0 0 0 1 Meningococcal disease: type Y* 0 0 0 0 0 1 0 0 0 2 Meningococcal disease: other 3 1 7 3 11 2 3 8 0 54
Mumps* 1 2 4 1 5 7 1 3 0 29
Paratyphoid* 0 0 0 0 7 1 0 3 0 13
Pertussis 77 91 307 60 255 136 41 195 0 2009 Pneumococcal disease (invasive)* 3 6 101 17 116 93 50 112 2 870
Psittacosis* 2 4 0 4 3 4 78 1 0 144
Q Fever* 30 48 3 21 1 2 1 2 0 305
Rubella* 1 8 1 2 6 2 2 3 0 35
Salmonella infections* 61 234 228 47 248 246 108 197 0 2102
Shigellosis* 1 1 13 1 17 12 4 11 0 85
Total Syphilis 15 9 49 9 136 168 8 63 12 649 Syphilis: <1 year duration* 9 3 13 1 56 0 0 5 1 127 Syphilis: congenital 0 0 0 0 0 0 0 1 0 1 Syphilis: other* 6 6 36 8 80 168 8 57 11 521 Tuberculosis* 1 6 51 2 74 90 9 99 0 446
Typhoid* 0 0 3 0 3 1 0 4 0 23
TABLE 5
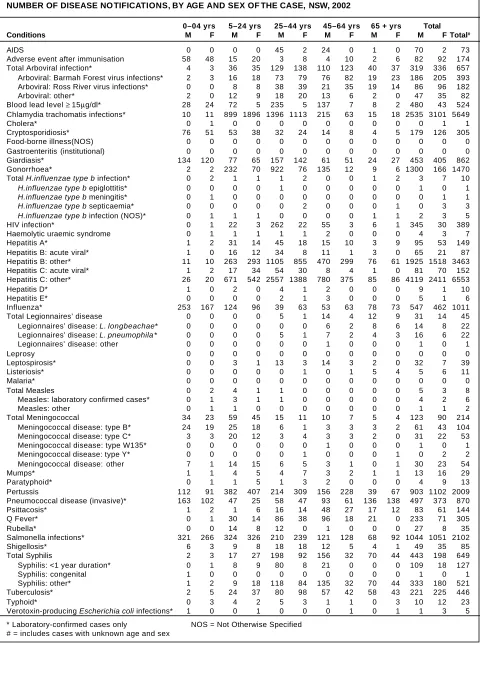
NUMBER OF DISEASE NO TIFICATIONS, BY AGE AND SEX OF THE CASE, NSW, 2002
0–04 yrs 5–24 yrs 25–44 yrs 45–64 yrs 65 + yrs Total Conditions M F M F M F M F M F M F Total#
AIDS 0 0 0 0 45 2 24 0 1 0 70 2 73
Adverse event after immunisation 58 48 15 20 3 8 4 10 2 6 82 92 174 Total Arboviral infection* 4 3 36 35 129 138 110 123 40 37 319 336 657 Arboviral: Barmah Forest virus infections* 2 3 16 18 73 79 76 82 19 23 186 205 393 Arboviral: Ross River virus infections* 0 0 8 8 38 39 21 35 19 14 86 96 182 Arboviral: other* 2 0 12 9 18 20 13 6 2 0 47 35 82 Blood lead level ≥ 15µg/dl* 28 24 72 5 235 5 137 7 8 2 480 43 524 Chlamydia trachomatis infections* 10 11 899 1896 1396 1113 215 63 15 18 2535 3101 5649
Cholera* 0 1 0 0 0 0 0 0 0 0 0 1 1
Cryptosporidiosis* 76 51 53 38 32 24 14 8 4 5 179 126 305 Food-borne illness(NOS) 0 0 0 0 0 0 0 0 0 0 0 0 0 Gastroenteritis (institutional) 0 0 0 0 0 0 0 0 0 0 0 0 0 Giardiasis* 134 120 77 65 157 142 61 51 24 27 453 405 862 Gonorrhoea* 2 2 232 70 922 76 135 12 9 6 1300 166 1470 Total H.influenzae type b infection* 0 2 1 1 1 2 0 0 1 2 3 7 10
H.influenzae type b epiglottitis* 0 0 0 0 1 0 0 0 0 0 1 0 1
H.influenzae type b meningitis* 0 1 0 0 0 0 0 0 0 0 0 1 1
H.influenzae type b septicaemia* 0 0 0 0 0 2 0 0 0 1 0 3 3
H.influenzae type b infection (NOS)* 0 1 1 1 0 0 0 0 1 1 2 3 5
HIV infection* 0 1 22 3 262 22 55 3 6 1 345 30 389 Haemolytic uraemic syndrome 0 1 1 1 1 1 2 0 0 0 4 3 7 Hepatitis A* 1 2 31 14 45 18 15 10 3 9 95 53 149 Hepatitis B: acute viral* 1 0 16 12 34 8 11 1 3 0 65 21 87 Hepatitis B: other* 11 10 263 293 1105 855 470 299 76 61 1925 1518 3463 Hepatitis C: acute viral* 1 2 17 34 54 30 8 4 1 0 81 70 152 Hepatitis C: other* 26 20 671 542 2557 1388 780 375 85 86 4119 2411 6553 Hepatitis D* 1 0 2 0 4 1 2 0 0 0 9 1 10
Hepatitis E* 0 0 0 0 2 1 3 0 0 0 5 1 6
Influenza* 253 167 124 96 39 63 53 63 78 73 547 462 1011 Total Legionnaires’ disease 0 0 0 0 5 1 14 4 12 9 31 14 45 Legionnaires’ disease: L. longbeachae* 0 0 0 0 0 0 6 2 8 6 14 8 22 Legionnaires’ disease: L. pneumophila * 0 0 0 0 5 1 7 2 4 3 16 6 22 Legionnaires’ disease: other 0 0 0 0 0 0 1 0 0 0 1 0 1
Leprosy 0 0 0 0 0 0 0 0 0 0 0 0 0
Leptospirosis* 0 0 3 1 13 3 14 3 2 0 32 7 39 Listeriosis* 0 0 0 0 0 1 0 1 5 4 5 6 11
Malaria* 0 0 0 0 0 0 0 0 0 0 0 0 0
Total Measles 0 2 4 1 1 0 0 0 0 0 5 3 8 Measles: laboratory confirmed cases* 0 1 3 1 1 0 0 0 0 0 4 2 6 Measles: other 0 1 1 0 0 0 0 0 0 0 1 1 2 Total Meningococcal 34 23 59 45 15 11 10 7 5 4 123 90 214 Meningococcal disease: type B* 24 19 25 18 6 1 3 3 3 2 61 43 104 Meningococcal disease: type C* 3 3 20 12 3 4 3 3 2 0 31 22 53 Meningococcal disease: type W135* 0 0 0 0 0 0 1 0 0 0 1 0 1 Meningococcal disease: type Y* 0 0 0 0 0 1 0 0 0 1 0 2 2 Meningococcal disease: other 7 1 14 15 6 5 3 1 0 1 30 23 54
Mumps* 1 1 4 5 4 7 3 2 1 1 13 16 29
Paratyphoid* 0 1 1 5 1 3 2 0 0 0 4 9 13 Pertussis 112 91 382 407 214 309 156 228 39 67 903 1102 2009 Pneumococcal disease (invasive)* 163 102 47 25 58 47 93 61 136 138 497 373 870 Psittacosis* 1 2 1 6 16 14 48 27 17 12 83 61 144 Q Fever* 0 1 30 14 86 38 96 18 21 0 233 71 305
Rubella* 0 0 14 8 12 0 1 0 0 0 27 8 35
Salmonella infections* 321 266 324 326 210 239 121 128 68 92 1044 1051 2102 Shigellosis* 6 3 9 8 18 18 12 5 4 1 49 35 85 Total Syphilis 2 3 17 27 198 92 156 32 70 44 443 198 649 Syphilis: <1 year duration* 0 1 8 9 80 8 21 0 0 0 109 18 127 Syphilis: congenital 1 0 0 0 0 0 0 0 0 0 1 0 1 Syphilis: other* 1 2 9 18 118 84 135 32 70 44 333 180 521 Tuberculosis* 2 5 24 37 80 98 57 42 58 43 221 225 446
Typhoid* 0 3 4 2 5 3 1 1 0 3 10 12 23
Verotoxin-producing Escherichia coli infections* 1 0 0 1 0 0 0 1 0 1 1 3 5 * Laboratory-confirmed cases only NOS = Not Otherwise Specified
TABLE 6
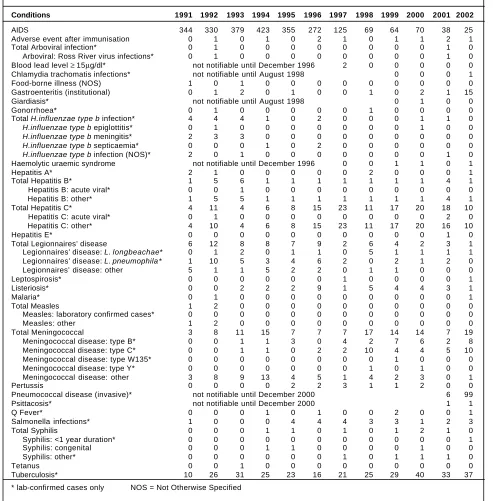
REPORTED DEATHS OF RESIDENTS BY YEAR OF ONSET OF ILLNESS, NSW, 1991 T O 2002
Conditions 1991 1992 1993 1994 1995 1996 1997 1998 1999 2000 2001 2002
AIDS 344 330 379 423 355 272 125 69 64 70 38 25 Adverse event after immunisation 0 1 0 1 0 2 1 0 1 1 2 1 Total Arboviral infection* 0 1 0 0 0 0 0 0 0 0 1 0 Arboviral: Ross River virus infections* 0 1 0 0 0 0 0 0 0 0 1 0 Blood lead level ≥ 15µg/dl* not notifiable until December 1996 2 0 0 0 0 0 Chlamydia trachomatis infections* not notifiable until August 1998 0 0 0 1 Food-borne illness (NOS) 1 0 1 0 0 0 0 0 0 0 0 0 Gastroenteritis (institutional) 0 1 2 0 1 0 0 1 0 2 1 15 Giardiasis* not notifiable until August 1998 0 1 0 0
Gonorrhoea* 0 1 0 0 0 0 0 1 0 0 0 0
Total H.influenzae type b infection* 4 4 4 1 0 2 0 0 0 1 1 0
H.influenzae type b epiglottitis* 0 1 0 0 0 0 0 0 0 1 0 0
H.influenzae type b meningitis* 2 3 3 0 0 0 0 0 0 0 0 0
H.influenzae type b septicaemia* 0 0 0 1 0 2 0 0 0 0 0 0
H.influenzae type b infection (NOS)* 2 0 1 0 0 0 0 0 0 0 1 0
Haemolytic uraemic syndrome not notifiable until December 1996 0 0 1 1 0 1
Hepatitis A* 2 1 0 0 0 0 0 2 0 0 0 1
Total Hepatitis B* 1 5 6 1 1 1 1 1 1 1 4 1 Hepatitis B: acute viral* 0 0 1 0 0 0 0 0 0 0 0 0 Hepatitis B: other* 1 5 5 1 1 1 1 1 1 1 4 1 Total Hepatitis C* 4 11 4 6 8 15 23 11 17 20 18 10 Hepatitis C: acute viral* 0 1 0 0 0 0 0 0 0 0 2 0 Hepatitis C: other* 4 10 4 6 8 15 23 11 17 20 16 10
Hepatitis E* 0 0 0 0 0 0 0 0 0 0 1 0
Total Legionnaires’ disease 6 12 8 8 7 9 2 6 4 2 3 1 Legionnaires’ disease: L. longbeachae* 0 1 2 0 1 1 0 5 1 1 1 1 Legionnaires’ disease: L. pneumophila * 1 10 5 3 4 6 2 0 2 1 2 0 Legionnaires’ disease: other 5 1 1 5 2 2 0 1 1 0 0 0
Leptospirosis* 0 0 0 0 0 0 1 0 0 0 0 1
Listeriosis* 0 0 2 2 2 9 1 5 4 4 3 1
Malaria* 0 1 0 0 0 0 0 0 0 0 0 1
Total Measles 1 2 0 0 0 0 0 0 0 0 0 0
Measles: laboratory confirmed cases* 0 0 0 0 0 0 0 0 0 0 0 0 Measles: other 1 2 0 0 0 0 0 0 0 0 0 0 Total Meningococcal 3 8 11 15 7 7 7 17 14 14 7 19 Meningococcal disease: type B* 0 0 1 1 3 0 4 2 7 6 2 8 Meningococcal disease: type C* 0 0 1 1 0 2 2 10 4 4 5 10 Meningococcal disease: type W135* 0 0 0 0 0 0 0 0 1 0 0 0 Meningococcal disease: type Y* 0 0 0 0 0 0 0 1 0 1 0 0 Meningococcal disease: other 3 8 9 13 4 5 1 4 2 3 0 1
Pertussis 0 0 0 0 2 2 3 1 1 2 0 0
Pneumococcal disease (invasive)* not notifiable until December 2000 6 99 Psittacosis* not notifiable until December 2000 1 1
Q Fever* 0 0 0 1 0 1 0 0 2 0 0 1
Salmonella infections* 1 0 0 0 4 4 4 3 3 1 2 3
Total Syphilis 0 0 0 1 1 0 1 0 1 2 1 0
Syphilis: <1 year duration* 0 0 0 0 0 0 0 0 0 0 0 1 Syphilis: congenital 0 0 0 1 1 0 0 0 0 1 0 0 Syphilis: other* 0 0 0 0 0 0 1 0 1 1 1 0
Tetanus 0 0 1 0 0 0 0 0 0 0 0 0