NSW Public Health Bulletin
Vol. 13 No. 8 177
NSW
Public
Health
Bulletin
CONTENTS
Volume 13, Number 8
August 2002
ISSN 1034 7674
State Health Publication PH 020142
continued on page 178
In this issue, we review the trends in reports of notifiable
diseases among NSW residents received by the NSW public
health units for 2001. Readers interested in the details of
notifications for specific diseases are referred to Tables 1–5
where diseases are reported by: year of onset; month of onset;
rate per 100,000 and number of cases by area health service;
and age group and sex. Table 6 shows the number of people
with notifiable conditions who were reported to have died by
the time of follow-up by their local public health unit.
TRENDS
Among the 31,456 NSW residents with medical conditions
notified by doctors, hospital staff, and laboratories for 2001:
Conditions most frequently reported
•
hepatitis C (8072 cases [124/100,000 population], with the
highest crude rates in Western Sydney, Central Sydney,
South Western Sydney, and Mid Western Health Area Health
Services);
•
hepatitis B (4548 cases [70/100,000], with the highest crude
rates in South Western Sydney, Central Sydney, and Western
Sydney Health Areas);
•
chlamydia (4451 [68/100,000], with the highest crude rates
in South Eastern Sydney, Far West, and Macquarie Health
Areas);
•
pertussis (4435 cases [68/100,000], with the highest crude
rates in the Macquarie, Northern Rivers, and Greater Murray
Health Areas).
Conditions with meaningful declines over previous years
•
AIDS (69 cases, down from a peak of 552 in 1994, mainly
due to better treatments for HIV infection, although the
decline in HIV infection has slowed [to 347 cases]);
•
measles, (30 cases, a sustained decline in cases since the
last large outbreak in the mid-1990s);
•
hepatitis A (195 cases, low for the second year running,
possibly due to natural or vaccine-induced immunity in
populations at risk of infection);
•
Q fever (139 cases, from a peak of 404 in 1993, possibly
due to vaccination among abattoir and agricultural workers).
YEAR IN REVIEW: COMMUNICABLE
DISEASE SURVEILLANCE, 2001
177
Year in Review:
Communicable Disease
Surveillance, 2001
188
Community and consumer
participation in health
189
Health economics on the
Internet
190
When it’s right in front of you :
Assisting health care
workers to manage the
effects of violence in rural
and remote Australia
190
World Report on Violence and
Health
191
FactSheet : Q fever
Conditions with meaningful increases over previous
years
•
Barmah Forest virus infections (398 cases, up from
195 in 2000, in part due to an outbreak on the Mid
North Coast);
•
pertussis (4435 cases, up from 1415 in 1999, due to a
statewide outbreak);
•
chlamydia (4451 cases, up from 2438 in 1999,
representing a continuing epidemic, mainly among
young adults);
•
gonorrhoea (1341 cases, up from 357 in 1994,
representing a continuing epidemic among men who
have sex with men);
•
cryptosporidiosis (192 cases, up from 121 in 1999, for
reasons that are unclear);
•
salmonellosis (1637 cases, up from 1386 in 2000. Of
note—compared with reports in 2000—there were an
increase in reports of Salmonella typhimurium phage
type [STMPT] 135a infections [51 reports] in the first
quarter of 2001, a cluster of STMPT135 infections
associated with a dinner in September [22 reports],
and an increase in STMPT 170 infections in the last
half of 2001 [35 reports]);
•
adverse events following immunisation (103 reports,
up from 42 in 2000, most likely due to an expansion
of the case definition, and to reports of local reactions
following administration of the fourth dose of DTPa
[diphtheria-tetanus-pertussis (acellular) vaccine]).
Conditions least frequently reported
There were no reported cases of botulism, brucellosis,
chancroid, diphtheria, lymphogranuloma venereum
(LGV), donovanosis, plague, polio, rabies, congenital
rubella, tetanus, typhus, viral haemorrhagic fevers, and
yellow fever.
Conditions associated with the largest numbers of
reported deaths
Deaths reported via the surveillance mechanisms for
notifiable conditions may not include all the deaths that
occur that are associated with these conditions in that
year. Public health units routinely investigate all cases of
some notifiable conditions (for example tuberculosis,
measles, meningoccocal disease) in order to put control
measures in place. However, there are other notifiable
conditions (for example chlamydia and gonorrhoea) where
no routine investigation takes place but information is
collected for surveillance purposes. Where death occurs
either after an investigation of a case, or where there has
been no routine investigation, these deaths may not be
reported in the surveillance systems. In addition, the
surveillance data may include deaths of people who were
diagnosed with a notifiable condition but whose
subsequent death was unrelated to this condition.
Deaths were most frequently reported for the following
notifiable diseases:
•
AIDS (36)
•
tuberculosis (33)
•
hepatitis C (18)
•
AIDS (8)
•
meningococcal disease (7)
•
invasive pneumococcal disease (6).
OUTBREAKS AND THREATS
Several notable disease outbreaks and threats were
reported in 2001 in NSW. These include:
•
a large outbreak of pertussis involving 4435 notified
cases (mainly older children and young adults, and
mainly in rural areas) that peaked at 605 cases in
August;
•
an outbreak of the mosquito-borne Barmah Forest virus
infection centred on the Mid North Coast Area in
autumn, following local flooding;
•
an outbreak of hand, foot and mouth disease and six
children with meningoencephalitis due to enterovirus 71
infections in Sydney in late 2000 and early 2001;
•
a cluster of seven cases of measles (three infants under
one year old and four young adults, none of whom
were known to be immunised) stemming from a
traveller who returned to Western Sydney from Hong
Kong;
•
two cases of bacteraemia due to Enterobacter
agglomerans and/or Stenotrophomonas maltophilia
in patients following administration of contaminated
total parenteral nutrition solution at one hospital;
•
over 500 people reporting exposures to suspicious
white powders from mid-October across NSW, none of
which tested positive for anthrax;
•
seroconversion in sentinel chickens indicating the
presence of Murray Valley virus and Kunjin virus in
mosquitos in parts of Western NSW in the first quarter
of the year (no human cases were identified);
•
a cluster of three cases of meningococcal disease due
to serogroup B at a university college in late March
and early April that led to the local public health unit
providing mass prophylaxis to approx-imately 200
college residents and staff.
TRAINING AND INFORMATION
In 2001, the NSW Department of Health facilitated training
for public health professionals in communicable disease
control and the developed new information resources,
including:
•
an Outbreak Investigation Workshop for public health
professionals;
•
monthly Bug Breakfast seminars;
•
supervision of an officer on the NSW Public Health
Officer Training Program;
•
teaching students of public health and medicine at
the Universities of Sydney and New South Wales;
NSW Public Health Bulletin
Vol. 13 No. 8 179
•
epidemiological reviews on sexually transmissible
infections, rubella, hepatitis C, Q fever, measles,
hepatitis A, and Legionnaires disease (www.health.
gov.au/public-health/phb/phb.html).
PROGRESS ON PRIORITY AREAS
In 2001, the communicable diseases priority areas were
identified for development in NSW.
1Here we report on
progress on the areas across the state:
Eliminate the transmission of measles
Thirty measles cases were reported among NSW residents in
2001. Of these 16 were confirmed by laboratory testing. Five
of the 30 cases were most likely infected overseas. An
additional case of measles was reported in an overseas visitor,
who was most likely infected before arrival in Australia.
Eliminate congenital rubella
No cases in 2001.
Eliminate congenital syphilis
Three cases in 2001.
Monitor risk factors for new hepatitis C infections
Two-hundred-and-fifty-one acute cases were reported in
2001. For 240 of these cases, information describing
identified risk exposures was available; 118 (49 per cent)
reported injecting drug use, and 105 ( 44 per cent) reported
no identified risk.
Better understand risk factors for invasive
pneumococcal disease (IPD)
Four-hundred-and-thirty-four cases of IPD were notified
in 2001. An analysis of risk factors will be published in a
future edition of the NSW Public Health Bulletin
Minimise the incidence and management of
multi-drug resistant tuberculosis (MDR-TB)
Six cases were identified in 2001; all were most likely
acquired overseas. The management of each case was
reviewed by an expert panel.
INITIATIVES FOR 2002
To strengthen communicable disease control activities in
2002, the following initiatives were planned:
•
a review of communicable disease control priorities;
•
a strengthening of food-borne disease surveillance;
•
a strengthening of invasive pneumococcal disease
surveillance;
•
a strengthening of meningococcal disease
surveillance;
•
convene a disease surveillance training workshop for
public health professionals;
•
convene a tuberculosis control training conference for
clinicians and public health professionals.
SO WHAT DOES IT ALL MEAN?
Some communicable diseases remain a threat to public
health:
•
the incidence of the blood-borne viruses hepatitis B,
hepatitis C, and HIV, remain high, and prevention
programs including community education and needle
and syringe programs are vital in the control of these
epidemics;
•
sexually transmissible infections—such as chlamydia
and gonorrhoea—are at epidemic proportions in some
populations; and safe sex, early case detection and
treatment, and contact tracing, are key prevention and
control measures;
•
mosquito-borne diseases like Barmah Forest virus
infection, Ross River virus infection, and Murray
Valley encephalitis (MVE), remain a problem for
people living in or visiting rural areas, and personal
protection (clothing, insect repellent, and screening
of houses) remains the mainstay of prevention;
•
pertussis continues to cause large epidemics every 3
or 4 years, and better technologies are required for its
prevention;
•
food-borne illness, such as salmonellosis, continue to
cause substantial illness in the community, and
surveillance and training in safe food handling is
important;
•
new communicable disease challenges have emerged
in recent years, including multi-drug resistant
tuberculosis, the re-emergence of MVE, and health
care associated infections that require careful
monitoring and review to determine effective
prevention strategies.
On the other hand, great leaps forward have been made in the
control of communicable diseases in NSW over the years:
•
immunisation has lead to the near eradication of polio,
diphtheria, tetanus, congenital rubella, and of local
epidemics of measles, mumps and rubella;
•
safe municipal water supplies have rendered outbreaks
of water-borne disease uncommon;
•
the staff of the public health units in NSW now form a
network of professionals who organise disease
surveillance, investigate notified cases, and institute
control measures to prevent the further spread of many
diseases, including measles, meningococcal disease,
hepatitis A, and pertussis, as well as managing the
control of disease outbreaks.
A BIG THANK YOU
It is important to recognise that disease control and
prevention depends on effective surveillance of
communicable diseases in the community. NSW Health
would like to thank all those general and specialist
medical practices, laboratories, hospitals, schools,
childcare centres, and others, who have notified diseases
of public health significance to their local public health
units for investigation and control.
REFERENCES
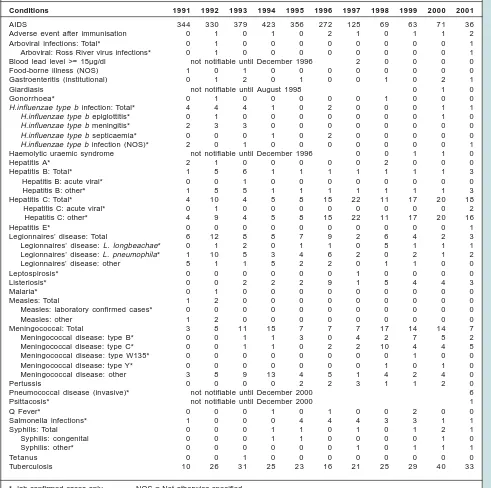
TABLE 1
DISEASE NOTIFICATIONS BY YEAR OF ONSET OF ILLNESS, NSW, 1991 TO 2001
Conditions 1991 1992 1993 1994 1995 1996 1997 1998 1999 2000 2001
AIDS 443 432 480 552 473 368 200 173 108 119 69
Adverse event after immunisation 9 31 23 40 28 56 70 94 13 42 103
Arboviral infection: Total* 409 341 656 382 534 1225 1804 780 1218 974 1181
Arboviral: Barmah Forest virus infections* 6 6 25 40 271 172 186 134 249 195 398
Arboviral: Ross River virus infections* 297 324 599 332 236 1031 1597 583 953 749 717
Arboviral: other* 106 11 32 10 27 22 21 63 16 30 66
Blood lead level >=15µg/dl* not notifiable until December 1996 712 874 709 988 470
Botulism 0 0 0 0 0 0 0 0 1 0 0
Brucellosis* 2 2 4 4 2 1 3 3 2 1 0
Chancroid* not notifiable until December 1998 1 0 0
Chlamydia trachomatis infections* not notifiable until August 1998 2438 3465 4451
Cholera* 1 0 1 0 1 3 1 1 2 0 1
Cryptosporidiosis* not notifiable until December 1996 157 1130 121 133 192
Food-borne illness (NOS) 2765 253 106 213 270 211 255 201 151 129 49
Gastroenteritis (institutional) 158 502 443 296 1359 554 939 738 673 697 776
Giardiasis* not notifiable until August 1998 1091 976 965
Gonorrhoea* 392 491 382 357 428 522 636 1051 1279 1047 1341
H.influenzae type b infection: Total 212 217 124 61 29 13 17 11 13 8 9
H.influenzae type b epiglottitis 15 57 32 21 6 2 5 1 2 2 1
H.influenzae type b meningitis 48 103 53 17 11 4 3 3 3 1 2
H.influenzae type b septicaemia 11 26 24 12 8 3 1 4 6 4 2
H.influenzae type b infection (NOS) 138 31 15 11 4 4 8 3 2 1 4
HIV infection* 812 705 599 506 543 459 432 413 387 360 347
Haemolytic uraemic syndrome not notifiable until December 1996 3 6 11 9 2
Hepatitis A* 1120 904 579 586 614 958 1426 926 406 194 195
Hepatitis B: acute viral* 409 113 96 75 63 43 52 53 64 96 88
Hepatitis B: other* 1097 3092 3551 3958 3982 3504 3155 2907 3405 3853 4460
Hepatitis C: acute viral* 22 26 22 17 32 18 19 111 102 216 251
Hepatitis C: other* 821 3913 5928 7883 6913 7034 6953 7155 7622 7349 7821
Hepatitis D* 0 8 12 19 19 9 11 3 13 10 12
Hepatitis E* 0 0 1 2 0 3 6 4 7 9 6
Influenza* not notifiable until December 2000 244
Legionnaires’ disease: Total 37 104 66 60 75 74 33 46 41 41 67
Legionnaires’ disease: L. longbeachae* 0 14 13 8 16 30 9 19 12 12 28
Legionnaires’ disease: L. pneumophila* 16 80 34 30 35 34 18 22 22 26 38
Legionnaires’ disease: other 21 10 19 22 24 10 6 5 7 3 1
Leprosy 1 7 5 3 3 2 0 0 1 2 3
Leptospirosis* 28 21 16 14 6 33 33 50 55 53 65
Listeriosis* 11 13 12 10 14 22 23 28 22 18 12
Malaria* 171 110 174 184 96 203 173 157 173 228 153
Measles: Total 496 805 2348 1484 596 191 273 119 32 32 30
Measles: laboratory confirmed cases* 20 76 460 302 138 35 98 19 13 20 16
Measles: other 476 729 1888 1182 458 156 175 100 19 12 14
Meningococcal: Total 128 122 153 142 113 161 219 184 215 249 232
Meningococcal disease: type B* 0 3 7 7 23 35 54 55 94 91 85
Meningococcal disease: type C* 0 4 6 9 8 35 54 55 59 63 35
Meningococcal disease: type W135* 0 0 0 0 1 0 2 4 4 3 2
Meningococcal disease: type Y* 0 0 1 1 0 1 0 7 1 7 2
Meningococcal disease: other 128 115 139 125 81 90 109 63 57 85 108
Mumps* 8 23 13 11 14 27 29 39 32 92 28
Paratyphoid* 20 8 9 11 12 15 5 9 4 13 11
Pertussis 49 217 1533 1405 1370 1156 4250 2311 1415 3681 4435
Pneumococcal disease (invasive)* not notifiable until December 2000 434
Psittacosis* not notifiable until December 2000 37
Q Fever* 167 213 404 267 202 287 258 235 164 130 139
Rubella: Total* 60 324 1186 233 2376 636 153 78 46 190 58
Rubella* 59 324 1184 229 2375 631 153 78 45 190 58
Rubella (Congenital)* 1 0 2 4 1 5 0 0 1 0 0
Salmonella infections* 1171 802 980 1101 1365 1224 1698 1811 1424 1386 1637
Shigellosis* not notifiable until December 2000 132
Syphilis: Total 584 877 738 974 832 662 513 597 521 531 502
Syphilis: <1 year duration* 1 3 6 29 135 71 57 44 89 73 53
Syphilis: congenital 1 1 0 2 7 3 4 1 3 2 3
Syphilis: other* 582 873 732 943 690 588 452 552 429 456 446
Tetanus 5 2 5 4 0 1 3 3 1 2 0
Tuberculosis* 430 394 389 394 443 410 422 383 480 445 415
Typhoid* 38 20 28 25 27 30 28 18 32 26 31
Verotoxin-producing Escherichia coli infections* not notifiable until December 1996 0 2 0 1 1
* lab-confirmed cases only NOS = Not otherwise specified
NSW Public Health Bulletin
Vol. 13 No. 8 181
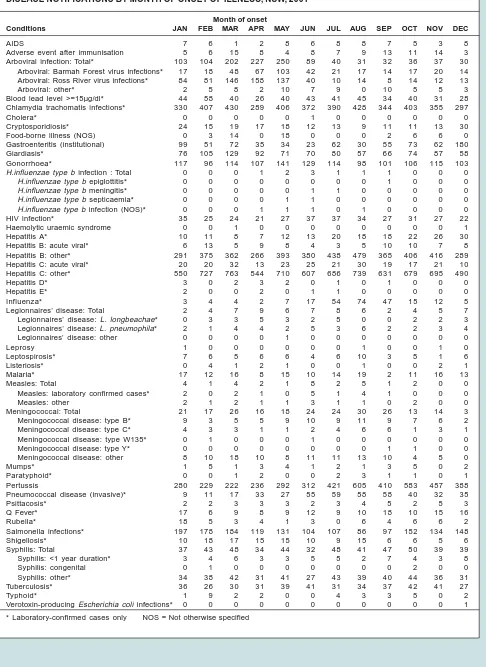
TABLE 2
DISEASE NOTIFICATIONS BY MONTH OF ONSET OF ILLNESS, NSW, 2001
Month of onset
Conditions JAN FEB MAR APR MAY JUN JUL AUG SEP OCT NOV DEC
AIDS 7 6 1 2 8 6 8 8 7 5 3 8
Adverse event after immunisation 5 6 15 8 4 8 7 9 13 11 14 3
Arboviral infection: Total* 103 104 202 227 250 89 40 31 32 36 37 30
Arboviral: Barmah Forest virus infections* 17 18 48 67 103 42 21 17 14 17 20 14
Arboviral: Ross River virus infections* 84 81 146 158 137 40 10 14 8 14 12 13
Arboviral: other* 2 5 8 2 10 7 9 0 10 5 5 3
Blood lead level >=15µg/dl* 44 58 40 26 40 43 41 45 34 40 31 28
Chlamydia trachomatis infections* 330 407 430 289 406 372 390 428 344 403 355 297
Cholera* 0 0 0 0 0 1 0 0 0 0 0 0
Cryptosporidiosis* 24 15 19 17 18 12 13 9 11 11 13 30
Food-borne illness (NOS) 0 3 14 0 18 0 0 0 2 6 6 0
Gastroenteritis (institutional) 99 51 72 35 34 23 62 30 55 73 62 180
Giardiasis* 76 105 129 92 71 70 80 57 66 74 87 58
Gonorrhoea* 117 96 114 107 141 129 114 98 101 106 115 103
H.influenzae type b infection : Total 0 0 0 1 2 3 1 1 1 0 0 0
H.influenzae type b epiglottitis* 0 0 0 0 0 0 0 0 1 0 0 0
H.influenzae type b meningitis* 0 0 0 0 0 1 1 0 0 0 0 0
H.influenzae type b septicaemia* 0 0 0 0 1 1 0 0 0 0 0 0
H.influenzae type b infection (NOS)* 0 0 0 1 1 1 0 1 0 0 0 0
HIV infection* 35 25 24 21 27 37 37 34 27 31 27 22
Haemolytic uraemic syndrome 0 0 1 0 0 0 0 0 0 0 0 1
Hepatitis A* 10 11 8 7 12 13 20 18 18 22 26 30
Hepatitis B: acute viral* 6 13 5 9 8 4 3 5 10 10 7 8
Hepatitis B: other* 291 375 362 266 393 380 438 479 365 406 416 289
Hepatitis C: acute viral* 20 20 32 13 23 25 21 30 19 17 21 10
Hepatitis C: other* 550 727 763 544 710 607 686 739 631 679 695 490
Hepatitis D* 3 0 2 3 2 0 1 0 1 0 0 0
Hepatitis E* 2 0 0 2 0 1 1 0 0 0 0 0
Influenza* 3 4 4 2 7 17 54 74 47 15 12 5
Legionnaires’ disease: Total 2 4 7 9 6 7 8 6 2 4 5 7
Legionnaires’ disease: L. longbeachae* 0 3 3 5 3 2 5 0 0 2 2 3
Legionnaires’ disease: L. pneumophila* 2 1 4 4 2 5 3 6 2 2 3 4
Legionnaires’ disease: other 0 0 0 0 1 0 0 0 0 0 0 0
Leprosy 1 0 0 0 0 0 0 1 0 0 1 0
Leptospirosis* 7 6 5 6 6 4 6 10 3 5 1 6
Listeriosis* 0 4 1 2 1 0 0 1 0 0 2 1
Malaria* 17 12 16 8 15 10 14 19 2 11 16 13
Measles: Total 4 1 4 2 1 8 2 5 1 2 0 0
Measles: laboratory confirmed cases* 2 0 2 1 0 5 1 4 1 0 0 0
Measles: other 2 1 2 1 1 3 1 1 0 2 0 0
Meningococcal: Total 21 17 26 16 18 24 24 30 26 13 14 3
Meningococcal disease: type B* 9 3 5 5 9 10 9 11 9 7 6 2
Meningococcal disease: type C* 4 3 3 1 1 2 4 6 6 1 3 1
Meningococcal disease: type W135* 0 1 0 0 0 1 0 0 0 0 0 0
Meningococcal disease: type Y* 0 0 0 0 0 0 0 0 1 1 0 0
Meningococcal disease: other 8 10 18 10 8 11 11 13 10 4 5 0
Mumps* 1 5 1 3 4 1 2 1 3 5 0 2
Paratyphoid* 0 0 1 2 0 0 2 3 1 1 0 1
Pertussis 280 229 222 236 292 312 421 605 410 583 457 388
Pneumococcal disease (invasive)* 9 11 17 33 27 55 59 58 58 40 32 35
Psittacosis* 2 2 3 3 3 2 3 4 5 2 5 3
Q Fever* 17 6 9 8 9 12 9 10 18 10 15 16
Rubella* 18 5 3 4 1 3 0 6 4 6 6 2
Salmonella infections* 197 178 184 119 131 104 107 86 97 152 134 148
Shigellosis* 10 18 17 15 15 10 9 15 6 6 5 6
Syphilis: Total 37 43 48 34 44 32 48 41 47 50 39 39
Syphilis: <1 year duration* 3 4 6 3 3 5 5 2 7 4 3 8
Syphilis: congenital 0 1 0 0 0 0 0 0 0 2 0 0
Syphilis: other* 34 38 42 31 41 27 43 39 40 44 36 31
Tuberculosis* 36 26 30 31 39 41 31 34 37 42 41 27
Typhoid* 1 9 2 2 0 0 4 3 3 5 0 2
Verotoxin-producing Escherichia coli infections* 0 0 0 0 0 0 0 0 0 0 0 1
TABLE 3
DISEASE NOTIFICATIONS BY AREA HEALTH SERVICE OF RESIDENCE, RATES PER 100,000 POPULATION, NSW, 2001
Conditions CCA CSA FWA GMA HUN ILL MAC MNC MWA
AIDS 0.3 2.8 0.0 0.4 0.9 0.6 0.0 0.4 0.6
Adverse event after immunisation 0.7 0.6 2.1 4.6 2.4 1.4 1.0 0.8 3.0
Arboviral infections: Total* 15.8 2.2 45.6 32.1 24.2 14.3 33.8 119.5 13.7
Arboviral: Barmah Forest virus infections* 0.3 0.0 14.5 1.2 1.3 5.7 2.9 81.3 0.6
Arboviral: Ross River virus infections* 14.4 0.8 29.0 30.2 21.8 8.0 29.9 35.2 12.5
Arboviral: other* 1.0 1.4 2.1 0.8 1.1 0.6 1.0 3.0 0.6
Blood lead level >=15µg/dl* 2.7 3.2 118.2 3.9 32.5 10.3 13.5 3.4 1.2
Chlamydia trachomatis infections* 39.6 98.8 120.3 59.2 58.0 44.5 104.2 56.0 71.6
Cholera* 0.0 0.0 0.0 0.0 0.0 0.0 0.0 0.0 0.0
Cryptosporidiosis* 0.0 3.2 4.1 2.7 0.7 2.3 6.8 8.3 1.2
Food-borne illness (NOS) 0.0 3.0 0.0 0.0 0.0 0.0 2.9 0.0 0.6
Gastroenteritis (institutional) 0.0 27.2 2.1 0.0 27.9 16.6 1.9 0.0 0.6
Giardiasis 8.4 16.9 12.4 15.1 17.5 9.4 10.6 12.5 12.5
Gonorrhoea* 4.4 58.1 43.5 2.3 2.8 3.4 8.7 5.7 3.6
H.influenzae type b infection: Total 0.3 0.0 0.0 0.0 0.4 0.3 1.0 0.0 0.0
H.influenzae type b epiglottitis 0.0 0.0 0.0 0.0 0.2 0.0 0.0 0.0 0.0
H.influenzae type b meningitis 0.3 0.0 0.0 0.0 0.0 0.0 0.0 0.0 0.0
H.influenzae type b septicaemia 0.0 0.0 0.0 0.0 0.0 0.0 0.0 0.0 0.0
H.influenzae type b infection (NOS) 0.0 0.0 0.0 0.0 0.2 0.3 1.0 0.0 0.0
HIV infection* 0.3 14.3 2.1 1.1 2.0 1.1 0.0 2.3 1.8
Haemolytic uraemic syndrome 0.3 0.0 0.0 0.0 0.0 0.0 0.0 0.0 0.0
Hepatitis A* 1.0 8.1 0.0 0.4 1.1 2.6 0.0 1.5 0.0
Hepatitis B: acute viral* 0.0 2.0 0.0 1.5 1.3 1.4 6.8 1.1 1.8
Hepatitis B: other* 17.8 134.3 60.1 12.4 10.5 23.4 17.4 7.9 10.7
Hepatitis C: acute viral* 0.0 5.8 0.0 2.7 5.0 5.1 0.0 5.3 6.0
Hepatitis C: other* 106.0 160.9 76.7 60.8 95.4 87.1 55.0 114.6 159.8
Hepatitis D* 0.0 0.2 0.0 0.0 0.0 0.0 0.0 0.0 0.6
Hepatitis E* 0.0 0.2 0.0 0.0 0.0 0.0 0.0 0.0 0.0
Influenza* 0.3 4.2 0.0 1.9 5.5 1.4 1.0 4.9 3.0
Legionnaires’ disease: Total 0.7 1.0 0.0 0.0 1.1 0.6 1.9 0.4 0.0
Legionnaires’ disease: L. longbeachae* 0.3 0.6 0.0 0.0 0.6 0.3 1.0 0.4 0.0
Legionnaires’ disease: L. pneumophila* 0.3 0.4 0.0 0.0 0.6 0.0 1.0 0.0 0.0
Legionnaires’ disease: other 0.0 0.0 0.0 0.0 0.0 0.3 0.0 0.0 0.0
Leprosy 0.0 0.0 2.1 0.0 0.0 0.0 0.0 0.0 0.0
Leptospirosis* 0.3 0.0 0.0 0.4 2.8 0.0 1.0 5.7 1.2
Listeriosis* 0.3 0.0 0.0 0.4 0.4 0.0 0.0 0.0 0.6
Malaria* 2.3 1.6 0.0 2.3 2.8 1.4 0.0 2.6 1.8
Measles: Total 0.0 0.4 2.1 0.0 0.0 0.9 2.9 0.0 0.0
Measles: laboratory confirmed cases* 0.0 0.2 0.0 0.0 0.0 0.6 1.9 0.0 0.0
Measles: other 0.0 0.2 2.1 0.0 0.0 0.3 1.0 0.0 0.0
Meningococcal: Total 5.0 4.4 4.1 1.2 2.4 6.0 14.5 3.8 4.8
Meningococcal disease: type B* 1.3 0.6 0.0 0.4 1.3 2.6 1.9 2.6 3.0
Meningococcal disease: type C* 3.0 1.2 0.0 0.4 0.6 0.3 0.0 0.8 0.6
Meningococcal disease: type W135* 0.0 0.0 0.0 0.0 0.0 0.0 0.0 0.0 0.0
Meningococcal disease: type Y* 0.0 0.0 0.0 0.0 0.0 0.0 1.0 0.0 0.6
Meningococcal disease: other 0.7 2.6 4.1 0.4 0.6 3.1 11.6 0.4 0.6
Mumps* 0.3 0.4 0.0 0.0 0.2 1.4 0.0 0.0 1.2
Paratyphoid* 0.7 0.2 0.0 0.0 0.2 0.0 0.0 0.0 0.0
Pertussis 32.2 36.5 41.5 123.9 97.8 65.1 197.7 65.4 107.3
Pneumococcal disease (invasive)* 17.4 7.5 2.1 2.7 11.3 7.7 0.0 0.8 9.5
Psittacosis* 0.0 0.0 0.0 1.9 1.7 0.3 1.0 2.6 0.0
Q Fever* 0.3 0.0 6.2 0.8 2.4 0.6 28.9 9.5 7.2
Rubella* 1.0 2.0 0.0 0.4 3.1 0.9 0.0 0.0 0.6
Salmonella infections* 13.4 21.8 45.6 21.7 22.5 13.1 25.1 30.3 29.8
Shigellosis* 0.3 5.0 6.2 0.0 0.7 0.9 0.0 0.8 0.0
Syphilis: Total 4.4 16.7 16.6 1.1 1.5 1.4 8.7 4.2 6.6
Syphilis: <1 year duration* 0.3 1.8 6.2 0.0 0.2 0.0 5.8 1.9 1.2
Syphilis: congenital 0.0 0.0 0.0 0.0 0.0 0.0 0.0 0.0 0.0
Syphilis: other* 4.0 14.9 10.4 1.1 1.3 1.4 2.9 2.3 5.4
Tuberculosis* 1.3 16.3 0.0 1.2 1.5 2.6 0.0 1.1 0.0
Typhoid* 0.3 1.2 0.0 0.0 0.6 0.0 0.0 0.0 0.0
Verotoxin-producing Escherichia coli infections* 0.0 0.0 0.0 0.0 0.0 0.0 0.0 0.0 0.0
* lab-confirmed cases only NOS = Not otherwise specified (a) = includes cases with unknown public health unit area Area health service population estimates 2001: CCA = Central Coast Area (298 072); CSA = Central Sydney Area (496 079); FWA = Far West Area (48 227); GMA = Greater Murray Area (272 547); HUN = Hunter Area (541 744);
NSW Public Health Bulletin
Vol. 13 No. 8 183
TABLE 3
DISEASE NOTIFICATIONS BY AREA HEALTH SERVICE OF RESIDENCE, RATES PER 100,000 POPULATION, NSW, 2001
continued
Conditions NEA NRA NSA SA SES SWS WEN WSA NSW (a)
AIDS 0.0 1.9 0.9 0.0 3.5 0.0 0.6 0.3 2.0
Adverse event after immunisation 0.0 0.8 2.3 7.0 1.8 0.5 0.6 0.9 1.6
Arboviral infections: Total* 28.2 82.5 3.6 28.0 1.5 1.8 17.5 4.5 18.1
Arboviral: Barmah Forest virus infections* 2.9 37.9 0.1 16.7 0.0 0.1 0.3 0.1 6.1
Arboviral: Ross River virus infections* 24.7 44.7 1.8 9.7 0.6 1.3 16.9 3.5 11.0
Arboviral: other* 0.6 0.0 1.7 1.6 0.9 0.4 0.3 0.9 1.0
Blood lead level >=15µg/dl 2.9 1.1 2.1 2.2 2.5 7.5 4.4 3.0 7.2
Chlamydia trachomatis infections* 97.7 71.3 55.3 45.8 133.0 38.1 57.2 53.7 68.2
Cholera* 0.0 0.0 0.0 0.0 0.1 0.0 0.0 0.0 0.0
Cryptosporidiosis* 7.5 12.8 0.9 4.3 4.3 0.9 0.9 2.7 2.9
Food-borne illness (NOS) 0.0 9.0 0.0 0.0 0.6 0.0 0.0 0.1 0.8
Gastroenteritis (institutional) 3.4 0.4 6.7 44.7 0.4 0.0 5.6 38.2 11.9
Giardiasis* 27.0 27.8 16.4 3.8 21.4 7.5 16.3 12.1 14.8
Gonorrhoea* 25.3 9.4 11.5 4.8 74.3 14.4 6.3 10.4 20.6
H.influenzae type b infection: Total 1.1 0.0 0.0 0.0 0.1 0.0 0.0 0.1 0.1
H.influenzae type b epiglottitis* 0.0 0.0 0.0 0.0 0.0 0.0 0.0 0.0 0.0
H.influenzae type b meningitis* 0.6 0.0 0.0 0.0 0.0 0.0 0.0 0.0 0.0
H.influenzae type b septicaemia* 0.0 0.0 0.0 0.0 0.1 0.0 0.0 0.1 0.0
H.influenzae type b infection (NOS)* 0.6 0.0 0.0 0.0 0.0 0.0 0.0 0.0 0.1
HIV infection* 2.3 1.9 3.3 0.0 20.1 2.8 1.9 3.7 5.3
Haemolytic uraemic syndrome 0.0 0.0 0.0 0.0 0.0 0.1 0.0 0.0 0.0
Hepatitis A* 1.1 3.4 2.8 1.1 6.4 1.8 0.3 4.6 3.0
Hepatitis B: acute viral* 0.6 2.3 0.4 1.1 2.6 1.6 0.0 0.4 1.3
Hepatitis B: other* 20.7 10.9 56.2 14.0 76.4 190.2 26.0 107.6 68.4
Hepatitis C: acute viral* 3.4 3.8 6.2 10.2 3.4 0.6 5.6 1.9 3.8
Hepatitis C: other* 88.5 140.0 47.2 104.5 134.9 155.8 136.0 176.2 119.9
Hepatitis D* 0.0 0.8 0.0 1.6 0.4 0.0 0.0 0.3 0.2
Hepatitis E* 0.0 0.0 0.0 0.0 0.0 0.1 0.0 0.6 0.1
Influenza* 6.9 6.0 1.5 5.4 4.0 4.0 3.4 5.6 3.7
Legionnaires’ disease: Total 0.6 0.4 1.3 1.6 0.9 0.8 0.6 2.7 1.0
Legionnaires’ disease: L. longbeachae* 0.0 0.4 0.5 0.5 0.6 0.3 0.0 0.7 0.4
Legionnaires’ disease: L. pneumophila* 0.6 0.0 0.8 1.1 0.3 0.5 0.6 2.0 0.6
Legionnaires’ disease: other 0.0 0.0 0.0 0.0 0.0 0.0 0.0 0.0 0.0
Leprosy 0.0 0.0 0.0 0.5 0.0 0.1 0.0 0.0 0.0
Leptospirosis* 9.8 2.6 0.3 0.5 0.4 0.0 0.0 0.0 1.0
Listeriosis* 0.0 0.0 0.1 0.0 0.6 0.1 0.0 0.0 0.2
Malaria* 3.4 3.8 4.1 1.6 1.7 2.1 1.3 2.0 2.3
Measles: Total 1.1 0.0 0.8 0.0 0.0 0.3 0.6 1.3 0.5
Measles: laboratory confirmed cases* 0.0 0.0 0.8 0.0 0.0 0.3 0.0 0.4 0.2
Measles: other 1.1 0.0 0.0 0.0 0.0 0.0 0.6 0.9 0.2
Meningococcal: Total 1.1 2.3 2.7 3.2 4.5 2.6 2.5 3.3 3.6
Meningococcal disease: type B* 0.0 0.8 0.9 1.6 1.3 1.3 0.9 1.7 1.3
Meningococcal disease: type C* 0.0 0.4 0.5 0.0 0.1 0.3 0.6 0.3 0.5
Meningococcal disease: type W135* 0.0 0.0 0.0 0.0 0.0 0.1 0.0 0.0 0.0
Meningococcal disease: type Y* 0.0 0.0 0.0 0.0 0.0 0.0 0.0 0.0 0.0
Meningococcal disease: other 1.1 1.1 1.3 1.6 3.1 1.0 0.9 1.3 1.7
Mumps* 0.0 0.0 0.8 0.0 0.9 0.3 0.0 0.3 0.4
Paratyphoid* 0.0 0.0 0.0 0.0 0.4 0.0 0.0 0.6 0.2
Pertussis 83.3 150.8 62.3 49.6 52.6 35.3 87.9 58.5 68.0
Pneumococcal disease (invasive)* 2.3 1.9 8.5 1.1 6.3 1.0 11.3 8.8 6.7
Psittacosis* 2.9 1.5 0.0 0.0 0.0 0.4 0.3 0.1 0.6
Q Fever* 6.9 10.5 0.0 3.2 0.0 0.1 0.9 0.1 2.1
Rubella* 4.6 1.5 0.1 0.5 0.4 0.3 0.6 0.3 0.9
Salmonella infections* 22.4 69.0 23.3 14.0 26.8 23.4 27.5 24.9 25.1
Shigellosis* 0.0 1.9 2.1 0.5 6.7 1.5 0.3 1.0 2.0
Syphilis: Total 3.4 1.1 2.8 4.8 15.2 14.7 4.4 8.9 7.7
Syphilis: <1 year duration* 0.6 0.8 0.4 0.5 1.8 0.0 0.0 0.7 0.8
Syphilis: congenital 0.6 0.0 0.0 0.0 0.3 0.0 0.0 0.0 0.0
Syphilis: other* 2.3 0.4 2.4 4.3 13.2 14.7 4.4 8.2 6.8
Tuberculosis* 0.0 3.4 6.2 2.2 10.2 10.7 1.6 11.1 6.4
Typhoid* 0.0 0.0 0.8 0.0 0.6 0.5 0.0 0.7 0.5
Verotoxin-producing Escherichia coli infections* 0.0 0.0 0.0 0.0 0.1 0.0 0.0 0.0 0.0
* lab-confirmed cases only NOS = Not otherwise specified (a) = includes cases with unknown public health unit area Area health service population estimates 2001: NEA = New England Area (174 008); NRA = Northern Rivers Area (266 508); NSA = North Sydney Area (780 046); SA = Southern Area (185 667); SES= South Eastern Sydney (775 200);
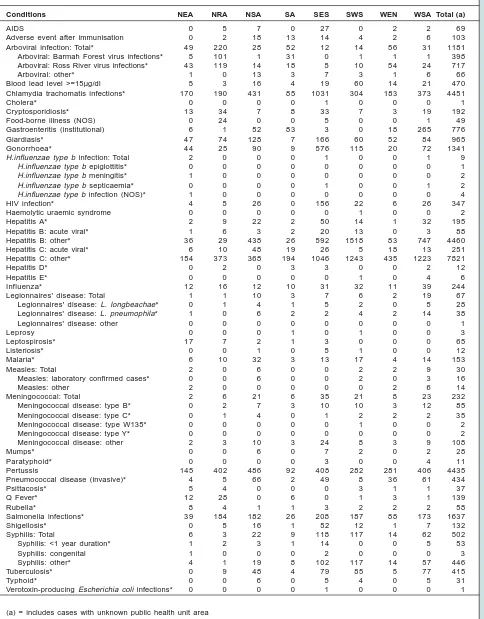
TABLE 4
DISEASE NOTIFICATIONS BY AREA HEALTH SERVICE OF RESIDENCE, NSW, 2001
Conditions CCA CSA FWA GMA HUN ILL MAC MNC MWA
AIDS 1 14 0 1 5 2 0 1 1
Adverse event after immunisation 2 3 1 12 13 5 1 2 5
Arboviral infections: Total* 47 11 22 83 131 50 35 316 23
Arboviral: Barmah Forest virus infections* 1 0 7 3 7 20 3 215 1
Arboviral: Ross River virus infections* 43 4 14 78 118 28 31 93 21
Arboviral: other* 3 7 1 2 6 2 1 8 1
Blood lead level >=15µg/dl 8 16 57 10 176 36 14 9 2
Chlamydia trachomatis infections* 118 490 58 153 314 156 108 148 120
Cholera* 0 0 0 0 0 0 0 0 0
Cryptosporidiosis* 0 16 2 7 4 8 7 22 2
Food-borne illness (NOS) 0 15 0 0 0 0 3 0 1
Gastroenteritis (institutional) 0 135 1 0 151 58 2 0 1
Giardiasis 25 84 6 39 95 33 11 33 21
Gonorrhoea* 13 288 21 6 15 12 9 15 6
H.influenzae type b infection: Total* 1 0 0 0 2 1 1 0 0
H.influenzae type b epiglottitis* 0 0 0 0 1 0 0 0 0
H.influenzae type b meningitis* 1 0 0 0 0 0 0 0 0
H.influenzae type b septicaemia* 0 0 0 0 0 0 0 0 0
H.influenzae type b infection (NOS)* 0 0 0 0 1 1 1 0 0
HIV infection* 1 71 1 3 11 4 0 6 3
Haemolytic uraemic syndrome 1 0 0 0 0 0 0 0 0
Hepatitis A* 3 40 0 1 6 9 0 4 0
Hepatitis B: acute viral* 0 10 0 4 7 5 7 3 3
Hepatitis B: other* 53 666 29 32 57 82 18 21 18
Hepatitis C: acute viral* 0 29 0 7 27 18 0 14 10
Hepatitis C: other* 316 798 37 157 517 305 57 303 268
Hepatitis D* 0 1 0 0 0 0 0 0 1
Hepatitis E* 0 1 0 0 0 0 0 0 0
Influenza* 1 21 0 5 30 5 1 13 5
Legionnaires’ disease: Total 2 5 0 0 6 2 2 1 0
Legionnaires’ disease: L. longbeachae* 1 3 0 0 3 1 1 1 0
Legionnaires’ disease: L. pneumophila* 1 2 0 0 3 0 1 0 0
Legionnaires’ disease: other 0 0 0 0 0 1 0 0 0
Leprosy 0 0 1 0 0 0 0 0 0
Leptospirosis* 1 0 0 1 15 0 1 15 2
Listeriosis* 1 0 0 1 2 0 0 0 1
Malaria* 7 8 0 6 15 5 0 7 3
Measles: Total 0 2 1 0 0 3 3 0 0
Measles: laboratory confirmed cases* 0 1 0 0 0 2 2 0 0
Measles: other 0 1 1 0 0 1 1 0 0
Meningococcal: Total 15 22 2 3 13 21 15 10 8
Meningococcal disease: type B* 4 3 0 1 7 9 2 7 5
Meningococcal disease: type C* 9 6 0 1 3 1 0 2 1
Meningococcal disease: type W135* 0 0 0 0 0 0 0 0 0
Meningococcal disease: type Y* 0 0 0 0 0 0 1 0 1
Meningococcal disease: other 2 13 2 1 3 11 12 1 1
Mumps* 1 2 0 0 1 5 0 0 2
Paratyphoid* 2 1 0 0 1 0 0 0 0
Pertussis 96 181 20 320 530 228 205 173 180
Pneumococcal disease (invasive)* 52 37 1 7 61 27 0 2 16
Psittacosis* 0 0 0 5 9 1 1 7 0
Q Fever* 1 0 3 2 13 2 30 25 12
Rubella* 3 10 0 1 17 3 0 0 1
Salmonella infections* 40 108 22 56 122 46 26 80 50
Shigellosis* 1 25 3 0 4 3 0 2 0
Syphilis: Total 13 83 8 3 8 5 9 11 11
Syphilis: <1 year duration* 1 9 3 0 1 0 6 5 2
Syphilis: congenital 0 0 0 0 0 0 0 0 0
Syphilis: other* 12 74 5 3 7 5 3 6 9
Tuberculosis* 4 81 0 3 8 9 0 3 0
Typhoid* 1 6 0 0 3 0 0 0 0
Verotoxin-producing Escherichia coli infections* 0 0 0 0 0 0 0 0 0
NSW Public Health Bulletin
Vol. 13 No. 8 185
TABLE 4
DISEASE NOTIFICATIONS BY AREA HEALTH SERVICE OF RESIDENCE, NSW, 2001
continued
Conditions NEA NRA NSA SA SES SWS WEN WSA Total (a)
AIDS 0 5 7 0 27 0 2 2 69
Adverse event after immunisation 0 2 18 13 14 4 2 6 103
Arboviral infection: Total* 49 220 28 52 12 14 56 31 1181
Arboviral: Barmah Forest virus infections* 5 101 1 31 0 1 1 1 398
Arboviral: Ross River virus infections* 43 119 14 18 5 10 54 24 717
Arboviral: other* 1 0 13 3 7 3 1 6 66
Blood lead level >=15µg/dl 5 3 16 4 19 60 14 21 470
Chlamydia trachomatis infections* 170 190 431 85 1031 304 183 373 4451
Cholera* 0 0 0 0 1 0 0 0 1
Cryptosporidiosis* 13 34 7 8 33 7 3 19 192
Food-borne illness (NOS) 0 24 0 0 5 0 0 1 49
Gastroenteritis (institutional) 6 1 52 83 3 0 18 265 776
Giardiasis* 47 74 128 7 166 60 52 84 965
Gonorrhoea* 44 25 90 9 576 115 20 72 1341
H.influenzae type b infection: Total 2 0 0 0 1 0 0 1 9
H.influenzae type b epiglottitis* 0 0 0 0 0 0 0 0 1
H.influenzae type b meningitis* 1 0 0 0 0 0 0 0 2
H.influenzae type b septicaemia* 0 0 0 0 1 0 0 1 2
H.influenzae type b infection (NOS)* 1 0 0 0 0 0 0 0 4
HIV infection* 4 5 26 0 156 22 6 26 347
Haemolytic uraemic syndrome 0 0 0 0 0 1 0 0 2
Hepatitis A* 2 9 22 2 50 14 1 32 195
Hepatitis B: acute viral* 1 6 3 2 20 13 0 3 88
Hepatitis B: other* 36 29 438 26 592 1518 83 747 4460
Hepatitis C: acute viral* 6 10 48 19 26 5 18 13 251
Hepatitis C: other* 154 373 368 194 1046 1243 435 1223 7821
Hepatitis D* 0 2 0 3 3 0 0 2 12
Hepatitis E* 0 0 0 0 0 1 0 4 6
Influenza* 12 16 12 10 31 32 11 39 244
Legionnaires' disease: Total 1 1 10 3 7 6 2 19 67
Legionnaires' disease: L. longbeachae* 0 1 4 1 5 2 0 5 28
Legionnaires' disease: L. pneumophila* 1 0 6 2 2 4 2 14 38
Legionnaires' disease: other 0 0 0 0 0 0 0 0 1
Leprosy 0 0 0 1 0 1 0 0 3
Leptospirosis* 17 7 2 1 3 0 0 0 65
Listeriosis* 0 0 1 0 5 1 0 0 12
Malaria* 6 10 32 3 13 17 4 14 153
Measles: Total 2 0 6 0 0 2 2 9 30
Measles: laboratory confirmed cases* 0 0 6 0 0 2 0 3 16
Measles: other 2 0 0 0 0 0 2 6 14
Meningococcal: Total 2 6 21 6 35 21 8 23 232
Meningococcal disease: type B* 0 2 7 3 10 10 3 12 85
Meningococcal disease: type C* 0 1 4 0 1 2 2 2 35
Meningococcal disease: type W135* 0 0 0 0 0 1 0 0 2
Meningococcal disease: type Y* 0 0 0 0 0 0 0 0 2
Meningococcal disease: other 2 3 10 3 24 8 3 9 108
Mumps* 0 0 6 0 7 2 0 2 28
Paratyphoid* 0 0 0 0 3 0 0 4 11
Pertussis 145 402 486 92 408 282 281 406 4435
Pneumococcal disease (invasive)* 4 5 66 2 49 8 36 61 434
Psittacosis* 5 4 0 0 0 3 1 1 37
Q Fever* 12 28 0 6 0 1 3 1 139
Rubella* 8 4 1 1 3 2 2 2 58
Salmonella infections* 39 184 182 26 208 187 88 173 1637
Shigellosis* 0 5 16 1 52 12 1 7 132
Syphilis: Total 6 3 22 9 118 117 14 62 502
Syphilis: <1 year duration* 1 2 3 1 14 0 0 5 53
Syphilis: congenital 1 0 0 0 2 0 0 0 3
Syphilis: other* 4 1 19 8 102 117 14 57 446
Tuberculosis* 0 9 48 4 79 85 5 77 415
Typhoid* 0 0 6 0 5 4 0 5 31
Verotoxin-producing Escherichia coli infections* 0 0 0 0 1 0 0 0 1
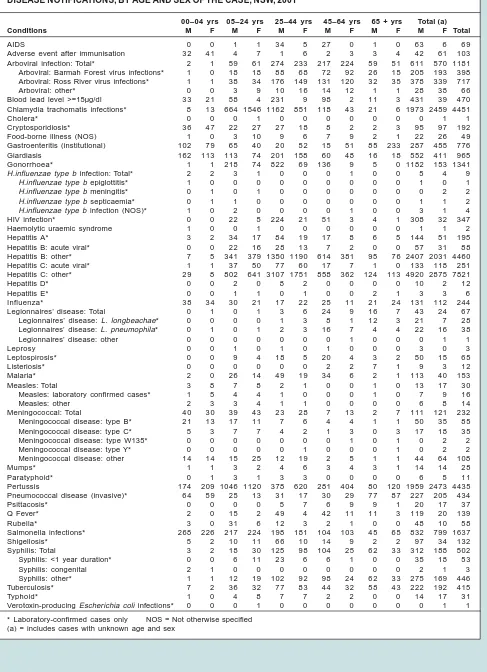
TABLE 5
DISEASE NOTIFICATIONS, BY AGE AND SEX OF THE CASE, NSW, 2001
00–04 yrs 05–24 yrs 25–44 yrs 45–64 yrs 65 + yrs Total (a) Conditions M F M F M F M F M F M F Total
AIDS 0 0 1 1 34 5 27 0 1 0 63 6 69
Adverse event after immunisation 32 41 4 7 1 6 2 3 3 4 42 61 103
Arboviral infection: Total* 2 1 59 61 274 233 217 224 59 51 611 570 1181
Arboviral: Barmah Forest virus infections* 1 0 18 18 88 68 72 92 26 15 205 193 398
Arboviral: Ross River virus infections* 1 1 38 34 176 149 131 120 32 35 378 339 717
Arboviral: other* 0 0 3 9 10 16 14 12 1 1 28 38 66
Blood lead level >=15µg/dl 33 21 58 4 231 9 98 2 11 3 431 39 470
Chlamydia trachomatis infections* 8 13 664 1546 1162 851 118 43 21 6 1973 2459 4451
Cholera* 0 0 0 1 0 0 0 0 0 0 0 1 1
Cryptosporidiosis* 36 47 22 27 27 18 8 2 2 3 95 97 192
Food-borne illness (NOS) 1 0 3 10 9 6 7 9 2 1 22 26 49
Gastroenteritis (institutional) 102 79 65 40 20 52 15 51 85 233 287 455 776
Giardiasis 162 113 113 74 201 158 60 48 16 18 552 411 965
Gonorrhoea* 1 1 218 74 822 69 136 9 5 0 1182 153 1341
H.influenzae type b infection: Total* 2 2 3 1 0 0 0 1 0 0 5 4 9
H.influenzae type b epiglottitis* 1 0 0 0 0 0 0 0 0 0 1 0 1
H.influenzae type b meningitis* 0 1 0 1 0 0 0 0 0 0 0 2 2
H.influenzae type b septicaemia* 0 1 1 0 0 0 0 0 0 0 1 1 2
H.influenzae type b infection (NOS)* 1 0 2 0 0 0 0 1 0 0 3 1 4
HIV infection* 0 0 22 5 224 21 51 3 4 1 308 32 347
Haemolytic uraemic syndrome 1 0 0 1 0 0 0 0 0 0 1 1 2
Hepatitis A* 3 2 34 17 84 19 17 8 6 5 144 51 195
Hepatitis B: acute viral* 0 0 22 16 28 13 7 2 0 0 57 31 88
Hepatitis B: other* 7 5 341 379 1350 1190 614 381 95 76 2407 2031 4460
Hepatitis C: acute viral* 1 1 37 50 77 60 17 7 1 0 133 118 251
Hepatitis C: other* 29 8 802 641 3107 1751 858 362 124 113 4920 2875 7821
Hepatitis D* 0 0 2 0 8 2 0 0 0 0 10 2 12
Hepatitis E* 0 0 1 1 0 1 0 0 2 1 3 3 6
Influenza* 38 34 30 21 17 22 25 11 21 24 131 112 244
Legionnaires’ disease: Total 0 1 0 1 3 6 24 9 16 7 43 24 67
Legionnaires’ disease: L. longbeachae* 0 0 0 0 1 3 8 1 12 3 21 7 28
Legionnaires’ disease: L. pneumophila* 0 1 0 1 2 3 16 7 4 4 22 16 38
Legionnaires’ disease: other 0 0 0 0 0 0 0 1 0 0 0 1 1
Leprosy 0 0 1 0 1 0 1 0 0 0 3 0 3
Leptospirosis* 0 0 9 4 18 5 20 4 3 2 50 15 65
Listeriosis* 0 0 0 0 0 0 2 2 7 1 9 3 12
Malaria* 2 0 26 14 49 19 34 6 2 1 113 40 153
Measles: Total 3 8 7 8 2 1 0 0 1 0 13 17 30
Measles: laboratory confirmed cases* 1 5 4 4 1 0 0 0 1 0 7 9 16
Measles: other 2 3 3 4 1 1 0 0 0 0 6 8 14
Meningococcal: Total 40 30 39 43 23 28 7 13 2 7 111 121 232
Meningococcal disease: type B* 21 13 17 11 7 6 4 4 1 1 50 35 85
Meningococcal disease: type C* 5 3 7 7 4 2 1 3 0 3 17 18 35
Meningococcal disease: type W135* 0 0 0 0 0 0 0 1 0 1 0 2 2
Meningococcal disease: type Y* 0 0 0 0 0 1 0 0 0 1 0 2 2
Meningococcal disease: other 14 14 15 25 12 19 2 5 1 1 44 64 108
Mumps* 1 1 3 2 4 6 3 4 3 1 14 14 28
Paratyphoid* 0 1 3 1 3 3 0 0 0 0 6 5 11
Pertussis 174 209 1046 1120 378 620 281 404 80 120 1959 2473 4435
Pneumococcal disease (invasive)* 64 59 25 13 31 17 30 29 77 87 227 205 434
Psittacosis* 0 0 0 0 5 7 6 9 9 1 20 17 37
Q Fever* 2 0 15 2 49 4 42 11 11 3 119 20 139
Rubella* 3 0 31 6 12 3 2 1 0 0 48 10 58
Salmonella infections* 268 226 217 224 198 181 104 103 45 65 832 799 1637
Shigellosis* 5 2 10 11 66 10 14 9 2 2 97 34 132
Syphilis: Total 3 2 18 30 125 98 104 25 62 33 312 188 502
Syphilis: <1 year duration* 0 0 6 11 23 6 6 1 0 0 35 18 53
Syphilis: congenital 2 1 0 0 0 0 0 0 0 0 2 1 3
Syphilis: other* 1 1 12 19 102 92 98 24 62 33 275 169 446
Tuberculosis* 7 2 36 32 77 83 44 32 58 43 222 192 415
Typhoid* 1 0 4 8 7 7 2 2 0 0 14 17 31
Verotoxin-producing Escherichia coli infections* 0 0 0 1 0 0 0 0 0 0 0 1 1
NSW Public Health Bulletin
Vol. 13 No. 8 187
TABLE 6
REPORTED DEATHS OF RESIDENTS BY YEAR OF ONSET OF ILLNESS, NSW, 1991 TO 2001 **
Conditions 1991 1992 1993 1994 1995 1996 1997 1998 1999 2000 2001
AIDS 344 330 379 423 356 272 125 69 63 71 36
Adverse event after immunisation 0 1 0 1 0 2 1 0 1 1 2
Arboviral infections: Total* 0 1 0 0 0 0 0 0 0 0 1
Arboviral: Ross River virus infections* 0 1 0 0 0 0 0 0 0 0 1
Blood lead level >= 15µg/dl not notifiable until December 1996 2 0 0 0 0
Food-borne illness (NOS) 1 0 1 0 0 0 0 0 0 0 0
Gastroenteritis (institutional) 0 1 2 0 1 0 0 1 0 2 1
Giardiasis not notifiable until August 1998 0 1 0
Gonorrhoea* 0 1 0 0 0 0 0 1 0 0 0
H.influenzae type b infection: Total* 4 4 4 1 0 2 0 0 0 1 1
H.influenzae type b epiglottitis* 0 1 0 0 0 0 0 0 0 1 0
H.influenzae type b meningitis* 2 3 3 0 0 0 0 0 0 0 0
H.influenzae type b septicaemia* 0 0 0 1 0 2 0 0 0 0 0
H.influenzae type b infection (NOS)* 2 0 1 0 0 0 0 0 0 0 1
Haemolytic uraemic syndrome not notifiable until December 1996 0 0 1 1 0
Hepatitis A* 2 1 0 0 0 0 0 2 0 0 0
Hepatitis B: Total* 1 5 6 1 1 1 1 1 1 1 3
Hepatitis B: acute viral* 0 0 1 0 0 0 0 0 0 0 0
Hepatitis B: other* 1 5 5 1 1 1 1 1 1 1 3
Hepatitis C: Total* 4 10 4 5 8 15 22 11 17 20 18
Hepatitis C: acute viral* 0 1 0 0 0 0 0 0 0 0 2
Hepatitis C: other* 4 9 4 5 8 15 22 11 17 20 16
Hepatitis E* 0 0 0 0 0 0 0 0 0 0 1
Legionnaires’ disease: Total 6 12 8 8 7 9 2 6 4 2 3
Legionnaires’ disease: L. longbeachae* 0 1 2 0 1 1 0 5 1 1 1
Legionnaires’ disease: L. pneumophila* 1 10 5 3 4 6 2 0 2 1 2
Legionnaires’ disease: other 5 1 1 5 2 2 0 1 1 0 0
Leptospirosis* 0 0 0 0 0 0 1 0 0 0 0
Listeriosis* 0 0 2 2 2 9 1 5 4 4 3
Malaria* 0 1 0 0 0 0 0 0 0 0 0
Measles: Total 1 2 0 0 0 0 0 0 0 0 0
Measles: laboratory confirmed cases* 0 0 0 0 0 0 0 0 0 0 0
Measles: other 1 2 0 0 0 0 0 0 0 0 0
Meningococcal: Total 3 8 11 15 7 7 7 17 14 14 7
Meningococcal disease: type B* 0 0 1 1 3 0 4 2 7 5 2
Meningococcal disease: type C* 0 0 1 1 0 2 2 10 4 4 5
Meningococcal disease: type W135* 0 0 0 0 0 0 0 0 1 0 0
Meningococcal disease: type Y* 0 0 0 0 0 0 0 1 0 1 0
Meningococcal disease: other 3 8 9 13 4 5 1 4 2 4 0
Pertussis 0 0 0 0 2 2 3 1 1 2 0
Pneumococcal disease (invasive)* not notifiable until December 2000 6
Psittacosis* not notifiable until December 2000 1
Q Fever* 0 0 0 1 0 1 0 0 2 0 0
Salmonella infections* 1 0 0 0 4 4 4 3 3 1 1
Syphilis: Total 0 0 0 1 1 0 1 0 1 2 1
Syphilis: congenital 0 0 0 1 1 0 0 0 0 1 0
Syphilis: other* 0 0 0 0 0 0 1 0 1 1 1
Tetanus 0 0 1 0 0 0 0 0 0 0 0
Tuberculosis 10 26 31 25 23 16 21 25 29 40 33
* lab-confirmed cases only NOS = Not otherwise specified