A b s t r a c t. A machine vision system was introduced for the evaluation and classification of the Iranian saffron peach. Physical features such as size and colour were measured to categorize peaches into three quality classes of red-yellow, yellow-red, and yellow. The HIS model hue, saturation, and luminance was used for colour processing of flawless samples and four boundaries were selected for the peach size image. The colours of peaches estimated by the system were well correlated with the colorimetric index values that are currently used as standards. Experimental results are promising and suggest that using the USDA standard, the size classification accuracy achieved is almost 96%, while the colour classification accuracy is around 90%, and that the spot detection algorithm performs well with correct detection levels of 97 and 85% for brown and white skin spots, respectively.
K e y w o r d s: saffron peach, machine vision, image pro-cessing, size, colour
INTRODUCTION
Human-based sorting and grading of fruits may result in improper grading. Machine vision systems can be conside-red as an appropriate alternative to manual sorting and grading of many fruits (Brosnan and Sun, 2002). Size, which is a parameter identified with quality, has been estimated using machine vision by measuring area, perimeter, volume, and diameters in visible range (Du and Sun, 2004; Khojasteh-nazhandet al., 2009; Moredaet al., 2009; ). Colour is also an important quality factor that has been widely used in automatic sorting (Blascoet al., 2009; Dobrzañski and Rybczyñski, 2002). Colour change of apple is a result of storage, shelf-life, and bruising. Non-destructive and rapid methods have been developed for detecting damaged fruits based on ultra-violet fluorescence (Slaughteret al., 2008) or hyperspectral ima-ging for detecting apple bruises (Xing and De Baerdemaeker,
2005). Blascoet al. (2003) developed an on-line machine vision system which obtained four images per fruit for auto-matic quality grading of apples, peaches and oranges. In a stu-dy by Miller and Delwiche (1989), the maturity of market peaches was evaluated by colour analysis. Their method was based on comparing peach ground colour with reference peach maturity colour to estimate the amount of blushed sur-face area. However, an accuracy of only 54% agreement with manual classification was achieved for the 160 peaches examined. Zwiggelaaret al.(1996) used spectral informa-tion and machine vision for bruise detecinforma-tion on peaches and apricots. The success rate for bruise detection was appro-ximately 65%. McClure and Morrow (1987) conducted vi-sion inspection of potatoes for size and shape. Throopet al. (2005) investigated apple surface defects. Feature extraction and pattern recognition techniques were developed by to characterize and classify carrots for forking, surface defects, curvature, and brokenness. Heinemannet al.(1996) deve-loped an automated inspection station for machine vision grading of potatoes. Batoet al.(2000) used a computer soft-ware package for arranging strawberries. In their work, Aki-hime strawberries were graded based on the shape and size, regardless of direction, with an accuracy of 98.6 and 100% in succession.
Current commercial systems classify fruits based on so-me physical paraso-meters such as size, shape, colour, or skin de-fects. However, since these machines need to work at a very high production speed, the resolution of the image must be low enough to facilitate real time analysis (Blasco et al., 2008). The low resolution of the images makes it almost im-possible to detect small skin defects. Several thresholding and classification-based techniques were employed for
Digital image processing for quality ranking of saffron peach
A. Esehaghbeygi
1*, M. Ardforoushan
2, S.A.H. Monajemi
3, and A.A. Masoumi
11Department of Farm Machinery, College of Agriculture, Isfahan University of Technology, Isfahan, 84156-83111, Iran 2
College of Agriculture, Shahrekord University, Shahrekord, 115, Iran 3
College of Engineering, Isfahan University, Isfahan, 81744, Iran
Received July 6, 2009; accepted November 27, 2009
© 2010 Institute of Agrophysics, Polish Academy of Sciences
*Corresponding author’s e-mail: [email protected]
A
A
pixel-wise segmentation of surface defects. Segmentation by supervised classifiers was the most accurate, and the ave-rage of class-specific recognition errors was more reliable than error measures based on defect size or global recogni-tion. Segmentation accuracy improved when pixels were represented as a neighbourhood (Unay and Gosselin, 2006).
Along above lines and as an improvement upon pre-vious systems, the present study was conducted:
– to determine such physical attributes as size and colour of four subclasses of Iranian saffron peach samples, – to design a machine vision system for classifying saffron
peaches according to size and colou,
– to evaluate the performance of the proposed classifier in classifying bulk peaches into desired classes.
MATERIALS AND METHODS
Samples of 120 kg of saffron peach from Shahrekord (an agricultural zone of Chaharmahal, Iran), which had been kept in storage for five days at 2°C, were selected for this study. The samples consisted of 446 ungraded peaches of the saffron variety. In order to investigate labour accuracy in classifying peaches, 186 peaches of the whole sample lot were chosen at random based on their size, and given to three people to classify them according to size. Their classifica-tion into three classes was based on the ocular accuracy and the standard of USDA. Three main diagonals of the samples were measured by a capilar with the accuracy of 0.05 mm and were placed correctly in related classes. The hardware consisted of four components, a Pentium4 system, a high-resolution CCD camera (PROLINE UK, Model 565s with 510 by 492 pixel resolution), two capture cards (WinFast DV2000 with a resolution 320Hx240V), and lighting chamber. The cameras had a CS lens mount, a focal length of 3.5-8 mm, 510x492 pixel resolutions, and provided a resolu-tion of 480 vertical TV lines. A normal ruler and colour chart were fixed in the light chamber to calibrate pixels in mm and colour quality. A black cloth covered the distance between the light chamber and the camera tripod. Data analysis software written in MATLAB Ver. 7.1 was used to correct and process the input images which had been previously
stored by the image software on the memory and had a size of 1280×960 in RGB format (ImageProcessing Toolbox, User’s guide, Mathworks,Inc.).
The data analysis software was composed of four components:
a)Image pre-analysis unit (correcting input images). Segmentation is needed to separate the peach images from the background. The easiest way was to use the threshold technique. This technique involves an operation for chang-ing a coloured image to a grey one. Then, the coloured image of the peach was changed into binary image with grey levels. In order to reduce the noise effects and eliminate the back-ground or to change an image with grey levels to a black and white frame, a low pass filter was used. This was accompli-shed by the CONV2 function in the software toolbox. The image was changed into a black and white frame after filte-ring. Figure 1 shows the colour image converted to the bi-nary image format.
b)Analysing the data on size.To calculate thecanda, minimum and maximum peach diagonals, respectively, the side view image was used to create a square or rectangular frame surrounding the sample to edge detection. Top view image was parallel to the stem-calyx axes of fruits. The be-ginning end of the image was figured out by counting the total number of black pixels at the upper end of the image up to a point where the number of black pixels would become less than the amount of the threshold. The threshold was determined through 615 trial and error iterations so that the topmost horizontal line on the image would show several non-black pixels. The same procedure was used for the two right and left boundaries of the sample image, but the amount of the threshold in this case was 455. This amount showed two right and left vertical lines in which several white pixels appeared. In order to obtain the lower boundary of the peach in the image, we counted the total number of black pixels from the centre towards the lower end. The amount of threshold was determined by 500 trial and error cycles. The result was an image surrounded by four sides to calculate the canda diagonals according to the standard minimum diagonal. To evaluate the designed edge detection
Fig. 1.Conversion of colour images to binary image format: a – colour image, b – grey scale image, c – binary image.
algorithm, 82 samples were randomly selected, theircanda diagonals measured with the capilar and the software program in a particular orientation, and classified in three different classes based on their sizes. Then, the diagonals of the same samples were measured again with the capilar and were used for their categorization. The accuracy of the program was determined by comparing the two sets of values obtained. Figure 2 shows the stages of obtaining the four boundaries of peach images.
c)Colour processing of flawless samples. The advanta-ges of the HIS model for determination of fruit and vegetable ripeness and even quality control of products colour were known in literature. In order to classify the samples accord-ing to colour, the images were examined for the three characte-ristics of hue, saturation, and luminance. The Mesh function in the MATLAB software toolbox was used to show these features. Peach samples were similar based on their colour and amplitude of hue variations. The colony of each sample category was determined and the peaches were classified into three groups according to their colours. To evaluate the proposed algorithm, 96 samples were selected and classified by human eye according to previously defined colour fea-tures of each groups. The software program then categorized the same samples based on mean hue (Table 1). Average colour colonies were measured to classify in three different colours.
d)Colour processing of stained samples.Stained pea-ches were divided into two groups, with white and brown stains, which clearly separated sound fruits from damaged ones. The variations of the three features – hue, saturation, and luminance, which had been obtained for flawless areas in the previous part, were obtained for stained areas. Using small areas on the samples, which were rotten or stained, a circle divided into 15×15 small squares was determined in each frame and examined for the three features of white stains; if more than half of the area had white stains, the whole part would be considered rotten. The same procedure was used for the brown stains, but the variations of the three-colour features in this case were different from the brown stain and the software determined the number of small rotten and stained frames.
RESULTS AND DISCUSSION
According to Table 2 (human-assessed classification of peaches) and by comparing the results from the USDA ministry of agriculture standard (Table 3), it was found that the difference between standard and average minimum dia-gonal increased with decreasing sample size. In other words, the accuracy of the classification by labour increased with decreasing sample size. Generally, the accuracy of human classification was 63%. After a number of tests, the thre-shold level was adjusted based on the difference between the maximum and minimum values of R, G, and B colours. Fig. 2.Four boundaries in peach image: a – top boundary, b – left and right boundaries, c – bottom boundary.
a b c
Class Number ofsamples correct findingNumber of finding (%)Correct
1 83 63 76
2 86 50 58
3 17 4 23
Total 186 117 63
T a b l e 2.Peaches classified by human operator
Class Minimum diameter (mm)
1 57.2 to more
2 50.8-57.2
3 47.6-50.8
T a b l e 3.USDA standard for grading peaches based on size Class Changes rang of hue average(%)
Red-yellow 14-23.9
Yellow 24-29.9
Yellow-red 30-42.0
Mendozaet al.(2006) showed that the RGB standard (linear signals) was effective in defining the mapping between R’G’B’ (non-linear signals) in agricultural foods from the CCD camera. The threshold value was normally 50 in different tests.
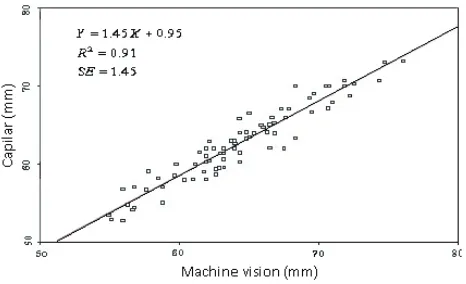
To evaluate and compare measurements by the capilar and by means of machine vision, a linear regression model was used. Figures 3 and 4 show high correlation between
sample height and side diagonals (the average of aandb dimensions) measured by the machine vision and the capi-lar. According to the standard of USDA ministry of agri-culture, 96.3% of 82 sample randomly classified by machine vision were categorized correctly. Comparison with the per-centage of correct classification by people (about 63%) reveals high separation accuracy of the machine vision unit. Although the challenge of on-line determination of dia-meters, projected area and perimeter is considered to have been over-come, on-line volume determination of irregu-larly shaped produce both at high and low speed, and ac-curate enough to allow subtle soluble solids content density-based sorting, has only become available in the past few years (Moredaet al., 2009).
It was shown that peach samples were similar based on their colour and amplitude of hue variations. The colony of each sample category was determined and the peaches were classified into three groups according to their colours, as shown in Fig. 5, as follows:
– red-yellow,the red colour was a prevailing colour in this group. About 55 to 90% of the peach surface was red while the rest was yellow;
– yellow-red,the yellow colour was a prevailing colour in this group. More than half of the peach surface in the image was yellow while the rest was red (55 to 80% of peach surface was yellow;
– yellow, the image appeared completely yellow in this group and the rest was pink. More than 95% of the peach surface was yellow.
To obtain an average hue for the images of the samples, the circular shape of the peaches was assumed to be octagonal. A total of 118 peach samples were selected for which the average hue was measured. Yellowness of the peaches increased with increasing hue (Table 3). According to Table 4, the correct distinction limit for the red-yellow class was 96.87%, for the yellow-red 90.62%, and for the yellow class 81.25%. Assuming an eight-sided geometry for the samples, which causes variations in the average sample colony, a non-steady colour distribution of the samples in colony will lead to errors. Mendozaet al.(2006) stated that the measured average colour was shown to be significantly affected by the properties of the background and by the surface curvature and gloss. Thus all average colour results Fig. 3. Side measurement of diameter with the capilar and by
means of machine vision.
Fig. 4.Height measurement with the capilar and by means of machine vision.
Fig. 5.Peach classifications a) red-yellow, b) yellow-red, and c) yellow.
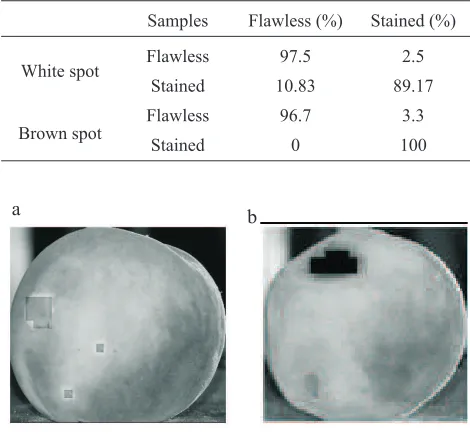
should be interpreted with caution. Lab system is suggested as the best colour space for quantification in foods with curved surfaces. The developed software performed correctly at 85% accuracy levels and distinguished the flawless peaches from the stained ones, white and brown stains, correctly based on flawless colour image characteristic domains. This can be easily explained by the fact that the colour and the size of stained peaches were normally very different and thus easy to distinguish. The success rate for bruise detection in Zwiggelaaret al.(1996) research was approximately 65%. In addition, the correct classification rate for sound apples was reported as 84.6 and 77.5% for 1-day-old bruises (Xing and De Baerdemaeker, 2005) and classification accuracy of 87.9% was obtained for unfrozen oranges based on ultraviolet (UV) fluorescence. According to Table 5, the software distinction of black stains was more satisfactory than its distinction of white stains. Figure 6 shows two stains in a peach distinguished by the software, in which both rotten areas are composed of 12 small squares with 15×15 pixels. The percentage of rottenness was determined by dividing the rotten area by the total peach surface area.
CONCLUSIONS
1. An algorithm of size estimation showed promising results with an accuracy level of 96.3% compared to human labour with an accuracy of 63%. The precision and repea-tability of the system was found to be better than those of manual grading.
2. The colour-grading scheme divided the peaches into three colour groups of red-yellow, yellow-red, and yellow. The colours of the peaches estimated by the system were well correlated with the colorimetric index values that are currently used in the USDA standard.
3. The defect detection rate was 96.7% of correctly dis-tinguishing the flawless ones among the white patched pea-ches, and 85% for the brown patched peaches.
4. Regarding the overall advantages of the proposed system compared to the human operator, the implementation of such a system would be advisable to guarantee a cheaper and more consistent and flexible quality ranking for the saffron peach. The main reason for the prevalence of two dimensional machine vision systems over other systems is that they allow classification of fruits according to their surface colour and external defects.
REFERENCES
Bato P.M., Nagata M., Cao Q.X., Hiyoshi K., and Kitahara T., 2000.Study on sorting system for strawberry using machine vision: development of sorting system with direction and judgment functions for strawberry (Akihime variety). J. Japanese Soc. Agric. Mach., 62(2), 101-110.
Blasco J., Aleixos N., and Molto E., 2003.Machine vision system for automatic quality grading of fruit. Biosyst. Eng., 85(4), 415-423.
Blasco J., Cubero Garcia S., Alegre Sosa S., Gomez Sanches J., Lopez Rubira V., and Molto E., 2008.Automatic inspection of the pomegranate (Punica granatumL.) arils quality by means of computer vision. Spanish J. Agric. Eng., 6(1), 12-16.
Blasco J., Cubero Garcia S., Gomez-Sanches J., Mira P., and Molto E., 2009.Development of a machine for the auto-matic sorting of pomegranate (Punica granatum) arils based on computer vision. J. Food Eng., 90, 27-34.
Brosnan T. and Sun D.W., 2002.Inspection and grading of agri-cultural and food products by computer vision systems. Comput. Electron. Agric., 36, 193-213.
Dobrzañski B. and Rybczyñski R., 2002.Colour change of apple as a result of storage, shelf-life, and bruising. Int. Agro-physics 16, 261-268.
Du C.J. and Sun D.W., 2004.Recent developments in the ap-plications of image processing techniques for food quality evaluation. Trends Food Sci. Technol., 15(5), 230-249.
Heinemann P.H., Pathare N.P., and Morrow C.T., 1996.An auto-mated inspection station for machine vision grading of potato. Mach. Vision Appl., 9, 14-19.
Khojastehnazhand M., Omid M., and Tabatabaeefa A., 2009. Determination of orange volume and surface area using ima-ge processing technique. Int. Agrophysics, 23, 237-242. Class Red-yellow Yellow-red Yellow
Red-yellow 31 1 0
Yellow 4 2 26
Yellow-red 3 29 0
T a b l e 4.System performance in colour grading
Samples Flawless (%) Stained (%)
White spot Flawless 97.5 2.5
Stained 10.83 89.17
Brown spot
Flawless 96.7 3.3
Stained 0 100
T a b l e 5.Peach groups graded using the software
Fig. 6.Two samples of stained peaches: a – white patch, b – brown patch.
McClure J.E. and Morrow C.T., 1987.Computer vision sorting of potatoes. ASAE Paper, No. 87-6501, Madison, WI, USA. Mendoza F., Dejmek P., and Aguilera J.M., 2006.Calibrated
color measurements of agricultural foods using image analysis. Postharvest Biol. Technol., 41(3), 285-295. Miller B.K. and Delwich M.J., 1989.Color vision system for
peach grading. Trans. ASAE, 32(4), 1484-1490.
Moreda G.P., Ortiz-Cañavate J., Garcia-Ramos F.J., and Ruiz-Altisent M., 2009.Non-destructive technologies for fruit and vegetable size determination. J. Food Eng., 92, 119-136. Slaughter D.C., Obenland D.M., Thompson J.F., Arpaia M.L., and Margosan D.A., 2008.Non-destructive freeze damage detection in oranges using machine vision and ultraviolet fluorescence. Postharvest Biol. Technol., 48(3), 341-346.
Throop J.A., Aneshansley D.J., Anger W.C., and Peterson D.L., 2005.Quality evaluation of apples based on surface defects: development of an automated inspection system. Postharv. Biol. Technol., 36(3), 281-290.
Unay D. and Gosselin B., 2006.Automatic defect segmentation of Jonagold apples on multi-spectral images: A comparative study. Postharvest Biol. Technol., 42(3), 271-279. Xing J. and De Baerdemaeker J., 2005. Bruise detection on
Jonagold apples using hyperspectral imaging. Postharvest Biol. Technol., 37(2), 152-162.