RESEARCH NOTE
MODELING OF COMPRESSIVE STRENGTH OF METAKAOLIN
BASED GEOPOLYMERS BY THE USE OF ARTIFICIAL
NEURAL NETWORK
Amir Kamalloo, Yadolah Ganjkhanlou, Seyed Hamed Aboutalebi and Hossein Nouranian*
Materials and Energy Research Center, P.O. Box 14155-4777, Tehran, Iran
[email protected],[email protected],[email protected],[email protected]
*Corresponding Author
(Received: December 19, 2009 – Accepted: July 15, 2010)
Abstract In order to study the effect of R2O/Al2O3 (where R=Na or K), SiO2/Al2O3, Na2O/K2O and H2O/R2O molar ratios on the compressive strength (CS) of Metakaolin base geopolymers, more than forty data were gathered from literature. To increase the number of data, some experiments were also designed. The resulted data were utilized to train and test the three layer artificial neural network (ANN). Bayesian regularization method and Early Stopping methods with back propagation algorithm were applied as training algorithm. Good validation for CS was resulted due to the inhibition of overfitting problems with the applied training algorithm. The results showed that optimized condition of SiO2/Al2O3, R2O/Al2O3, Na2O/K2O and H2O/R2O ratios to achieve high CS should be 3.6-3.8, 1.0-1.2, 0.6-1 and 10-11, respectively. These results are in agreement with probable mechanism of geopolymerization.
Keywords Artificial Neural Network, Overfitting, Geopolymer, Compressive Strength, Metakaolin
ﻩﺪﻴﮑﭼ
ﻲﻟﻮـﻣﻱﺎﻬﺘﺒـﺴﻧﺮـﺛﺍﻪﻌﻟﺎﻄﻣﻑﺪﻫﺎﺑ
R2O/Al2O3
) ﻪـﮐ R = Na ﺎـﻳ K ( ،
SiO2/Al2O3 ،
Na2O/K2O ﻭ
H2O/R2O ﺯﺍﺶﻴﺑﻦﻟﻮﺋﺎﮐﺎﺘﻣﻪﻳﺎﭘﻱﺎﻫﺮﻤﻴﻠﭘﻮﺋﮊﻱﺭﺎﺸﻓﻡﺎﮑﺤﺘﺳﺍﻱﻭﺭﺮﺑ
۴۰ ﺪﺷﻱﺭﻭﺁﻊﻤﺟﻩﺩﺍﺩ
.
ﻱﺍﺮﺑﻦﻴﻨﭽﻤﻫ
ﻩﺩﺍﺩﺶﻳﺍﺰﻓﺍ ﺪﻳﺩﺮﮔﻲﺣﺍﺮﻃﺪﻳﺪﺟﺕﺎﺸﻳﺎﻣﺯﺁﻱﺩﺍﺪﻌﺗﺎﻫ
.
ﻩﺩﺍﺩ ﺑﻩﺪﻣﺁﺖﺳﺪﺑﻱﺎﻫ ﻪﮑﺒﺷﮏﻳﺶﻳﺎﻣﺯﺁﻭﺵﺯﻮﻣﺁﻱﺍﺮ
۳ ﻪﻳﻻ ﺪﺷﻩﺩﺎﻔﺘﺳﺍﻱﺍ
. ﻩﺩﺎﻔﺘـﺳﺍﺵﺯﻮـﻣﺁﺵﻭﺭﻥﺍﻮـﻨﻋﻪـﺑﺭﺎﺸﺘﻧﺍﺲﭘﮏﻴﻨﮑﺗﺎﺑﺮﺗﺩﻭﺯﻒﻗﻮﺗﻭﻱﺰﻴﺑﻡﺎﻈﺘﻧﺍﺵﻭﺭ
ﺪﻳﺩﺮﮔ
.
ﺶﻴـﭘﺮﻃﺎﺨﺑﻲﺑﺮﺠﺗﻭﻩﺪﺷﻲﻨﻴﺑﺶﻴﭘﻱﺭﺎﺸﻓﻡﺎﮑﺤﺘﺳﺍﻦﻴﺑﻲﺑﻮﺧﻖﻓﺍﻮﺗ
ﻂـﺳﻮﺗﺵﺯﺍﺮـﺑﺶﻴـﺑﺯﺍﻱﺮـﻴﮔ
ﺪـﺷﻞـﺻﺎﺣﻩﺪﺷﻩﺩﺮﺑﺭﺎﮑﺑﺵﺯﻮﻣﺁﺵﻭﺭ
.
ﺎـﺸﻧﺞﻳﺎـﺘﻧ
ﻲﻟﻮـﻣﻱﺎﻬﺘﺒـﺴﻧﻪـﻨﻴﻬﺑﻂﻳﺍﺮـﺷﻪـﮐﺩﺍﺩﻥ
SiO2/Al2O3 ،
R2O/Al2O3 ،
Na2O/K2O ﻭ
H2O/R2O
ﺎـﺑﺮـﺑﺍﺮﺑﻪﻨﻴﻬﺑﻱﺭﺎﺸﻓﻡﺎﮑﺤﺘﺳﺍﻪﺑﻲﺑﺎﻴﺘﺳﺩﻱﺍﺮﺑ ۸ / ۳ -۶ / ۳ ، ۲ / ۱ -۰ / ۱ ، ۱ -۶ / ۰ ﻭ ۱۱ -۱۰ ﻲﻣﺐﻴﺗﺮﺗﻪﺑ ﺪﻨﺷﺎﺑ
.
ﺩﺭﺍﺩﻲﻧﺍﻮﺨﻤﻫﻥﻮﻴﺳﺍﺰﻳﺮﻤﻴﻠﭘﻮﺋﮊﻞﻤﺘﺤﻣﺭﺎﮐﻭﺯﺎﺳﺎﺑﺞﻳﺎﺘﻧﻦﻳﺍ
.
1. INTRODUCTION
The reaction of reactive aluminasilicates such as metakaolin and fly ash with highly concentrated alkali hydroxide or silicate solution produces a kind of amorphous aluminasilicate which was first discovered by Chelokovski in 1950 and then called geopolymer after Davidovites [1]. This material exhibits good properties such as high compressive strength, low shrinkage, designable setting time, acid resistance, fire resistance and low thermal conductivity which are comparable with traditional cement and therefore makes it a good candidate to
replace traditional cement in order to reduce greenhouse emissions. Another attractive application of geopolymers is encapsulation of hazardous and toxic heavy metals (such as Cu, Cr and W ion) and nuclear waste [1,2].
address the effect of compositional parameters on the mechanical properties of geopolymers. Some of these parameters are as follows; R2O/Al2O3, SiO2/Al2O3, Na2O/K2O and H2O/R2O. The effects of these parameters are investigated thoroughly and extensively throughout this paper. Although there are many researches regarding the effect of these parameters [5-8], the combined effect of the above parameters on mechanical properties has not been thoroughly investigated, yet.
Recently some researchers have used ANN for the prediction of mechanical properties of construction materials such as concrete and their properties [9-14]. At present, there is no literature regarding using ANN to predict geopolymers properties. However, it is expected that by implementing ANN, the number of experiments to investigate the effect of chief parameters on mechanical properties can be reduced. So, the input effective parameters can be changed parallel to each other and then the obtained data can be used to train and test the ANN.
Currently many researchers implement ANN to predict various nonlinear relations among experiment parameters, optimization, classification, control, etc [11, 14-20]. For optimization, the first step involves designing the network and then the selection of initial weights and biases and finally using the best algorithm to change weights and biases during the learning process to find the best weights and biases in order to produce desirable outputs from the input pattern [9, 14, 15, 17]. Most researchers prefer feed forward ANN and use back-propagation method for training method [11, 21]. In this method, in every interval, output is computed from the input pattern with current weights and biases and in the second step weights and biases are altered with a backward algorithm.
Conventional algorithms used in back propagation method are gradient descent, conjugate gradient descent, quasi-Newton method, Gradient Descent with Momentum, resilient propagation, variable learning rate back-propagation, Levenberg-Marquardt method [15]. In all the above algorithms, the performance functions (usually mean square error or sum square error) are selected and then, by changing the weights and biases step to step and numerically, performance functions are minimized.
Generalization of the network and selection of learning algorithm are based on the input data. Every selected algorithm has some advantages and disadvantages. So, choosing a suitable algorithm usually has no special discipline and comes with experience. One of the best training algorithm, having a fast rate of convergence (but more use of memory), is Levenberg-Marquardt method in which A Hessian matrix (second derivative) is approximated instead of calculating the whole Hessian matrix. Therefore, the rate of convergence in order to come to the desirable network is increased.
H=JTJ, g=JTe, X
k+1=Xk-[H+μI]-1g (1) Here J is the Jacobian matrix containing the first derivatives of the network errors with respect to the weights and biases, X is weight or bias, g represents the gradient of performance function, e is error (true output-network output), I is Identity Matrix, JT is the transposed matrix of J, H is the Hessian matrix and the µ is a scalar value between 0 to 1 [22-25].
One of the problems that occur during ANN training is called overfitting. The error on the training set is driven to a very small value, but when new data is presented to the network the error is large. The network has memorized the training examples, but it has not learned to generalize to new situations. The best way to avoid overfitting is to use lots of training data [11, 15, 26]. But this is impossible in some case due to increasing time and cost of experiments. Another most important method’s for improving network generalization and avoid overfitting are, Model selection, Jittering, Early stopping, Weight decay, Bayesian learning [27] and Combining networks. In this work we used combined of Bayesian learning and Early-Stopping to avoid the overfitting. Bayesian learning resembles to the Levenberg-Marquardt method and differs only in the performance function [15].
2. EXPERIMENT
literatures [28, 29]. In addition, for increasing the number of data, some other experiments were designed. WBB Kaolin was employed as starting material and was calcinated to produce metakaolin. Kaolin calcination was conducted at 750 °C and for 4 hours. Table 1 shows wet chemical analysis and composition of kaolin used for synthesis of the geopolymer. The Surface area of metakaolin was 15 m2/g.
Table 1. Composition of WBB kaolin (wt%) SiO2 Al2O3 Na2O+K2O Fe2O3 TiO2 L.O.I 48.8 35.4 3 0.8 <0.1 11.6
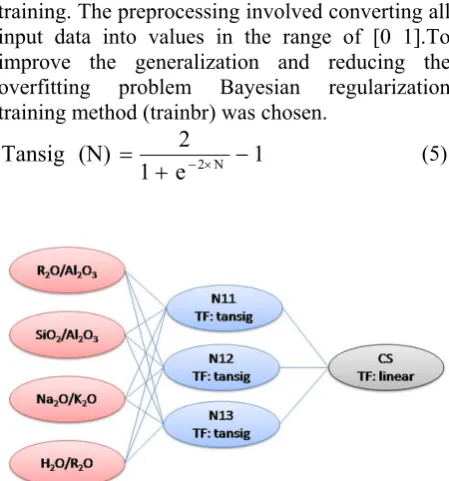
Activated solution consisted of analytical grade sodium silicate solution, micro silica and analytical grade sodium hydroxide were utilized in order to control Na2O/Al2O3, SiO2/Al2O3 and H2O/Na2O ratios in the final product. Sodium silicate was first prepared by using initial sodium silicate, micro silica and sodium hydroxide to obtain the desired ratio of Na2O/SiO2 and H2O, then metakaolin powder was added to the solution and mixed for 10 minutes. Then it was poured into Φ25mm×50mm polyethylene molds and sealed to protect the samples from excessive water loss. Curing regime consisted of heating at 70 °C for 4 hours in dry atmosphere and then keeping in ambient condition for 7 days. CS measurements were performed using ASTM C39-36 standard for CS. Finally, 54 data were gathered in order to get sufficient input data to train and test the ANN and thus investigating the effect of R2O/Al2O3, SiO2/Al2O3, Na2O/K2O and H2O/R2O molar ratios on CS. 45 data were used for training and 9 data were employed to investigate the generalization of ANN (Table 2 and 3). The data haphazardly separated to test and train in order to prevent from probable error. Three layered feed forward ANN was employed for the training. The network was trained utilizing the back propagation algorithm. The numbers of neurons in hidden layer and in the output layer were 3 and 1, respectively. The input pattern consisted of R2O/Al2O3, SiO2/Al2O3, Na2O/K2O and H2O/R2O ratios and the output data consisted of CS. (Figure 1) tan-sigmoid (tansig) function (Equation 2) was selected as the hidden layers transfer function and the linear function was selected for output layer transfer function due to their ability to learn complex nonlinear relation
between input patterns and output data.
After gathering the data it should be preprocessed to increase the efficiency of the ANN training. The preprocessing involved converting all input data into values in the range of [0 1].To improve the generalization and reducing the overfitting problem Bayesian regularization training method (trainbr) was chosen.
1 e
1 2 (N)
Tansig 2 N
(5)
3. RESULTS AND DISCUSSION
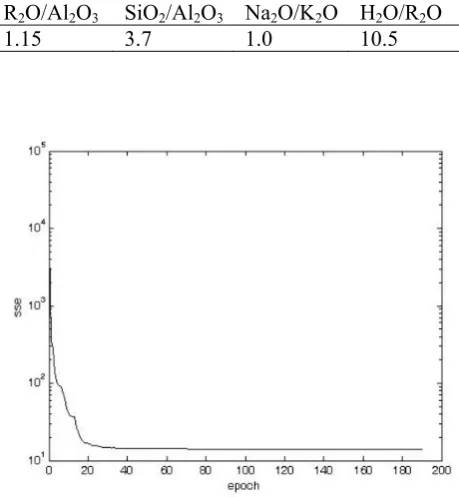
Figure 2 shows the reduction of sum of squared error (SSE) along the training interval. It can be seen that SSE at last converge to 13.79, in this point the ANN was stopped for inhibit the over fitting problems.
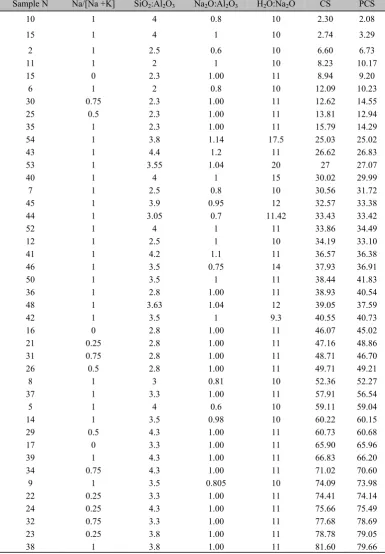
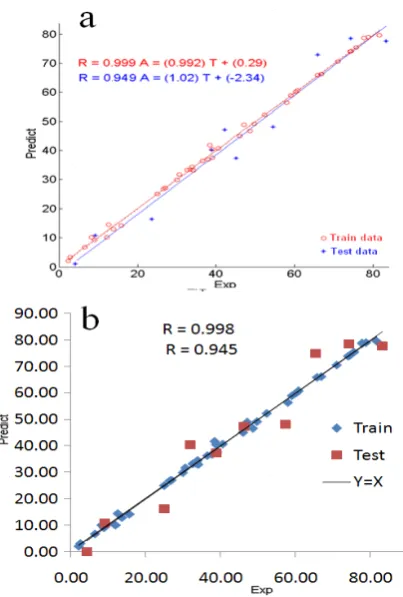
Figure 3a shows the generalization of the trained ANN in training and tested point and also shows the best linear fit for the data. The calculated R values by comparing data with y=x line were also presented in Figure 3b. With respect to the obtained results, it can be concluded that the predicted values of ANN for CS shows good correlation (R Value) with the real experimental values for both training data and test data. Also from Figure 3, Table 2 and 3, it can be seen that the error of data for both train and test data have Normal Distribution. Some uncertainty can be seen for the test data. This uncertainty can be related to wide distribution of comprehensive strength of ceramics.
Table 2. Train data besides predicted value of compressive strength (PCS) of geopolymer samples.
Sample N Na/[Na +K] SiO2:Al2O3 Na2O:Al2O3 H2O:Na2O CS PCS
10 1 4 0.8 10 2.30 2.08
15 1 4 1 10 2.74 3.29
2 1 2.5 0.6 10 6.60 6.73
11 1 2 1 10 8.23 10.17
15 0 2.3 1.00 11 8.94 9.20
6 1 2 0.8 10 12.09 10.23
30 0.75 2.3 1.00 11 12.62 14.55
25 0.5 2.3 1.00 11 13.81 12.94
35 1 2.3 1.00 11 15.79 14.29
54 1 3.8 1.14 17.5 25.03 25.02
43 1 4.4 1.2 11 26.62 26.83
53 1 3.55 1.04 20 27 27.07
40 1 4 1 15 30.02 29.99
7 1 2.5 0.8 10 30.56 31.72
45 1 3.9 0.95 12 32.57 33.38
44 1 3.05 0.7 11.42 33.43 33.42
52 1 4 1 11 33.86 34.49
12 1 2.5 1 10 34.19 33.10
41 1 4.2 1.1 11 36.57 36.38
46 1 3.5 0.75 14 37.93 36.91
50 1 3.5 1 11 38.44 41.83
36 1 2.8 1.00 11 38.93 40.54
48 1 3.63 1.04 12 39.05 37.59
42 1 3.5 1 9.3 40.55 40.73
16 0 2.8 1.00 11 46.07 45.02
21 0.25 2.8 1.00 11 47.16 48.86
31 0.75 2.8 1.00 11 48.71 46.70
26 0.5 2.8 1.00 11 49.71 49.21
8 1 3 0.81 10 52.36 52.27
37 1 3.3 1.00 11 57.91 56.54
5 1 4 0.6 10 59.11 59.04
14 1 3.5 0.98 10 60.22 60.15
29 0.5 4.3 1.00 11 60.73 60.68
17 0 3.3 1.00 11 65.90 65.96
39 1 4.3 1.00 11 66.83 66.20
34 0.75 4.3 1.00 11 71.02 70.60
9 1 3.5 0.805 10 74.09 73.98
22 0.25 3.3 1.00 11 74.41 74.14
24 0.25 4.3 1.00 11 75.66 75.49
32 0.75 3.3 1.00 11 77.68 78.69
23 0.25 3.8 1.00 11 78.78 79.05
Filled Contours which are shown in Figure 4, show the effects of R2O/Al2O3, SiO2/Al2O3, Na2O/K2O and H2O/R2O ratios on comprehensive strength of the geopolymers. Each on of the contours shows the effect of two molar ratios on CS. All of the contours were plotted in optimum value of other parameters (Table 4). By the employment of these contours, the effect of input parameters of ANN on CS can be predicted.
Table 4. Optimum value of R2O/Al2O3, SiO2/Al2O3, Na2O/K2O and H2O/R2O molar ratios for plotting Figure 4 contours.
R2O/Al2O3 SiO2/Al2O3 Na2O/K2O H2O/R2O 1.15 3.7 1.0 10.5
3. 1. Effect of SiO2/Al2O3 on Compressive
Strength
Figures 4a and 4b show the effects of SiO2/Al2O3 and H2O/Na2O and the effects of SiO2/Al2O3 and H2O/R2O ratios on CS of samples, respectively. It can be seen that optimum value of SiO2/Al2O3 is about 3.6-3.8 in optimum ratios of other parameter. This behavior is in consistent with the general behavior of CS of geopolymers, reported in literature [29, 30]. Most researchers believe that with increasing SiO2/Al2O3 ratio, polysialatesiloxo and polysialatedisiloxo structures become dominant [29, 30]. Because of more strength and stiffness of these structures in compare with polysialate structures, which are present in low SiO2/Al2O3 ratios, the CS is higher with increasing SiO2/Al2O3 ratio. On the other hand solubility of metakaolin and gel formation decreases with increasing the SiO2/Al2O3 ratio, therefore the CS of geopolymers tends to decrease in high SiO2/Al2O3 ratios. In low SiO2/Al2O3 ratios (<3.6), existence of coarse voids, compared with finely distributed voids in high SiO2/Al2O3 ratios (>3.8), is another reason for low CS of the samples in that ratios. Superposition of theses parameters affects the CS of geopolymers and makes an optimum range for CS of geopolymers with respect to SiO2/Al2O3 ratios.
3. 2. Effect of R2O/Al2O3 on Compressive
Strength
Figures 4a and 4d show the effect of R2O/Al2O3 and SiO2/Al2O3 molar ratios and the effects of H2O/R2O and R2O/Al2O3 ratios on CS in optimum
Table 3. Test data besides predicted value of compressive strength (PCS) of geopolymer samples.
Sample N Na/[Na +K] SiO2:Al2O3 Na2O:Al2O3 H2O:Na2O CS PCS
1 1 2 0.6 10 4.30 0.10
20 0.25 2.3 1.00 11 9.11 10.97
49 1 4.5 1.57 10.3 24.95 16.37
47 1 4.01 1.16 13.1 31.98 40.23
51 1 3.275 0.85 10.58 38.83 37.43
3 1 3 0.6 10 46.28 47.25
4 1 3.5 0.595 10 57.26 48.20
19 0 4.3 1.00 11 65.31 73.00
27 0.5 3.3 1.00 11 74.33 78.55
18 0 3.8 1.00 11 83.22 77.69
Figure 4. (a) Filled contours plot of CS that shows the effect of R2O/Al2O3, SiO2/Al2O3, Na2O/K2O and H2O/R2O ratios on CS. The contours are in units of MPa.
amount of other parameters. It can be seen that the optimum values of R2O/Al2O3 ratio are around 1-1.2. This result is in consistent with theoretical and experimental principles of geopolymer formation mechanisms. R+ cations play the role of negative charge balancer and hence network stabilizer. This negative charge comes from four fold coordination of Al3+ in tetrahedral sites. Due to the fact that some R+ cations are consumed to form R
2CO3, in low R2O/Al2O3 ratios, the amount of R+ cations is not sufficient to balance the negative charges, so the geopolymer structure becomes distorted and unstabilized. Thus the optimum value of R2O/Al2O3 ratio is 1-1.2.
3. 3. Effect of H2O/R2O on Compressive
Strength
Figures 4b and 4d show the effect of H2O/R2O and R2O/Al2O3 molar ratios and the effect of H2O/R2O
and SiO2/Al2O3 molar ratios on CS. From these figures it could be obtained that optimum value of H2O/R2O ratio is about 10-11 to achieve high CS. In high H2O/R2O ratios the amount of OH- groups are high. Thus the amount of porosity tends to increase after condensation and this phenomenon decreases the compressive strength of geopolymer. On the other hand, water provides the suitable media for geopolymerizasion reaction and in low level of H2O/R2O ratios the rate of geopolymerizasion reaction is low. Therefore, CS of geopolymer is decreased in low level of H2O/R2O ratios. Superposition of these mechanism make an optimum value of CS in H2O/R2O=10-11.
3. 4. Effect of K2O/Na2O on Compressive
Strength
Figure 4c shows the effect of Na2O/ K2O and SiO2/Al2O3 effects on the Comprehensive strength of geopolymer. It can be seen from this figure that in lower SiO2/Al2O3 molar ratios, optimum value of Na2O/ K2O ratio is about 1, whereas in higher ratios of SiO2/Al2O3 the optimum value was decreased up to 0.6. These results are in consistent with the results Duxson et al [29] work. They believed that K+ ion is more active than Na+ ion and potassium is preferentially incorporated into geopolymeric gels during formation. Therefore, in lower amount of SiO2/Al2O3 molar ratios, sample containing potassium has lower levels of SiO2/Al2O3 ordering and hence, has lower strength. This phenomenon was called Mixed Alkali Effect in geopolymer by Duxson [29].
4. CONCLUSION
For the purpose of studying the effect of the SiO2/Al2O3, R2O/Al2O3, Na2O/K2O and H2O/R2O molar ratios on the compressive strength of geopolymers more than forty data were gathered from literatures and for increasing the number of data some experiments were also designed. Then, the resulted data were applied for training and testing the ANN. In sum, following conclusions can be drawn from the proposed model:
1. ANN is a practical tool for modeling and optimization of the mechanical properties of geopolymers.
2. Optimized SiO2/Al2O3, R2O/ Al2O3, Na2O/K2O and H2O/R2O ratios were determined to be 3.6-3.8, 1.0-1.2, 0.6-1 and 10-11, respectively.
3. Bayesian regularization method in combination with early stopping of network during training can inhibit the overfitting problem better than the Bayesian regularization or early stopping alone. 4. The optimized value for the compressive strength (optimized for the defined synthesis method in this work) is approximately about 80 MPa.
5. ACKNOWLEDGMENTS
This research has been supported by Materials and Energy Research Center with project No: 328606.
6. REFERENCES
1. Davidovits, J., "Geopolymers: inorganic polymeric new materials". Journal of Thermal Analysis, Vol. 37 (1991), 1633-1656.
2. Davidovits, J., "Properties of geopolymer cements". First International Conference on Alkaline Cements concretes, Kiev, Ukrain, ; 1994.
3. Komnitsas, K., Zaharaki, D., "Geopolymerisation: A review and prospects for the minerals industry ". Minerals Engineering, Vol. 20, (2007), 1261-1277. 4. Duxson, P., Fernandez-Jimenez, A., Provis, J. L.,
Luckey, G. C., Palomo, A., Deventer, J. S. J. V., "Geopolymer technology: the current state of the art". Journal of Materials Science, Vol. 42, (2007), 2917-2933.
5. Barbosa, V. F. F., MacKenzie, K. J. D., Thaumaturgo, C., "Synthesis and characterization of materials based on inorganic polymers of alumina and silica: sodium polysialate polymers". International Journal of Inorganic Materials, Vol. 2, (2000), 309-317.
6. Duxson, P., Provis, J., Lukey, G. C., Mallicoat, S. W., Kriven, W. M., Deventer, J. S. J. V., "Understanding the relationship between geopolymer composition, microstructure and mechanical properties". Colloids and Surfaces A: Eng Aspects, Vol. 269, (2005), 47-58. 7. Rowels, M., O’Connor, B., "Chemical optimization of
the compressive strength of aluminosilicate geopolymers synthesized by sodium silicate activation of metakaolinite". journal of Materials Chemistry, Vol. 13, (2003), 1161-1165.
(2007), 512-518.
9. Bai, J., Wild, S., Ware, J. A., Sabir, B. B., "Using neural networks to predict workability of concrete incorporating metakaolin and fly ash". Advances in Engineering Software, Vol. 34, (2003), 663-669. 10. Lai, S., Serra, M., "Concrete strength prediction by
means of neural network". Construction and Building Materials, Vol. 11, (1997), 93-98.
11. Mandal, A., Roy, P., "Modeling the compressive strength of molasses-cement sand system using design of experiments and back propagation neural network".
Journal of Materials Processing Technology, Vol.
180, (2006), 167-173.
12. Sebastia, M., Fernandez Olmo, I., Irabien, A., "Neural network prediction of unconfined compressive strength of coal fly ash-cement mixtures". Cement and Concrete Research, Vol. 33, (2003), 1137-1146. 13. Stegemann, J. A., Buenfeld, N. R., "Prediction of
unconfined compressive strength of cement paste with pure metal compound additions". Cement and Concrete Research, Vol. 32, (2002), 903-913.
14. Topcu, I. B., Saridemir, M., "Prediction of compressive strength of concrete containing fly ash using artificial neural networks and fuzzy logic". Computational Materials Science, Vol. 41, (2008), 305-311.
15. MATLAB Release 12, The Math Work Inc., Natick, MA, USA.
16. Yeh, I. C., "Modeling of strength of high-performance concrete using artificial neural networks". Cement and Concrete Research, Vol. 28, (1998), 1797-1808. 17. Topalov, A. V., Kaynak, O., "Neural network modeling
and control of cement mills using a variable structure systems theory based on-line learning mechanism". Journal of Process Control, Vol. 14, (2004), 581-589. 18. Arabani, M., "Evalution of rough set theory for decision
making of rehabilitation method for concrete pavement". International Journal of Engineering Vol. 18 (2005), 1-10.
19. Goel, A., "ANN based modeling for prediction of evaporation in reservoirs". International Journal of Engineering, Vol. 22, (2009), 351-358.
20. Saghatoleslam, N., Karimi, H., Rahimi, R., Shirazi, H. H. A., "Modeling of texture and color froth characterization for evalution of flotation performance in Sarcheshmeh copper pilot plant using image analysis
and Neural Network". International Journal of Engineering Vol. 17, (2004), 121-130.
21. Bayar, S., Demir, I., Engin, G. O., "Modeling leaching behavior of solidified wastes using back-propagation neural networks". Ecotoxicology and Environmental Safety, Vol. In Press, Corrected Proof), 311.
22. "Hagan, M. T., Demuth, H. B., Beale, M. H., “Neural network design”, PWS Publishing, Boston, (1996)." Vol.).
23. Heiermann, K., Riesch-Oppermann, H., Huber, N., " Reliability confidence intervals for ceramic components as obtained from bootstrap methods and neural networks". Computational Materials Science, Vol. 34, (2005), 1-13.
24. Scott, D. J., Coveney, P. V., Kilner, J. A., Rossiny, J. C. H., Alfor, N. M. N., "Prediction of the functional properties of ceramic materials from composition using artificial neural networks". Journal of the European Ceramic Society, Vol. 27, (2007), 4425- 4435.
25. Koker, R., Altinkok, N., Demir, A., "Neural network based prediction of mechanical properties of particulate reinforced metal matrix composites using various training algorithms". Materials and Design, Vol. 26, (2005), 305-311.
26. Yang, Y. Y., Linkens, D. A., Talamantes, S. J., " Roll load prediction—data collection, analysis and neural network modeling". Journal of Materials Processing Technology, Vol. 152, (2004), 304-315.
27. MacKay, D. J. C., “Bayesian methods for adaptive models, California Institute of Technology”, PhD. dissertation, Pasadena, California, (1992).
28. Subaer, Riessen, A. V., "Thermo-mechanical and microstructural characterisation of sodium-poly(sialate-siloxo) (Na-PSS) geopolymers". J Mater Sci, Vol. 42, (2007), 3117-3123.
29. Duxson, P., Mallicoat, S. W., Lukey, G. C., Kriven, W. M., Deventer, J. S. J. v., "The effect of alkali and Si/Al ratio on the development of mechanical properties of metakaolin-based geopolymers". Colloids and
Surfaces A: Physicochem Eng Aspects Vol. 292,
(2007), 8-20.
30. Wang, H., Li, H., Yan, F., "Synthesis and mechanical properties of metakaolinite-based Geopolymer".
Colloids and Surfaces A: Eng Aspects, Vol. 268,