NFECTIOUS DISEASES
-
--- f:]INFECTIOUS DISEASE NOTIFICATIONS FOR 1994 FOR NOTIFICATIONS RECEIVED BY MARCH 30. 1994 BY MONTH OF ONSET
Condition Month
Jan Feb Mar Total
Adverse event
after imrnunisation 2 4 - 6
AIDS 27 16 15 58
Arboviral infection 22 61 34 117
Foodborne illness (NOS) 13 3 1 17
Gastroenteritis (instit,) 1 11 3 15
Gonorrhoea 33 25 8 66
H influenzae epiglottitis 2 1 4 7
H influenzae meningitis 1 - 1 2
H influenzae septicaemia 1 1 - 2
H influenzae infection (NOS) 2 1 - 3
HepatitisA-acuteviral 48 44 21 113
Hepatitis B - acute viral 7 6 1 14
Hepatitis B - unspecified 302 276 111 689
Hepatitis C - acute viral 1 - - 1
HepatitisC-unspecified 553 645 223 1,421
Hepatitis D - unspecified 1 2 - 3
Hepatitis - acute viral (NOS) 1 1 - 2
HIV infection 25 43 27 95
Hydatid disease - 1 1 2
Legionnaires' disease 3 4 1 8
Leptospirosis 1 2 - 3
Listeriosis 2 2 - 4
Malaria 5 8 4 17
Measles 147 63 21 231
Meningococcal meningitis 5 3 4 12
Meningococcal septicaemia 1 1 2 4
Meningococcal infection (NOS 1 - - 1
Mumps 1 - - 1
Mycobacterial atypical 13 3 - 16
Mycobacterial tuberculosi5 24 9 7 40
Mycobacterial infection (NOS) 12 10 3 25
Pertussis 165 116 40 321
Qfever 20 12 4 36
Rubella 8 6 - 14
Rubella - congenital - 1 - 1
Salmonella bovis morbificans 1 3 - 4
Salmonella typhimurium 4] 48 9 104
Salmonella (NOS) 58 69 40 167
Syphilis 82 71 33 186
Typhoid and paratyphoid 1 3 - 4
Total 1,639 1,575 618 3,832
f:] I.
SUMMARY OF NSW INFECTIOUS DISEASE NOTIFICATIONS MARCH 1994
Condition Number of cases notified
Period Cumulative
March March March March 1993 1994 1993 1994
Adverse reaction 2 - 5 6
AiDS 40 15 113 58
Arboviral infection 163 34 469 117
Brucellosis - - -
-Cholera - - -
-Diphtheria - - -
-Foodborne illness (NOS) 20 1 32 17
Gastroenteritis (instit.) 3 3 39 15
Gonorrhoea 44 8 104 66
H influenzae epiglottitis 4 4 9 7
H influenzae B - meningitis 7 1 17 2
H influenzae B - septicaemia 4 - 8 2
H influenzae infection (NOS) 3 - 6 3
HepatitisA 49 21 177 113
Hepatitis 9 359 112 937 702
Hepatitis C 513 223 1,319 1422
HepatitisD 1 - 1 3
Hepatitis, acute viral (NOS) - - 1 2
HIV infection 66 27 156 95
Hydatid disease - 1 - 2
Legionnaires' disease 7 1 19 8
Leprosy - .- -
-Leptospirosis 3 7 3
Listeriosis - - 4 4
Malaria 20 4 58 17
Measles 37 21 184 231
Meningococcal meningitis 1 4 6 12
Meningococcal septiceemia 1 2 5 4
Meningococcalinfection(NOS) 1 - 3 1
Mumps - - - 1
Mycobactenial tuberculosis 29 7 105 40
Mycobacterial-atypical 57 - 110 16
Mycobacterial infection (NOS) 3 3 12 25
Pertussis 39 40 127 321
Plague - - -
-Poliomyelitis - - -
-Qfever 33 4 92 36
Rubella 28 - 120 14
Salmonella infection (NOS) 117 49 341 275
Syphilis 69 33 184 186
Tetanus - - 2
Typhoid and paratyphoid 5 - 14 4
Typhus - - -
-Viral haemorrhagic fevers - - -
-Yellow fever - - -
-FOODEORNE INFECTIOUS DISEASE NOTIFICATIONS FOR NOTIFICATIONS RECEIVED BY MARCH 30, 1994 BY PUBLIC HEALTH UNIT
Condition CSA SSA ESA SWS WSA WEN NSA CCA ILL HUN NCR NER OFR CWR SWR SER U/K Total
Foodborrie illness (NOt) 1 4 7 2 - - - 2 - 17
Gastroenteritis (instit.) 11 - - - 2 - - 1 - 15
Listericais - - 1 - - - 1 1 1 4
Salmonella bovis morbificars - 1 1 - 1 - - - - 1 4
Salmonella typhimurium 10 8 8 1 26 3 4 3 7 10 - 1 2 7 3 1 - 104
Salmonella (NOt) 9 16 10 6 14 3 20 9 5 10 27 6 16 5 10 1 167
Typhoid arid paratyphoid - 1 2 - - 1 - - - - 4
---
-
---
---iNFECTIOUS DISEASE NOTIFICATIONS FOR 1994FOR NOTIFICATIONS RECEIVED BY MARCH 30, 1994 BY PLJRLIC HEALTH UNIT
Condition CSA SSA ESA SWS WSA WEN NSA CCA ILL HUN NCR NER OFR CWR SWR SER U/K Total
Adverse event after
imrnunisation - - - - 2 2 - 1 - - 1 6
AIDS 7 2 23 2 8 3 7 1 2 3 58
Arboviral infection - 2 - - -. - 3 1 2 7 85 2 8 7 117
Gonorrhoea 4 5 24 3 4 1 4 2 - 3 1 3 9 1 2 66
H. influenzae epiglottitis 1 1 - - 1 1 1 1 1 7
H. influenzae meningIts - - - 1 2
H. nfluenzae septiceemla - - - - 1 - - - - 2
H. influenzae infection (SUDS) - - - 2 - 1 3
HepatiliisA-acute viral 8 3 12 8 11 1 10 2 1 6 16 10 3 3 19 113
Hepatitis B - acute viral 3 - 4 - 1 - - - - 1 1 2 1 1 14
Hepatitis B - unspecified 80 75 65 160 121 4 94 12 15 24 16 1 3 3 7 689
Hepatitis C - acute viral - - - 1 1
HepatitisC-unspecified 161 70 236 132 121 31 154 47 55 96 203 10 11 34 39 21 - 1,421
Hepatitis D - unspecified - - - 1 - - -. 2 3
Hepatitis acute viral (NOS) - - 1 - - - 1 2
HIV infection 13 4 40 4 1 1 - 1 - 2 29 95
Hydatid disease - - 2 - - - 2
Legionnaires' disease - 1 1 - 2 - 3 - - - 1 - - - 8
Leptospirosis - - - 1 1 - - - 1 - - 3
Malaria 3 - 4 2 1 - 2 - - 1 1 - - - 3 - - 17
Measles 22 5 6 12 17 16 18 3 6 18 66 0 21 9 - 3 - 231
Menirigococcal meningitis - 2 - 2 2 1 - 2 - 2 1 - - - 12
Meningococcal septicoemia - - - 1 .-. - - I - 1 1 - - - 4
Meningococcal infection (NOt) - - - 1 - - - 1
Mumps - - - 1 - - -
-1
- - 1
16
Mycobacterial atypical
Mycobacterial tuberculosis 31 -8 5 1
-8 10- 2 -5 3
-1 -3 -2
1
-1
- 1
-.
-- 40
Mycobacterial infection (NOS) 13 - 1 - 3 1 3 - - 2 2 - - - 25
Pertussis 4 22 17 14 28 7 24 6 17 25 129 - 11 10 2 5 - 321
Qfever -. - - - 5 7 5 17 - 2 - - 36
Rubella - - 1 ..- 5 1 2 - - - 1 2 - - 2 - - 14
Rubella - congenital - - - -. - - 1 - - - 1
Syphilis 31 14 49 23 13 - 15 2 - - 14 - 21 1 3 - - 186
Total 354 214 492 381 352 72 351 85 102 194 556 43 106 65 86 35 29 3,517
:]I3
SURVEILLANCE OF NON-NOTIFIABLE SEXUALLY TRANSMITTED DISEASES Firstdiagnosis; 1. No data yet received tor 1994; 2. 01!01/94-31/01194; JANUARY-FEBRUARY 1994 3. 01/01/94-28/02/t4; 4.01/01/94-31/03/94; 5 Ne SHIC in Region; 6. Laboratory (Diagnoses from sexual health centres unless otherwis e stated in footnote) and SHC data 01/01/84-31/03/94.
AHS CSA1 SSA2 ESA3 5W52 W5A5 + WEN NSA5 CCA ILL' HUN' NCR3 NER4 OFR' ONR5 5WR SER'
Infection
Chiamydia Male - - 10 1 - - - 3 - -
-trachomatis Female - - 12 1 - 1 1 - - - 10 - - 3
Total - - 22 2 - 1 1 - - - 13 - - 3
-Donovanosis Male - - -
-Female - - - -. - - -
-Total - - -
-*Genhtal herpes Male - 1 57 - - 6 4 - - 1 1 - -
-Female - 3 16 - - 3 2 - - 1 6 - -
-Total - 4 73 - - 9 6 - - 2 7 - - -
-*Genital warts Male - 6 161 19 - 11 15 - - 6 3 - - 1
Female - 6 69 9 - 4 5 - - 2 11 - - 1
Total - 12 230 28 - 15 20 - - 8 14 - - 2
-Nongonococcal Male - 1 127 12 - 4 11 - - 6 5 -. - 1
urethritis Female - - - 2 - - - 2
Total - 1 127 12 - 6 11 - - 6 5 - - 3
-Lymphogranu)oma Male - - -
-venereum Female - - -
-Total - - -
-Abbreviations used in thin Bulletin:
CSA Central Sydney Health Area, SSA Southern Sydney Health Area, ESA Eastern Sydney Health Area, SWS South Western Sydney Health Anea, WSA Western Sydney Health Ama, WEN Wentworth Health Area, NSA Northern Sydney Health Area, CCA Central Coast Health Area, ILL Illawarra Health Area,
HUN Hunter Health Area, NCR North Coast Health Region, NER New England Health Region, OFR Orana and Far West Health Region, CWR Central West Health Region, SWR South West Health Region, SER South East Health Region, 0TH Interstate/Overseas, U/K Unknown, NOS Not Otherwise Stated.
Please note that the data contained in thit Bulletin are provisional and subject to change because of late reports or changes in case classification. Data are tabulated where possible by area of residence and by the disease Onset date and not simply the date of notification or receipt of such notrficaDon.
I
I
SENTINEL REPORTING ON INFLUENZA IN THE ILLAWARRA
HAEMQPH1LUS !NFLUENZAE TYPE B (Hib)
Only one notification for Hib in a child under one year of age has been made in NSW this year. The average age for Hib notifications was 13.7 years for the first quarter of 1994. This compares with 6.3 years for all of 1993 and 3.1 years for the first quarter of 1993. Only 14 notifications were received for the first quarter of 1994, for a rate of
0.95/100,000 population. This compares with a notification rate of 2.7/100,000 population for the same period iii 1993.
MEASLES
Notifications for measles peaked in epiweek 1. The notification rate for the first quarter of 1994 is 15.7/100,000 population. This compares with a rate of 12.5 for the same period in 1993. The North Coast PHI] has received 66 notifications at a rate of 69.4/100,000 population. The mean age for notifications was 8.0 years (range four months to 36 years). Fifteen per cent of notifications were for neonates and infants (^ one year of age). Fifty-nine per cent were for children over the age of five years, while 25 per cent were for people 12 years and older. From September 1, 1994, the schoolgirl rubella program is expected to be replaced by a universal schoolchild measles-mumps-rube]la program.
PERTussis (WHOOPING COUGH)
Notifications for pertussis peaked in epiweek 7. Seventy-eight per cent of notifications for 1994 were for the period before epiweek 8. The notification rate for pertussis for the first quarter of 1994 is 22.3/100,000 population. This compares with a rate of 8.6 for the same period in 1993.
Twenty per cent of notifications were for children aged less than five years. A further 36 per cent were for school-aged children. The mean age for notifications was 21.7 years. Sixty-six per cent of pertussis notifications were received from laboratories and 24 per cent were received from medical practitioners. North Coast Public Health Unit (PHU) has received 119 notifications at a rate of 125.2/100,000 population. The PHU has investigated all cases and advised contacts of measures to minimise risk of further spread in infection. Media releases have been made in community newspapers, and liaison between the PHU and the local Divisions of General Practice will promote the use of triple antigen.
SALMONELLA TYPHIMURIUM PHAGE TYPE 9 The National Salmonella Surveillance Scheme notified of 33 cases of Salmonella typhimurium phage type 9 in NSW between January 17 and February 10, 1994 from 11 Health Areas. Investigation by PHUs found a relationship between seven of the cases, who had bought food from a takeaway outlet in the Central Sydney Area.
Investigation by Food Surveillance Officers from Central Sydney PHU revealed unsatisfactory handling procedures, including unclean food processing equipment and perishable foods stored at unsatisfactory temperatures for long periods. Food samples were positive for Salmonella brandenburg. Measures have been implemented to improve hygiene at this outlet and further sampling will be undertaken to ensure satisfactory standards are maintained.
Desolie Lovegrove, Public Health Nurse, iliawarra Pubii.c Health Unit
Sentinel surveillance networks provide "listening posts" for timely reporting of conditions not normally notiflable. Sentinel surveillance does not provide complete prevalence data but can give an indication of changing patterns of disease and does provide a valuable early warning system for health professionals.
The Illawarra Sentinel Surveillance Network for influenza consists of general practice (G-P) surveillance and school surveillance.
The sentinel UP surveillance has been monitoring influenza and other specified conditions on a weekly basis since June 1990. In 1992 and 1993 influenza immunisation was included in the conditions for surveillance. The network consists of 14 doctors between Helensburgh in the north to Gerringong in the south.
The sentinel school surveillance has been monitoring weekly absentee rates in schools in four geographical (northern, central, western and southern) areas of the Illawarra. It has monitored absentee rates during the winter months of 1992 and 1993.
The National Health and Medical Research Council recommend annual influenza vaccination for individuals in the following categories:
. U
. U
adults and children with chronic debilitating disease, especially those with chronic cardiac, pulmonary, renal and metabolic disorders; persons over 65 years of age;
residents and staff of nursing homes and other chronic care facilities;
persons receiving immunosuppressive therapy; and medical and health personnel in regular contact with the above groups.
The Illawarra PKLT was interested in monitoring those receiving influenza immunisations in the community to ascertain whether it was the targeted "at risk" or the 'worried well" who were being immunised. Immunisation of the fit and well may be inadvisable since naturally-acquired influenza immunity provides protection against the virus for many years, compared with the short-term effects of the immunisation.
During the first week in April, as part of Influenza Awareness Week, the PHU targeted "at risk" groups in the community for influenza immunisation. An article was placed in the local GP newsletter and letters were sent to directors of all nursing homes in the Illawarra area recommending immunisation of residents in the at risk groups. Community health nurses were advised to
recommend immunisation to their clients. This was followed with coverage iii local newspapers and radio stations.
Influenza, school absentee rates and influenza immunisation uptake were monitored through the weekly sentinel GP and school surveillance networks.
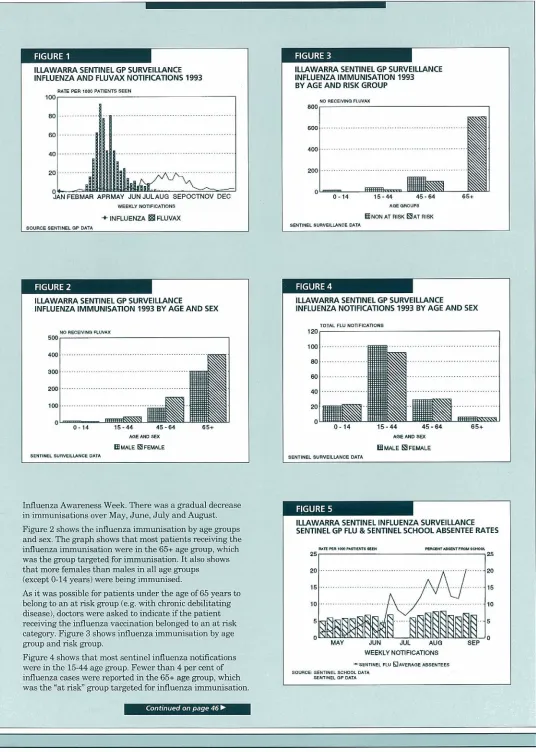
Figure 1 shows the number, calculated as rate per 1,000 patients seen, of influenza presentations and influenza immunisation reported by the Illawarra Sentinel UP Surveillance Network in 1993. The graph shows GPs were beginning to offer influenza immunisation in March, with the demand peaking in the first week in April which was
.
.
...
...
.
.
.
.
ILLAWARRA SENTINEL GP SURVEILLANCE ILLAWARRA SENTINEL GP SURVEILLANCE
INFLUENZA AND FLUVAX NOTIFICATIONS 1993 INFLUENZA IMMUNISATION 1993
BY AGE AND RISK GROUP
HATE PER lOOT PATIENTS SPUN
100
40 RECEIVING FLUVAX BOG
80
600
:...
::.
JAN FEBMAfl APISMAY JLJNJULAUO SEPOCTNOV DEC 0-14 15-44 45-64 65+
WEEKLY NOTIFICATIONS AGE GROUPS
+ INFLUENZA FLUVA.X ENON AT RISK AT RISK
SOURCE SENTINEL UP DATA SENTINEL SURVEILLANCE CATA
ILLAWARRA SENTINEL GP SURVEILLANCE ILLAWARRA SENTINEL GP SURVEILLANCE
INFLUENZA IMMUNISATION 1993 BY AGE AND SEX iNFLUENZA NOTIFICATIONS 1993 BY AGE AND SEX
TOTAL FLU NOIfFIOATIO44S 40 RECEIVING FLIJRAX
500
400
300
200
100
0-14 15-44 45-64 6S AlOE AND SEX
EMALE FEMALE
SENTINEL SURVEILLANCE SATA
Influenza Awareness Week. There was a gradual decrease in immunisations over May, June, July and August.
Figure 2 shows the influenza immunisation by age groups and sex. The graph shows that most patients receiving the influenza immunisation were in the 65+ age group, which was the group targeted for immunisation. It also shows that more females than males in all age groups (except 0-14 years) were being immtmised.
As it was possible for patients under the age of 65 years to belong to an at risk group (e.g. with chronic debilitating disease), doctors were asked to indicate if the patient receiving the influenza vaccination belonged to an at risk category. Figure 3 shows influenza immunisation by age group and risk group.
Figure 4 shows that most sentinel influenza notifications were in the 15-44 age group. Fewer than 4 per cent of influenza cases were reported in the 65^ age group, which was the "at risk" group targeted for influenza immunisation.
0-14 lb-44 454
RU-I-AlOE AND SEX
EMALE FEMALE
SENTINEL SURVEILLANCE DATA
[cLUJ.
ILLAWARRA SENTINEL INFLUENZA SURVEILLANCE SENTINEL GP FLU & SENTINEL SCHOOL ABSENTEE RATES
fort P10 000 PABTIENTS ItCh P100000 OOSENTrROM SCHOOL
MAY JUN JUL AUO SEP
WEEKLY NOTIFICATIONS
SENTINEL FLU El AVERAGE ABSENTEES SOURCE: SENTINEL SCHOOL EATA
SENTINEL OP DATA
Sentinel reportinq on influenza
Continued from page 45
During May, June, July, August and September absentee rates were being collected from sentinel schools in the Illawarra. Figure 5 shows the average school absentee rates and the sentinel GP influenza notifications. It is difficult to see a relationship between the two, although there was an interesting decrease in GP influenza notifications which corresponded with the school holidays.
The sentinel surveillance of influenza and influenza immunisation has provided the PHU and the community with useful data on the pattern of influenza, peak time for the administration of influenza immunisations, the age, sex and at risk category of the patients receiving the vaccinations. It would appear that in the Illawarra 80 per cent of influenza immunisations were given to those most likely to benefit - the elderly and others at risk- and that fewer than 4 per cent of influenza infections occurred in this group.
INFLUENZA SURVEILLANCE IN THREE CENTRAL WESTERN NSW BOARDING SCHOOLS
Peter Tissen, Kelly Deincttw and Peter Christopher, central Western Public Health Unit
Recurrent epidemics of influenza occur on average once every 1-10 years and can be traced back hundreds of years'. The pandemic of 1918-1919 demonstrated the potential devastation caused by influenza when, worldwide, an estimated 500 million people were infected and 20 million people died. Thus influenza caused the most deadly epidemic of disease in recorded history.
Although frequently a mild disease, influenza can cause death. It has a low case-fatality ratio - about 1 or 2 deaths per 1,000 cases - but in some groups such as the chronically ill and the elderly, the case fatality can be as high as 30 per cent.
The aims of sentinel surveillance programs are to provide a reliable, rapid and inexpensive means of disease surveillance. The purpose of this project was to monitor the incidence of influenza in the Evans and Lachlan Health Districts, as part of a Statewide program involving schools. Incidence of infection is often highest in school-age children, so the 1993 influenza surveillance program focused primarily on children aged 6-18 years.
The results obtained from the surveillance program conducted the previous year (1992 autumn/winter) showed a high incidence of influenza among children aged 13-18 years. This is commonly the case as the young are most frequently affected with new influenza virus strains, with adults often already immune to the strain from a past infection.
To achieve an exact diagnosis a blood test is required and the influenza strain is identified by means of a throat gargle. These methods of detection are not used throughout this surveil]ance as the technology required is too costly. Surveillance was to be conducted for five months during the autumn/winter period, from May 1 to October 1, 1993. Cases of influenza were determined by referring to the Royal Australian College of General Practitioners RACGPI influenza criteria, which set out symptoms and signs indicative of influenza.
Initially, school principals were approached by the Director of the Public Health Unit and made aware of the objectives of the program and their involvement in it. Three schools, in different geographical areas, were involved in this project. These were school A at Forbes, with 760 students, and two schools 150km away at Bathurst - school B with 290 students and C with 280 students.
All the schools involved cater for boarders and day students. The study had been designed to include both boarders and day students but this notion was abandoned because of the inaccuracy in diagnosis and the poor presentation of sick notes by day students. Therefore the surveillance dealt only with boarders, who are assessed when ill by a resident registered nurse. The nurses were to make a diagnosis by referring to the RACGP criteria. The work involved the sister in charge of the sickbay reporting once a week by phone to the Department to notify the number of boarders who bad contracted influenza.
Information on the number of pupils enrolled at each school was obtained from the nurses. Most students at school A had been immonised with the 1993 Commonwealth Serum Laboratory influenza vaccine about one week before the surveillance began. This was school policy.
During the five-month surveillance period, it was found that of a total of 1,330 boarder students, 42(3 per cent) had been diagnosed with influenza. Cases occurred only at school A and school B. There were no cases reported at school C. Schools A and B experienced two distinct outbreaks, at different times of the surveillance period. School A recorded a number of cases in late May/early June, while school B did not record any cases until the latter part of the surveillance period in August. The outbreaks occurred about eight weeks apart. No known hospitalisations or serious complications resulted from the illnesses.
From the results obtained it is evident that 1993 was not an epidemic influenza year, with only 42 cases among 1,330 students. In an epidemic year, with a new strain of influenza, an attack rate of 20 per cent or more would be expected.
Although most students at school A were vaccinated and presumed immune against influenza, this school still experienced an outbreak. This suggests the vaccine used did not contain the strain of the virus that caused the outbreak or did not have a high degree of protective value.
Compared with school A, school B experienced an outbreak during the latter part of the surveillance period because the influenza virus, via an infectious student, was introduced into the closed community later during the winter. School C experienced no cases of influenza. This suggests that when students had contact with the outside community, none contracted influenza, thus preventing the introduction of the infection to the other students.
This surveillance project was of value when combined with other similar studies undertaken by PHUs in the State, as it contributed to the provision of a profile of influenza occurrence in 1993 in NSW.
1. Benenson AS. Control of Communicable Diseases in Man, 1990, 15th Edition, American Public Health Association, Washington, USA. 2. Last JM and Wallace RB. Public Health and Preventive Medicine, 13th Edition, 1992, Appleton and Lange, Connecticut, USA.