Available at www.ijsred.com
Model of Automatic Sorting Station with Optical
Proximity Sensor
Victor A. Adebiyi
*,
Bankole. I. Oladapo
*
Ayodele O. Awe
*
*(aSchool of Engineering and Sustainable Development, De Montfort University, Leicester, UK bDepartment of Petroleum Engineering, Rivers State University, Port Harcourt, Rivers State, Nigeria
*Email:: [email protected])
---
************************
---Abstract:
An automatic bottle and PVC classification system based on machine vision is proposed in this
research. The design model and characterization of an automated classification system product using a
conveyor belt with machine vision integrating Free and Open Source Software technology and business
equipment. The application of machine vision library digital optical image processing Open CV, for the
mechanical design of the station and manufacturing CAD Solid works was used for the design and
implementation of automation ISA standards. Also a methodology of engineering projects in automation
by integrating a PLC, an inverter, View Panel with a Device Net network and optical sensor to perform the
test. The Performance testing and sorting pieces of PVC bottles are done in four types of established the
operation of the integrated system, and the efficiency is evaluated. The processing time machine vision is
on average 0.287s for a piece of PVC, a capacity of 204 per minute accessories, bottle processing time of
0.256s was achieved, a size of 220 bottles for about 7 minutes. Maximum mechanical efficiency of 30
products per minute (1910 products hour) with the conveyor 20cm/s and 40cm distance between products
obtaining an average error of 0.75% was obtained.
Keywords —Sorting, Proximity Sensor, PVC Bottle,CAD, Machine Vision
---
************************
---1.INTRODUCTION
In attempting automation machines provide visual capabilities to perceive the object position information, environment, movement, individuals, measure characteristics, calculating trajectories [1-2]. Perceptual tasks can be performed with greater objectivity and consistency electronic devices, which are more appropriate to perform highly repetitive and difficult visual work carried out by an
operator [2]. As in [3-6], today's machine vision is a discipline in progress with many applications. For example, in [6-8] perform an automated system for grading milled from the shape, size and color, the system use: conveyor chamber, photoelectric sensors, among other components and is controlled by a microcomputer chip (SMC) and PC. In [8,9] an automated system for the detection of irregular potatoes, conveyor rollers and PC is developed. In [9, 10], similar arrangements are made. In all
International Journal of Scientific Research and Engineering Development-– Volume 2 Issue 3, May –June 2019 Available at www.ijsred.com
ISSN : 2581-7175 ©IJSRED: All Rights are Reserved Page 638 previous work electromechanical equipment and
commercial vision, methods are used high cost. In many countries, work has been done on automation systems with machine vision. In [11], the PUJ developed a methodology based on an image for geometric and dimensional inspection of machined parts in machining tolerances lines. The implementation for a Robot Vision of the system into a manufacturing center for control of the packaging of centrifugal compressors [12, 13]. At present, they have spread these applications in a wide varietyof industries nationwide, where local companies perform solutions with proprietary technology [13, 14]. However, having an academic level with a manufacturing station that allows design and tests classification systems with machine vision is quite complicated and expensive physical infrastructure required, enabling laboratory workers and high investment, to mention the manufacturing station hardly affordable in any university, the same is required to purchase a machine vision system. A situation that must be supported by an academic plan and a series of practices and laboratories that allow maximizing the investment. The methodology for project engineering; automation applied to the design, construction and characterization of a station automatic sorting with machine vision. Integrating FOSS (Free and Open Source Software) technology and commercial equipment, which allows experienced with classification systems, initially in one of four traditional types for two kinds of products. In section 2 the methodology develops capturing requirements, designing the application of machine vision, mechanical system and implementing the marshalling by modelling S88, Section 3 presents the results of the characterization of the system, and finally, in section 4, the findings are reported.
2 METHODOLOGY
Methodology automation engineering projects developed in the Industrial Automation program of the University of Cauca are used. A mechanical
manufacturing station, a Classifier application of machine vision products and automation of the entire system: in its design requirements determined characteristics are defined. In the design and implementation of automation [15,16]. Instrumentation used with a PLC, an investor a touch screen Panel Viewed a Device Net network and Allen Bradley and integrated all online to a FOSS machine vision system. Finally, the marshalling yard is characterized by the comparison of performance between mechanical and vision systems. The station is an integrated automatic classification by a classifier machine vision products and the manufacturing station system. For the application of machine vision optical digital library OpenCV image processing [14, 15] is used for mechanical design manufacturing station CAD Solid Edge v17 [16] tool is used.
2.1 Requirements for an Automatic Classification System
www.ijsred.com mechanical design, requirements are design with
moderate physical dimensions to achieve its location in a conventional laboratory. The conveyor belt laboratory process control; use a modular design scheme in the sorting plant pieces on the conveyor belt that allows easy construction, installation and maintenance. It generates a continuous flow and closed parts plant classification; mechanically processing accumulates fragments to stop the flow and finalize the classification process; automatically positioning each piece in one of four possible positions across the width of the strip according to the classification decision. Apply the necessary industrial safety regulations and see the location of wiring boards and HMI panel. As for system automation requirements, it is telling the user the script corresponding to the type of product processed using LEDs in the manufacturing station and also using a screen Panel View V600Touch execution, used as a control module manufacturing station PLC MicroLogix 1500. These allow communication control module's network Device Net Fieldbus laboratories, sent from the PC to the PLC the type of product resulting from the classification. It was sort through the PLC to a mechanical actuator position in four product ranges, distances depending on the model; operate at variable speed (between 17 and 24cm/s) using an inverter, and use industrial technical standards (ISA ISA S5.1 and 88.1 /0.4) to the project
2.2 Sorter Machine Vision Products
Requirements analysis, machine vision and other related, it is designed and implemented an application machine vision to classify objects of two classes in one of four preset types. This is because the software and hardware stages that integrate components processing and image analysis needed to meet the requirements [19-20]. Begins with suitable scene product in the band, a sensor to start the acquisition of the image by a camera, a pre-processing and segmentation to extract product features, recognize and decide on the type thereof and communicate to PLC who
orders a physical action. In the above process involves both hardware and software elements. The hardware elements developed by lighting, sensing product trigger the own lightening laboratory, the fluorescent ceiling light is used. The infrared optical sensor detects the presence of a product in front of the camera and initiates the execution of the routine of processing of the captured image.
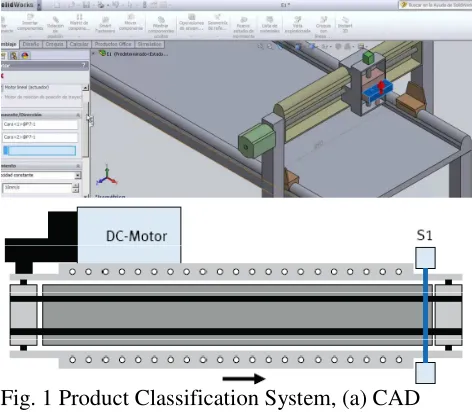
3 Design and Mechanical Model
A mechanical structure composed of a band and AC motor system designed to support two rollers between which a canvas belt is tensioned, the engine system rotates one of the rollers, moves the band and therefore this object. Transportation of products moving through the stages of the classification process. Product distribution (places the products at the centre of the conveyor belt) and classification of products (products classified and moved from one end of the belt conveyor to the other, forming a continuous flow). From the mechanical design requirements and the above functions, three automatic modules on the conveyor belt are designed, using CAD tools in Solid works, one for each purpose.
International Journal of Scientific Research and Engineering Development-– Volume 2 Issue 3, May –June 2019 Available at www.ijsred.com
ISSN : 2581-7175 ©IJSRED: All Rights are Reserved Page 640 Transport module: Translates products by
qualifying stages. It consists of a conveyor belt driven by a three-phase motor, which will design and install a band and auxiliary channel. The extra strip is located parallel to the main group and generates a continuous flow of products; the extra channel, metal structure that supports the extra group allows moving products are transported on a firm surface without falling. Distributor module: Translates and places products from the extra strip to the center of the main band — composed accumulator and distributor. The accumulator located on the supplemental strip products retained is designed as a pneumatic cylinder operating gate. The distributor is a mechanism consisting of a set of blades that move products from the extra strip towards the central part of the main band driven by an AC motor. Classification module: It consists of a classifier and a collector. The classifier products located is one of four possible positions on the band using a head driven by a pneumatic cylinder. The collector carries the products classified in the main group to the auxiliary group, has the same design distributor.
3.1 Modelling ISA 88
ISA 88 standard provides a standard terminology and models for manufacturing plants and batch control [20]. Although no method defined to use ISA88 no batch processes, models and concepts are applicable, with some variations of rules and requirements, without changing the basic model. Even it defined extension to apply NS88 S88 models in continuous and discrete processes.
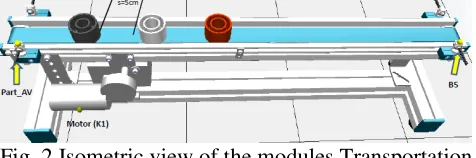
Fig. 2 Isometric view of the modules Transportation in Festo Ciros Mechatronic 3D–simulator of a Virtual process 3D simulator software
Fig. 3 Positions classification of Accumulator.
In this paper, the classification process product is modelled, making three ISA 88 models. The process (see Table 1), physical and procedural controls, where information is collected and organized, generating a basis for the implementation of the Automatic Control Station Quality corresponding to the instrumentation, control and supervision of the same [17].
3.2Instrumentation,Control and Supervision.
www.ijsred.com Panel and the other on an HMI panel (HMI Box),
which by LEDs and pushbutton allows local control on and off: the dealer, collector, transporter and a compressor.
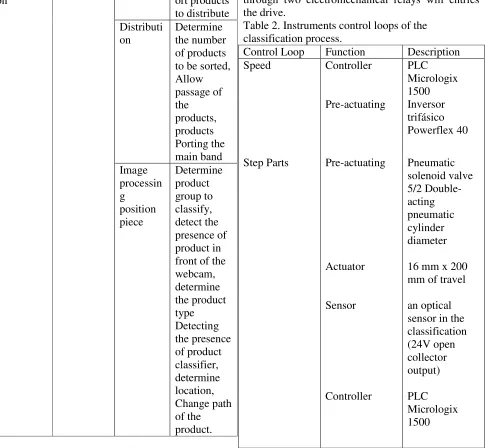
Table 1. Model Process product classification process.
Process Stage Operation Action Product
Classificati on
Classificati on
Transport Determine speed,transp ort products to distribute Distributi
on
Determine the number of products to be sorted, Allow passage of the products, products Porting the main band Image
processin g
position piece
Determine product group to classify, detect the presence of product in front of the webcam, determine the product type Detecting the presence of product classifier, determine location, Change path of the product.
Then instrumentation associated with the bonds described. Loop Speed Control: for the PLC to make monitoring and control of motor speed is made use of two modules, a high-speed counter 1769 HSC to connect an encoder and a module for analogue signals 1769-IB4XOF2 to communicate effort control the inverter, see Table 2. The monitoring and control on and off the three-phase motor of the conveyor can be done both from the HMI panel with two buttons and from the PLC, through two electromechanical relays will entries the drive.
Table 2. Instruments control loops of the classification process.
Control Loop Function Description Speed Controller PLC
Micrologix 1500 Pre-actuating Inversor
trifásico Powerflex 40
Step Parts Pre-actuating
Actuator
Sensor
Controller
Pneumatic solenoid valve 5/2 Double-acting pneumatic cylinder diameter
16 mm x 200 mm of travel
an optical sensor in the classification (24V open collector output)
International Journal of Scientific Research and Engineering Development
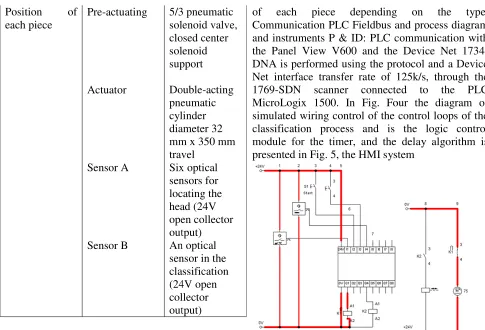
©IJSRED: All Rights are Reserved Position of
each piece Pre-actuating Actuator Sensor A Sensor B 5/3 pneumatic solenoid valve, closed center solenoid support Double pneumatic cylinder diameter 32 mm x 350 mm travel Six optical sensors for locating the head (24V open collector output) An optical sensor in the classification (24V open collector output)
Control loops step parts: the optical sensor located at the entrance of the classifier can count the number of pieces that go through the process so that when completed the total amount, through the pneumatic cylinder and solenoid valve pneumatic accumulator position between open and closed is changed. The PLC performs the monitoring and control of the number of pieces in the process, see Table 2. The control loop position of each piece: the PLC tells the vision application group pieces to be processed; vision application determines the type of part and sends the decision to the PLC when the sensor b is activated, see Table 2. The PLC reads the signal type of piece, as the six optical sensors signal indicating the current position head; thus the direction in which the head must move manipulating the position of the cylinder piston, using a pneumatic solenoid, so that the parts are correctly classified is determined. The PLC performs the monitoring and control of the position
International Journal of Scientific Research and Engineering Development-– Volume 2 Issue 3, May Available at www.ijsred.com
©IJSRED: All Rights are Reserved 5/3 pneumatic solenoid valve, closed center solenoid support Double-acting pneumatic cylinder diameter 32 mm x 350 mm travel Six optical sensors for locating the head (24V open collector output) An optical sensor in the classification (24V open collector output)
Control loops step parts: the optical sensor located at the entrance of the classifier can count the number of pieces that go through the process so that when completed the total amount, through the pneumatic cylinder and solenoid valve pneumatic or position between open and closed is changed. The PLC performs the monitoring and control of the number of pieces in the process, see Table 2. The control loop position of each piece: the PLC tells the vision application group pieces to ion application determines the type of part and sends the decision to the PLC when the sensor b is activated, see Table 2. The PLC reads the signal type of piece, as the six optical sensors signal indicating the current position head; thus the which the head must move manipulating the position of the cylinder piston, using a pneumatic solenoid, so that the parts are correctly classified is determined. The PLC performs the monitoring and control of the position
of each piece depending on the typ Communication PLC Fieldbus and process diagram and instruments P & ID: PLC communication with the Panel View V600 and the Device Net 1734 DNA is performed using the protocol and a Device Net interface transfer rate of 125k/s, through the 1769-SDN scanner connected to the PLC MicroLogix 1500. In Fig. Four the diagram of simulated wiring control of the control loops of the classification process and is the logic control module for the timer, and the delay algorithm is presented in Fig. 5, the HMI system
Fig. 4 the diagram of simulated wiring control of the control loops
Fig. 5 The logic control module for the timer and the delay algorithm
4 RESULTS AND DISCUSSION
After different tests were perform. The webcam Logitech C210 connected by a USB port processing module, execution of scripts (computer Qbex with Volume 2 Issue 3, May –June 2019
www.ijsred.com
Page 642 of each piece depending on the type. Communication PLC Fieldbus and process diagram and instruments P & ID: PLC communication with the Panel View V600 and the Device Net 1734-DNA is performed using the protocol and a Device Net interface transfer rate of 125k/s, through the r connected to the PLC MicroLogix 1500. In Fig. Four the diagram of simulated wiring control of the control loops of the classification process and is the logic control module for the timer, and the delay algorithm is presented in Fig. 5, the HMI system
Fig. 4 the diagram of simulated wiring control of
Fig. 5 The logic control module for the timer and
4 RESULTS AND DISCUSSION
www.ijsred.com USB port the camera and parallel port for an
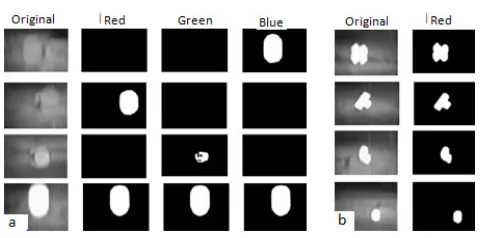
interface circuit with the trigger and PLC) and interface with manufacturing station (electronic circuit that connects the Modular processing what the trigger, indicator lights and the PLC using a parallel port. Plastic bottles and pieces of PVC [19]: six (6) stages of processing for each product type are made. Image acquisition: implemented in C ++ based on OpenCV, to design and implement processes scripts that fit the image of the product obtained. Pre-processing: to improve the acquired images and get characters to recognize each product, see Fig 6. The parts of the PVC red channel RGB spectrum is segmented, for plastic bottles segmentation was made. The three channels see Fig. Seven description of an extraction for each product of different characters extraction. The bottles are classified by the color of the cover, the area of the images from each RGB channel with the common area (pixels) of each type of bottle for each channel calculated with 20 test images. The PVC is classified according to form the common area, and perimeter features of the four types of pieces from 20 imagine test. Object recognition was performed by comparing the area obtained from each channel with a reference value. This was then determined to get the pro-through area of each channel, for each type of product, and the final stage. The decision recognizes the color of the cover, in the case of bottles or how parts of PVC, to determine the type of product.
Fig. 6 Pre-processing: a) for each type bottle j b) for each piece of PVC
Fig. 7 Segmentation: a) for each type bottle b) for each part of PVC
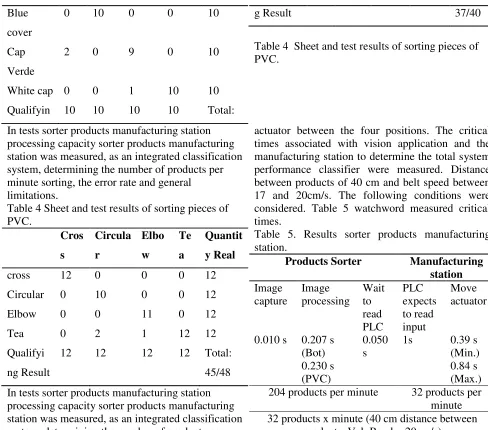
Individual tests are performed to measure the performance of processing scripts. As for the bottles, the performance is evaluated classification scripts capturing images of containers with the band moving at 22cm/s, and verifying its kind. 40 images were captured in real time, ten of each type, with marching group, corresponding to classify each of the image scripts were used and compared if the result obtained corresponds to the real part. In Table 3, the data are recorded after qualifying 40 pictures of bottles, with moving web. In the ranks is the actual number of bottles of each color, and columns the result of classification, recognition products it worked right with the band at 20cm/s with a 2.5% error rate. As for accessories, PVC, the performance of classification is evaluated scripts capturing images of PVC fittings with the band moving at 18cm/s, and verifying its kind. Forty-eight images were captured in real time, 13 of each type, with moving the belt, the corresponding scripts for classification were used and compared if the result obtained corresponds to the real part. In Table 4, data to classify 48 images are recorded with moving web. In the ranks is the actual number of types of PVC fittings, and columns the result of classification, product recognition is given error rate 0% with the band to 18cm/s.
Table 3 Sheet and test results are sorting bottles.
Re
d
Blue
e
Gree
n
white
e
actual
amoun
t
International Journal of Scientific Research and Engineering Development-– Volume 2 Issue 3, May –June 2019 Available at www.ijsred.com
ISSN : 2581-7175 ©IJSRED: All Rights are Reserved Page 644 Blue
cover
0 10 0 0 10
Cap
Verde
2 0 9 0 10
White cap 0 0 1 10 10
Qualifyin 10 10 10 10 Total:
g Result 37/40
Table 4 Sheet and test results of sorting pieces of PVC.
In tests sorter products manufacturing station processing capacity sorter products manufacturing station was measured, as an integrated classification system, determining the number of products per minute sorting, the error rate and general limitations.
Table 4 Sheet and test results of sorting pieces of PVC.
Cros
s
Circula
r
Elbo
w
Te
a
Quantit
y Real
cross 12 0 0 0 12
Circular 0 10 0 0 12
Elbow 0 0 11 0 12
Tea 0 2 1 12 12
Qualifyi
ng Result
12 12 12 12 Total:
45/48
In tests sorter products manufacturing station processing capacity sorter products manufacturing station was measured, as an integrated classification system, determining the number of products per minute sorting, the error rate and general limitations
4.1 Test products per minute
The critical times of the system were identified and measured in the time it took to process to capture a new image. Time image processing is time-consuming scripts to process each image to generate a classification decision. The stabilization time PLC is the time it takes to stabilize the PLC inputs receiving the classification decision from the interface circuit and time of mechanical displacement is the time it takes to move the
actuator between the four positions. The critical times associated with vision application and the manufacturing station to determine the total system performance classifier were measured. Distance between products of 40 cm and belt speed between 17 and 20cm/s. The following conditions were considered. Table 5 watchword measured critical times.
Table 5. Results sorter products manufacturing station.
Products Sorter Manufacturing station
Image capture
Image processing
Wait to read PLC
PLC expects to read input
Move actuator
0.010 s 0.207 s (Bot)
0.050 s
1s 0.39 s (Min.) 0.230 s
(PVC)
0.84 s (Max.) 204 products per minute 32 products per
minute 32 products x minute (40 cm distance between
products, Vel. Band = 20cm/s)
www.ijsred.com allowing a theoretical limit of 32 products per
minute per and limiting the processing speed of the system.
4.2 Testing Execution Continues
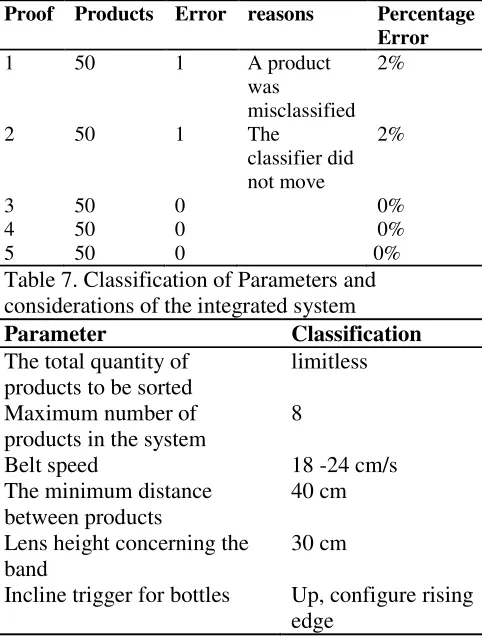
Five tests of classification of products made with the integrated system continuous execution, counting the products that fail to rate, and determining whether the error comes from the classifier of products or manufacturing station. The test conditions are Distance between 40 cm and minimum products belt speed between 17 and 20cm/s. Table 6 watchword the percentage error of each test, an overall average error of 0.75% is obtained, presented errors are due to failure sorter products and the second failure in the manufacturing station. Table 7 watchword parameters proper functioning of the product sorter station manufacturing and other considerations.
Table 6. Final sorter products manufacturing testing station.
Proof Products Error reasons Percentage
Error
1 50 1 A product
was
misclassified 2%
2 50 1 The
classifier did not move
2%
3 50 0 0%
4 50 0 0%
5 50 0 0%
Table 7. Classification of Parameters and considerations of the integrated system
Parameter Classification
The total quantity of products to be sorted
limitless
Maximum number of products in the system
8
Belt speed 18 -24 cm/s The minimum distance
between products
40 cm
Lens height concerning the band
30 cm
Incline trigger for bottles Up, configure rising edge
Incline trigger for PVC accessories
Down, set the falling edge
5 .CONCLUSIONS
International Journal of Scientific Research and Engineering Development-– Volume 2 Issue 3, May –June 2019 Available at www.ijsred.com
ISSN : 2581-7175 ©IJSRED: All Rights are Reserved Page 646 on the speed of the web manufacturing station and
the distance between the products, obtaining a maximum yield of 32 products per minute (1910 products hour) with the band at 20cm/s and with 40cm distance between products obtaining an average error of 0.75%.
REFERENCES
[1] W. Wu,X. Wang, G. Huang,D. Xu, Automatic gear sorting system based on monocular vision, Digital CommunicationsandNetworks(2015) 1, 284–291
[2] X.Q. Wang, Fully automatic gear detection and classification system, China Sci.Technol.Inf.15(2012)104–107.
[3] B. I. Oladapo, V.A. Balogun, A.O.M. Adeoye, C.O. Ijagbemi, Afolabi S. Oluwole, I.A. Daniyan, A. E. Aghor, Asanta P. Simeon, Model design and simulation of automatic sorting machine using proximity sensor, Eng. Sci. Tech., Int. J. (2016), http://dx.doi.org/10.1016/j.jestch.2016.04.00 7.
[4] J.C. Xu,L.Y.Zhang,H.Yan,Small module plastic gear on-line detection based on machine vision, Modul. Mach. Tool Autom. Manuf. Tech.3(2011)57–65.
[5] M. B. Ramli, H. P. Lim, M. S. Waha, M. F. M. Zin, Egg hatching incubator using conveyor rotation system, Procedia Manufacturing 2 ( 2015 ) 527 – 531.
[6] T. F. Chan, S. Esedoglu, M. Nikolova, Algorithms for finding global minimizers of image segmentation and denoisingmod- els, SIAMJ.Appl.Math.66(5)(2006)1632–1648. [7] P. Arbelaez, M. Maire, C. Fowlkes, J. Malik,
Contour detection and hierarchical image segmentation,IEEETrans.onPattern Anal. And Mach.Intell.33(5)(2011)898–916. [8] S. O Afolabi, B. I Oladapo, C. O Ijagbemi,
A. O. M Adeoye, J. F Kayode, Design and finite element analysis of a fatigue life prediction for safe and economical machine shaft, JMRT. 8 (1), 105-111
[9] J. Lia, B. Dong, T. Yan, Development of a measurement and control system for a 40 l/h
helium liquefier based on Siemens PLC S7-300, Physics Procedia 67 ( 2015) 1181 – 1186.
[10] L. xin ,L. Guang, Y. Ming, Design on the Precise Regulating Control System for Moisture and Nutrient of Plants Based on PLC, 2012 International Conference on Medical Physics and Biomedical Engineering, Physics Procedia 33 (2012) 429 – 436.
[11] E.B. Priyanka, C. Maheswari, B. Meenakshipriya, Parameter monitoring and control during petrol transportation using PLC based PID controller. JART 14 (2016) 125–131.
[12] B. I Oladapo, S. A Zahedi, A. O Awe, F. T Omigbodun, V. A Adebiyi, Analysis on corrosion resistant of electrodeposited ternary Co-WP alloy, Applied Surface Science 475, 627-632 [13] A. Pytlik, K. Trela, Research on
tightness loss of belt conveyor's idlers and its impact on the temperature increase of the bearing assemblies, Journal of Sustainable Mining (2016) 1-9
[14] M. Bajda, R. Krol, Experimental Tests of Selected Constituents of Movement Resistance of the Belt Conveyors Used in the Underground Mining, World Multidisciplinary Earth Sciences Symposium, WMESS 2015, Procedia Earth and Planetary Science 15 ( 2015 ) 702 – 711. [15] Ahmet H. Ertas, Fazıl O. Sonmez,
Design optimization of spot-welded plates for maximum fatigue life, FEA and Design 47 (2011) 413–423.
[16] B. I. Oladapo, A. O. M Adeoye, M Ismail, Analytical optimization of a nanoparticle of microstructural fused deposition of resins for additive manufacturing, Composites Part B: Engineering 150, 248-254
www.ijsred.com [18] B. I. Oladapo, V. A. Balogun, A. O.
M Adeoye, I. E. Olubunmi, S. O Afolabi. Experimental analysis of electro-pneumatic optimization of hot stamping machine control systems with on-delay timer. JART 15 (4), 356-364
[19] K. Furmanik, Possibilities of dimensional analysis implementation in the investigations of belt inclination resistance on conveyor drums (in Polish). Mining Sciences, vol. 21 (2) (2014) 25-32.
[20] B. I Oladapo, S. A Zahedi, A.O. M Adeoye, 3D printing of bone scaffolds with hybrid biomaterials, Composites Part B: Engineering 158, 428-436