Model-based Boosting 2.0
Torsten Hothorn [email protected] Institut für Statistik
LMU München DE-80539 München
Peter Bühlmann [email protected]
Seminar für Statistik ETH Zürich
CH-8092 Zürich
Thomas Kneib [email protected]
Institut für Mathematik Universität Oldenburg DE-26111 Oldenburg
Matthias Schmid [email protected] Benjamin Hofner [email protected] Institut für Medizininformatik, Biometrie und Epidemiologie
FAU Erlangen-Nürnberg DE-91054 Erlangen
Editor: Mikio Braun
Abstract
We describe version 2.0 of theRadd-on package mboost. The package implements boosting for optimizing general risk functions using component-wise (penalized) least squares estimates or re-gression trees as base-learners for fitting generalized linear, additive and interaction models to potentially high-dimensional data.
Keywords: component-wise functional gradient descent, splines, decision trees
1. Overview
a subset of the features into account. Special cases are linear models f(x) =x⊤β, additive mod-els f(x) =∑pj=1fj(x(j)), where fj is a function of the jth feature x(j) only (smooth functions or
stumps, for example) or a more complex function where f(x) is implicitly defined as the sum of multiple decision trees including higher-order interactions. The latter case corresponds to boosting with trees. Combinations of these structures are also possible. The most important advantage of such a decomposition of the regression function is that each component of a fitted model can be looked at and interpreted separately for gaining a better understanding of the model at hand.
The characteristic ξ of the distribution depends on the measurement scale of the response Y and the scientific question to be answered. For binary or numeric variables, some function of the expectation may be appropriate, but also quantiles or expectiles may be interesting. The definition ofξis determined by defining a loss functionρwhose empirical risk is to be minimized under some algorithmic constraints (i.e., limited number of boosting iterations). The model is then fitted using
(fˆ1, . . . ,fˆp) =argmin
(f1,...,fp)
n
∑
i=1wiρ yi,
p
∑
j=1fj(x) !
.
Here(yi,xi),i=1, . . . ,n, are n training samples with responses yiand potentially high-dimensional
feature vectors xi, and wi are some weights. The component-wise boosting algorithm starts with
some offset for f and iteratively fits residuals defined by the negative gradient of the loss function evaluated at the current fit by updating only the best model component in each iteration. The details have been described by Bühlmann and Yu (2003). Early stopping via resampling approaches or AIC leads to sparse models in the sense that only a subset of important model components fj defines the
final model. A more thorough introduction to boosting with applications in statistics based on version 1.0 of mboost is given by Bühlmann and Hothorn (2007).
As of version 2.0, the package allows for fitting models to binary, numeric, ordered and censored responses, that is, regression of the mean, robust regression, classification (logistic and exponential loss), ordinal regression,1quantile1and expectile1regression, censored regression (including Cox, Weibull1, log-logistic1or lognormal1models) as well as Poisson and negative binomial regression1 for count data can be performed. Because the structure of the regression function f(x)can be chosen independently from the loss function ρ, interesting new models can be fitted (e.g., in geoadditive regression, Kneib et al., 2009).
2. Design and Implementation
The package incorporates an infrastructure for representing loss functions (so-called ‘families’), base-learners defining the structure of the regression function and thus the model components fj,
and a generic implementation of component-wise functional gradient descent. The main progress in version 2.0 is that only one implementation of the boosting algorithm is applied to all possible models (linear, additive, tree-based) and all families. Earlier versions were based on three imple-mentations, one for linear models, one for additive models, and one for tree-based boosting. In comparison to the 1.0 series, the reduced code basis is easier to maintain, more robust and regres-sion tests have been set-up in a more unified way. Specifically, the new code basis results in an enhanced and more user-friendly formula interface. In addition, convenience functions for hyper-parameter selection, faster computation of predictions and improved visual model diagnostics are available.
Currently implemented base-learners include component-wise linear models (where only one variable is updated in each iteration of the algorithm), additive models with quadratic penalties (e.g., for fitting smooth functions via penalized splines, varying coefficients or bi- and trivariate tensor product splines, Schmid and Hothorn, 2008), and trees.
As a major improvement over the 1.0 series, computations on larger data sets (both with re-spect to the number of observations and the number of variables) are now facilitated by memory efficient implementations of the base-learners, mostly by applying sparse matrix techniques (pack-age Matrix, Bates and Mächler, 2009) and parallelization for a cross-validation-based choice of the number of boosting iterations (per default via package multicore, Urbanek, 2009). A more elaborate description of mboost 2.0 features is available from themboostvignette.2
3. User Interface by Example
We illustrate the main components of the user-interface by a small example on human body fat composition: Garcia et al. (2005) used a linear model for predicting body fat content by means of common anthropometric measurements that were obtained for n=71 healthy German women. In addition, the women’s body composition was measured by Dual Energy X-Ray Absorptiometry (DXA). The aim is to describe the DXA measurements as a function of the anthropometric features. Here, we extend the linear model by i) an intrinsic variable selection via early stopping, ii) addi-tional terms allowing for smooth deviations from linearity where necessary (by means of penalized splines orthogonalized to the linear effect, Kneib et al., 2009), iii) a possible interaction between two variables with known impact on body fat composition (hip and waist circumference) and iv) using a robust median regression approach instead of L2risk. For the data (available as data frame bodyfat), the model structure is specified via a formula involving the base-learners correspond-ing to the different model components (linear terms: bols(); smooth terms: bbs(); interactions: btree()). The loss function (here, the check function for the 0.5 quantile) along with its negative
gradient function are defined by theQuantReg(0.5)family (Fenske et al., 2009). The model struc-ture (specified using the formulafm), the data and the family are then passed to functionmboost() for model fitting:3
R> library("mboost") ### attach package ‘mboost’
R> print(fm) ### model structure
DEXfat ~ bols(age) + bols(waistcirc) + bols(hipcirc) + bols(elbowbreadth) + bols(kneebreadth) + bols(anthro3a) + bols(anthro3b) + bols(anthro3c) + bols(anthro4) + bbs(age, center = TRUE, df = 1) + bbs(waistcirc, center = TRUE, df = 1) + bbs(hipcirc, center = TRUE, df = 1) + bbs(elbowbreadth, center = TRUE, df = 1) + bbs(kneebreadth, center = TRUE, df = 1) + bbs(anthro3a, center = TRUE, df = 1) + bbs(anthro3b, center = TRUE, df = 1) + bbs(anthro3c, center = TRUE, df = 1) + bbs(anthro4, center = TRUE, df = 1) + btree(hipcirc,
waistcirc, tree_controls = ctree_control(maxdepth = 2, mincriterion = 0))
R> ### fit model for conditional median of DEXfat
R> model <- mboost(fm, ### model structure
2. Accessible viavignette("mboost", package = "mboost").
25−fold bootstrap
Number of boosting iterations
Quantile Regression
10 70 140 220 300 380 460 540 620 700 780 860 940
1 2 3 4 5 6 (A)
2.5 3.0 3.5 4.0 4.5 5.0
−6 −4 −2 0 2 anthro3b
fpa
rt
ia
l
(B)
2.5 3.0 3.5 4.0 4.5 5.0
−6 −4 −2 0 2 anthro3b
fpa
rt ia l (C) hipcirc w aistcirc 70 80 90 100 110
90 100 110 120 130
−15 −10 −5 0 5 10 15
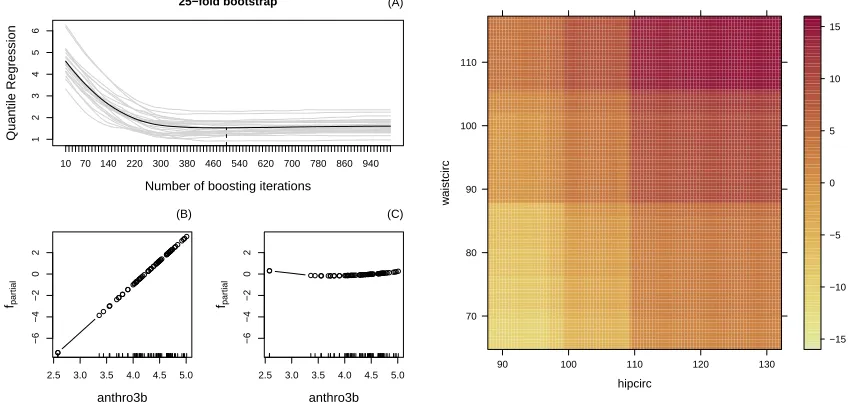
Figure 1: Out-of-bag empirical risk (A) indicating that 500 iterations are appropriate. Fitted model components for variableanthro3b, consisting of a linear (B) and smooth term (C). The right panel shows the interaction model component between hip and waist circumfer-ences.
+ data = bodyfat, ### 71 observations
+ family = QuantReg(tau = 0.5)) ### median regression
Once the model has been fitted it is important to assess the appropriate number of boosting iterations via the out-of-sample empirical risk. By default, 25 bootstrap samples from the training data are drawn and the out-of-bag empirical risk is computed (parallel computation if possible):
R> ### bootstrap for assessing the ‘optimal’ number R> ### of boosting iterations
R> cvm <- cvrisk(model, grid = 1:100 * 10)
R> model[mstop(cvm)] ### restrict model to optimal mstop(cvm) iterations
Now, the final model is ready for a visual inspection:
R> plot(cvm) ### depict out-of bag risk and
R> plot(model) ### selected components
The resulting plots are given in Figure 1. They indicate that a model based on three components, including a smooth function ofanthro3band a bivariate function of hip and waist circumference, provides the best characterization of the median body fat composition (given the model specification offered to the boosting algorithm). A hip circumference larger than 110 cm leads to increased body fat but only if the waist circumference is larger than 90 cm.
References
Douglas Bates and Martin Mächler. Matrix: Sparse and Dense Matrix Classes and Methods, 2009. URLhttp://CRAN.R-project.org/package=Matrix. R package version 0.999375-38.
Peter Bühlmann and Torsten Hothorn. Boosting algorithms: Regularization, prediction and model fitting (with discussion). Statistical Science, 22(4):477–505, 2007.
Peter Bühlmann and Bin Yu. Boosting with the L2 loss: Regression and classification. Journal of the American Statistical Association, 98:324–339, 2003.
Nora Fenske, Thomas Kneib, and Torsten Hothorn. Identifying risk factors for severe childhood malnutrition by boosting additive quantile regression. Technical report, Institut für Statistik, Ludwig-Maximilians-Universität München, 2009. URLhttp://epub.ub.uni-muenchen.de/ 10510/.
Jerome H. Friedman, Trevor Hastie, and Robert Tibshirani. Additive logistic regression: a statistical view of boosting (with discussion). The Annals of Statistics, 28:337–407, 2000.
Ada L. Garcia, Karen Wagner, Torsten Hothorn, Corinna Koebnick, Hans-Joachim F. Zunft, and Ulrike Trippo. Improved prediction of body fat by measuring skinfold thickness, circumferences, and bone breadths. Obesity Research, 13(3):626–634, 2005.
Torsten Hothorn, Peter Bühlmann, Thomas Kneib, Matthias Schmid, and Benjamin Hofner. mboost: Model-Based Boosting, 2010. URLhttp://CRAN.R-project.org/package=mboost. R pack-age version 2.0-4.
Thomas Kneib, Torsten Hothorn, and Gerhard Tutz. Variable selection and model choice in geoad-ditive regression models. Biometrics, 65(2):626–634, 2009.
Matthias Schmid and Torsten Hothorn. Boosting additive models using component-wise P-splines as base-learners. Computational Statistics & Data Analysis, 53(2):298–311, 2008.