Performance Evaluation of Heat Exchangers in a Polyethylene Plant
Barinaadaa Thaddeus Lebele-Alawa
*, Innocent Okpara Ohia
Department of Mechanical Engineering, Rivers State University of Science and Technology, Port-Harcourt, Nigeria
Received 12 October 2012; received in revised form 15 November 2012; accepted 04 December 2012
Abstract
This paper evaluates the performance of three heat exchanger units (2-E-2301, 3-E-901 and 3-E-401) in a polyethylene plant. Steady state monitoring and direct collection of data from the equipment in the plant were performed and the data were analyzed by using energy equations to determine the overall heat transfer coefficient, heat duty, temperature and pressure range of hot and cold fluids, capacity ratio and effectiveness. The results show that for 2-E-2301, the overall heat transfer coefficient is over 50 percent less than the design figure and the heat duty is over 75 percent than the design figure. For the 3-E-901 the heat duty and the overall heat transfer are over 75 percent less than the design figure which was traceable to fouling. This affected the effectiveness, capacity ratio and temperature range of the hot and cold fluid. For the 3-E-401, the heat duty was found to be within the limit of design figure. The temperature difference in the hot fluid side and the capacity ratio were within the limits of the design figure. Thus, the results show qualitative performance evaluation of the heat exchangers.
Keywords: heat-exchanger, heat, performance, energy
1.
Introduction
Heat exchangers are equipments that transfers heat from one medium to another. It is a device in which energy is transferred from one fluid to another across a solid surface. It is used where high temperature and pressure demand are significant and can be employed for a process requiring large quantities of fluid to be heated or cooled [1]. Many types of heat exchangers have been developed to meet the widely varying application, based on operating principles, arrangement of flow path and design constructional features. The process of heat exchange between two fluids that are at different temperatures and separated by a solid wall occurs in many engineering applications such as in a polyethylene plant. The device used to implement this exchange is called a heat exchanger, and specific applications may be found in space heating and air-conditioning, power production, oil distillation, waste heat recovery and chemical processing [2]. In a polyethylene plant, the heat exchangers allow heat energy in the plant to be passed from one process fluid to another in a controlled manner. It is also used for temperature profile control as well as steam generation and phase separation.
Heat exchangers are typically classified according to flow arrangement and type of construction. In the first classification, flow can be counter-current or co-current (also called parallel). On the other hand, according to their configuration, heat exchangers can be labeled as tabular, plate and shell-and-tube heat exchangers. In recent years, several performance evaluation methods and studies have been developed and employed to evaluate and improve the performance of heat exchangers. Such includes enhanced surfaces which can be divided into both passive and active method. Passive
*Corresponding author. E-mail address: lebele-alawa.thaddeus@ust.edu.ng
methods include extended surfaces, inserts, cooled or twisted tube, surface treatment and additives. Active techniques include the use of surface vibration, electrostatic field and suction [3]. Also, is the use of effectiveness –NTU approach to predict the thermodynamic performance behavior of heat exchanger for Joule-Thomson refrigerator with nitrogen and argon gas in which the results shows that the effectiveness of the heat exchanger decreases as the mass flow rate increases but the ideal cooling capacity at high pressure do not decrease [4]. Also, is the design improvement of a shell and tube heat exchanger based on practical experience and numerical analysis, in which several different geometries are examined both theoretically and experimentally, utilizing some heat exchangers of shell chemical facility. The study aimed to facilitate the judgment of design proposition of shell and tube by affording an experimentally verified modeling approach of a general kind and examination of prevailing wear mechanisms in order to define the requirement of the modeling approach. This study revealed that the performance, maintenance and life span of a vertical shell and tube evaporator critically depends on the geometry near the outlet [5].
A study on the performance improvement of heat exchangers by method of characteristics has been done [6]. In this study, the air flow in the heat exchanger was assumed one-dimensional and unsteady, and the method of characteristics was used to simplify the governing equations into non-homogenous first -order partial differential equations. The uniform interval was applied to analyze the effect of the fin improvement factor on air mean temperature in the heat exchanger, the mean heat transfer rate of the heat exchanger, and air properties in the exchanger. The numerical results for specific operating condition were compared with the available data. The thermal conductivities of air and the heat exchanger used for analysis were 0.0099J/smK and 117.49J/smK respectively. Also, the use of CFD-fluent simulation to predict and analyze the heat transfer in shell and tube heat exchanger by comparing the simulation results to the experimental results has been done [7].
In this work, experimental study and numerical simulation on heat transfer and pressure drop characteristics were performed at the shell side of a helically baffled heat exchangers. The flow field and heat transfer performance in the shell side were simulated by using commercial fluent software. The numerical results of shell side Nusselt number and pressure drop were compared with those of experimental data and showed that CFD simulation helped to increase the efficiency of a heat exchanger [7]. Exergy analyses have also been used as a method of performance evaluation of a heat exchanger, in which effectiveness and exergy were compared [8]. Effectiveness is based on the first law of thermodynamics while exergy is base on both the first and second laws of thermodynamics and also takes irreversibility into consideration in the system (exergetic efficiency). Numerical analysis of plate heat exchanger has also been applied to evaluate the performance in a co-current fluid flow configuration heat exchanger [9].
Also, the evaluation of surface coating in heat exchangers has been done [10].This study presented an experimental investigation of coating effectiveness in compact plate heat exchangers and transient observation of heat transfer surface appearance, where new and cleaned coated heat exchangers that have been exposed to untreated lake water for various time periods were considered and transient effectiveness results compare the rate of fouling for coated and uncoated heat exchangers. Results indicated that the thermal performance of the unit decreases with time, resulting in undersized heat exchangers. Uncoated plates accumulate deposits up to 50% faster than coated plates and show a decrease in performance by approximately 20%. Thus, results indicate that enhanced plate performance can be achieved by utilizing customs enhanced plate which was produced by ridgidized metal corporation.
Also, the performance evaluation of tube- in -tube heat exchangers with heat transfer enhancement in the annulus in which the performance of heat exchangers was substantially improved by many augmentation techniques applied to design systems [11]. This study investigated the potentials of some very simple and inexpensive methods of heat transfer augmentation that could be used by small manufacturing companies. The methods include (i) a round tube inside a twisted square tube to enhance the rotation component in the annulus which increased the heat transfer coefficient by 50% and fiction factor by 9%, (ii) the use of spiraling tube inside the annulus of a tube-in tube heat exchangers in which the aim was not only to increase the heat transfer in the annulus by swirl flow but also to increase the cross flow area, since some of the flow will not only be through the annulus but also through the spiraled tube. (iii) The third was the use of an angled spiraled tape to induce swirl in annulus in which the heat exchanger were tested and result shows 206% increase in Nusselt Number of the heat exchanger with the smaller pitch of the angled spiraling tape and flow against the curvature of the tape. Thus, the results shows that, in most cases considered the angled spiraling tube insert technique were the most efficient.
The present work presents an energy evaluation performance analysis based on steady state monitoring and reading of data in a process plant that is used to evaluate the performance of heat exchanger in polyethylene plant and compare with design data to predict the effect of degradation. This was carried out at Eleme petrochemical company limited located at Eleme near Port Harcourt, Rivers State, Nigeria. The plant was constructed in 1995 by a consortium comprising Chiyoda, Japan Gas Company and Kobe Steel of Japan, Technimont of Italy and Spie Batignolles of France.The complex is designed to produce 270,000 metric tons per year of polyethylene and 80,000 metric tons per year of polypropylene. To produce these resins NGL (Natural Gas Liquid) is cracked in a Kellog Brown and Root licensed Olefin plant which has the capacity to produce 300,000 metric tons of ethylene per year and 126,000 metric tons of polypropylene per year. NGL feed stock for this company is supplied by NAOC which is a joint venture of Agip/NNPC.
The polyethylene plant is a sclair tech process licensed by Nova chemicals; and the polypropylene plant is spheripol process of Basel. Additionally, 22,000 metric tons of Butene-1 is produced in the complex.Butene-1 is used as co-monomers in the production of linear low Density polyethylene (LLDPE). (AXENS AFP CHEMICALS, Process licensor).The polyethylene (PE) plant consists of two units: Polymerization and Extrusion. In the polymerization unit, polymer grade ethylene is polymerized in a reactor in the presence of catalyst and co-catalysts to polyethylene. After the polymerization reaction, the slurry from the reactor is sent for catalyst deactivation and separation. The product is High Density Polyethylene (HDPE). While in the Extrusion unit, the polymer is stabilized by the addition Additives. Stabilized melt (molten monomer) is then extruded in the extruder, cut into pellets dried and store in the storage silos.
2.
Materials and Methods
(a) Direct collection of data from the equipment in the plant and operation log books from September 2010 to October, 2011. (b) Field investigation and observation of the various heat exchanger units.
The parameters considered during the data collection were inlet and outlet temperature and pressure of the process fluid, cooling water and DTA (Biphenyl 26.5% and Diphenyl oxide 73.5%) and the flow rate. In the analysis and treatment of the data, mean values of daily parameters were computed using statistical methods. This was followed by monthly average and the overall average for the period the research is carried out. From this, such parameters as temperature and pressure ranges, heat duty, capacity ratio, effectiveness and overall heat transfer coefficient were determined.
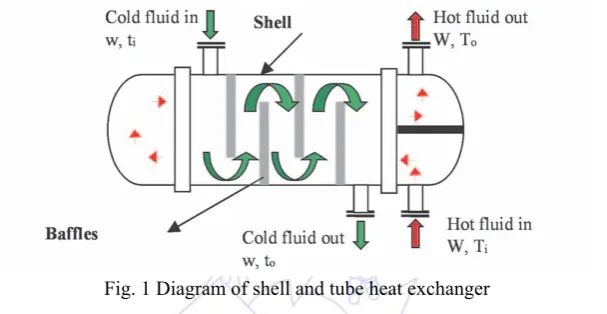
Analytical model: A typical shell and tube heat exchanger is shown in Fig. 1 below. The various equations used in the analysis are also presented.
Fig. 1 Diagram of shell and tube heat exchanger
Pump around cooler is a co-current heat exchanger which is mainly used in the dimerization process and used for the production of butene-1 by IFP (process licensor). The dimerization reaction is exothermic; thus, the heat of reaction is removed by the pump around cooler. The process passes the tube-side and cooling water the shell-side. The first stage condensers are vertical single-pass water cooled heat exchangers responsible for cooling cyclohexane solvent vapour flash separated from molten polymer which is the first stage low pressure separator. The solution pre-heater are responsible for solution heating. That is increasing the reactor outlet solution temperature to the solution absorbers in order to promote the adsorption of catalyst residues on an activated alumina bed in the solution absorbers. DTA ( dowtherm synthetic organic heat transfer fluid) is used instead of steam as the heating medium.
2.1. Overall Heat Transfer Coefficient U: This is defined by the relation
(1a)
(1b)
(2) Where Heat duty of the hot fluid.
m - mass flow rate
Cph - specific heat capacity of hot fluid thi - inlet temperature of hot fluid tho - outlet temperature of hot fluid
2.2. Capacity Ratio (R): This is the ratio of the temperature range of the hot fluid to that of the cold fluid.
(3) where: tci – inlet temperature of cold fluid; tco - outlet temperature of cold fluid
2.3. Effectiveness (S): This is the ratio of cold fluid temperature range to that of the inlet temperature difference of the hot and cold fluid.
(4)
3.
Results and Discussions
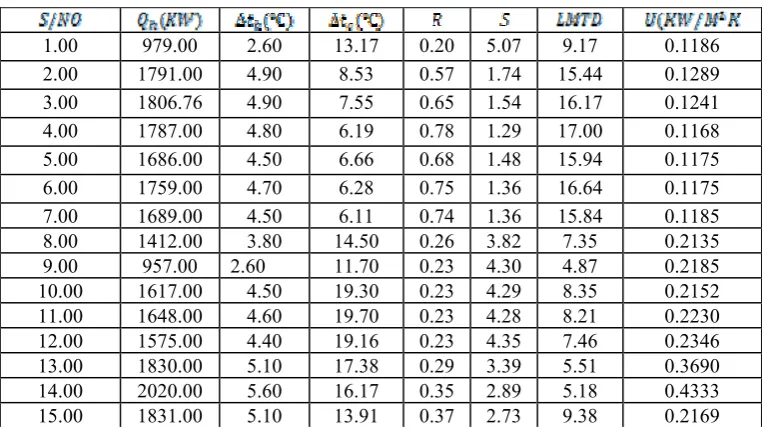
Performance evaluation was based on steady state monitoring and direct collection of data from the various heat exchanger units in the plant. The data measured were inlet and outlet temperatures of hot and cold fluid and inlet and outlet pressures The measured data were substituted into equations 1-4. The various monthly average calculated values of for the three various heat exchanger are shown in tables 1 to 3 computed using Q-Basic Programme. Tables 4 to 6 shows the comparison of measured/ calculated data with the design data.
Table 1 Calculated values of , , ,R,S, LMTD, and U for 2-E-2301(continued)
1.00 979.00 2.60 13.17 0.20 5.07 9.17 0.1186
2.00 1791.00 4.90 8.53 0.57 1.74 15.44 0.1289
3.00 1806.76 4.90 7.55 0.65 1.54 16.17 0.1241
4.00 1787.00 4.80 6.19 0.78 1.29 17.00 0.1168
5.00 1686.00 4.50 6.66 0.68 1.48 15.94 0.1175
6.00 1759.00 4.70 6.28 0.75 1.36 16.64 0.1175
7.00 1689.00 4.50 6.11 0.74 1.36 15.84 0.1185
8.00 1412.00 3.80 14.50 0.26 3.82 7.35 0.2135
9.00 957.00 2.60 11.70 0.23 4.30 4.87 0.2185
10.00 1617.00 4.50 19.30 0.23 4.29 8.35 0.2152
11.00 1648.00 4.60 19.70 0.23 4.28 8.21 0.2230
12.00 1575.00 4.40 19.16 0.23 4.35 7.46 0.2346
13.00 1830.00 5.10 17.38 0.29 3.39 5.51 0.3690
14.00 2020.00 5.60 16.17 0.35 2.89 5.18 0.4333
16.00 1686.00 4.70 14.99 0.31 3.19 6.91 0.2711
17.00 1647.00 4.60 17.26 0.27 3.75 5.56 0.3291
Table 1 Calculated values of , , ,R,S, LMTD, and U for 2-E-2301
18.00 1727.00 4.80 16.07 0.30 3.35 8.28 0.2317
19.00 1579.00 4.40 15.16 0.29 3.45 7.30 0.2403
20.00 1577.00 4.40 17.02 0.26 3.87 6.31 0.2776
21.00 1840.00 4.90 6.57 0.75 1.34 16.62 0.1230
22.00 1848.00 4.90 6.11 0.80 1.25 16.19 0.1268
23.00 1319.00 3.50 6.66 0.53 1.90 17.22 0.0851
24.00 1697.00 4.50 6.00 0.75 1.33 16.67 0.1131
Average 1637.00 4.47 12.17 0.45 2.81 10.96 0.2010
Table 2 Calculated values of , , ,R,S, LMTD, and U for 3-E-901 SN
1 4688.00 156.80 7.90 19.85 0.050 57.59 0.1061
2 1128.00 96.00 0.60 160.00 0.006 57.16 0.0257
3 841.00 76.50 0.30 255.00 0.004 43.88 0.0210
4 881.00 87.00 0.50 174.00 0.006 52.71 0.0218
5 650.81 80.90 0.90 89.89 0.011 48.11 0.0176
6 833.27 92.20 0.60 153.67 0.007 33.88 0.0321
7 960.24 84.90 1.50 56.60 0.018 57.99 0.0216
8 1228.98 94.70 2.00 47.35 0.021 72.71 0.0220
9 510.39 41.70 1.00 41.70 0.024 48.52 0.0137
10 1017.93 90.00 1.20 75.00 0.013 66.09 0.0201
11 1131.16 95.10 3.05 31.18 0.032 65.00 0.0227
12 1251.56 95.80 5,80 16.86 0.059 70.54 0.0233
Average 1260.20 91.09 2.11 93.43 0.021 56.18 0.0290
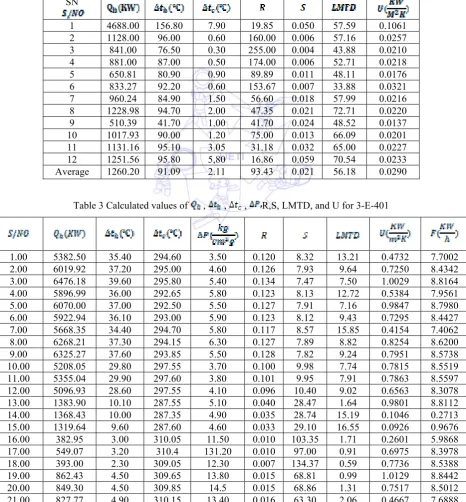
Table 3 Calculated values of , , , R,S, LMTD, and U for 3-E-401
1.00 5382.50 35.40 294.60 3.50 0.120 8.32 13.21 0.4732 7.7002
2.00 6019.92 37.20 295.00 4.60 0.126 7.93 9.64 0.7250 8.4342
3.00 6476.18 39.60 295.80 5.40 0.134 7.47 7.50 1.0029 8.8164
4.00 5896.99 36.00 292.65 5.80 0.123 8.13 12.72 0.5384 7.9561
5.00 6070.00 37.00 292.50 5.50 0.127 7.91 7.16 0.9847 8.7980
6.00 5922.94 36.10 293.00 5.90 0.123 8.12 9.43 0.7295 8.4427
7.00 5668.35 34.40 294.70 5.80 0.117 8.57 15.85 0.4154 7.4062
8.00 6268.21 37.30 294.15 6.30 0.127 7.89 8.82 0.8254 8.6200
9.00 6325.27 37.60 293.85 5.50 0.128 7.82 9.24 0.7951 8.5738
10.00 5208.05 29.80 297.55 3.70 0.100 9.98 7.74 0.7815 8.5519
11.00 5355.04 29.90 297.60 3.80 0.101 9.95 7.91 0.7863 8.5597
12.00 5096.93 28.60 297.55 4.10 0.096 10.40 9.02 0.6563 8.3078
13.00 1383.90 10.10 287.55 5.10 0.040 28.47 1.64 0.9801 8.8112
14.00 1368.43 10.00 287.35 4.90 0.035 28.74 15.19 0.1046 0.2713
15.00 1319.64 9.60 287.60 4.60 0.033 29.10 16.55 0.0926 0.9676
16.00 382.95 3.00 310.05 11.50 0.010 103.35 1.71 0.2601 5.9868
17.00 549.07 3.20 310.4 131.20 0.010 97.00 0.91 0.6975 8.3978
18.00 393.00 2.30 309.05 12.30 0.007 134.37 0.59 0.7736 8.5388
19.00 862.43 4.50 309.65 13.80 0.015 68.81 0.99 1.0129 8.8442
20.00 849.30 4.50 309.85 14.5 0.015 68.86 1.31 0.7517 8.5012
22.00 789.13 4.30 310.25 14.20 0.019 72.15 1.27 0.7217 8.4459
23.00 1220.85 9.90 309.75 9.30 3.200 31.29 1.86 0.7623 8.5198
24.00 1322.29 9.40 310.30 10.50 0.030 33.01 4.20 0.3658 7.0978
Average 3373.32 20.61 299.62 12.30 0.202 35.87 6.94 0.6543 7.5933
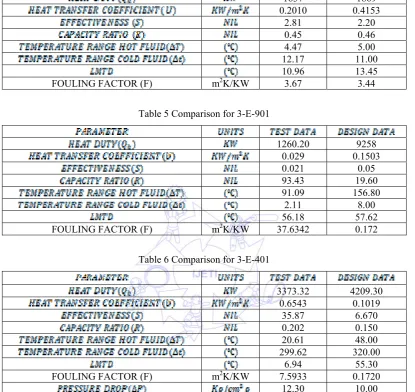
Table 4 Comparison of calculated data with design date for 2-E-2301
1637 1869 0.2010 0.4153
2.81 2.20 0.45 0.46 4.47 5.00 12.17 11.00 10.96 13.45
FOULING FACTOR (F) m2K/KW 3.67 3.44
Table 5 Comparison for 3-E-901
1260.20 9258 0.029 0.1503 0.021 0.05 93.43 19.60 91.09 156.80 2.11 8.00 56.18 57.62
FOULING FACTOR (F) m2K/KW 37.6342 0.172
Table 6 Comparison for 3-E-401
3373.32 4209.30 0.6543 0.1019
35.87 6.670 0.202 0.150 20.61 48.00 299.62 320.00
6.94 55.30
FOULING FACTOR (F) m2K/KW 7.5933 0.1720
12.30 10.00
From table 4, the overall heat transfer coefficient is over 50% less than the design figure and the actual heat duty difference is practically negligible as these duty is over 75% the design figure and the difference could also be because of the specific heat capacity deviation with the temperature or heat loss due to radiation from the hot shell side. The effectiveness and capacity ratio are negligible as there are only slight deviations from the design figures.
From table 5, the heat duty and the overall heat transfer coefficient are over 75% less than the design figure. This is traceable to high increase in fouling that has resulted in minimized active area of heat transfer and this has also affected effectiveness, capacity ratio and the temperature range of the hot and cold fluid.
4.
Conclusions
Heat exchangers are vital part of the process plant in which they are installed in terms of heat transfer within the plant. As such, in order to maintain them at high efficient level. A periodic performance evaluation of the equipment is required.
This paper has considered the overall heat transfer coefficient, heat duty, capacity ratio, and effectiveness as relevant parameters for the evaluation of the heat exchanger performance using steady state monitoring and direct collection of data from the equipment in the plant. The results were compared with the equipment design data and this provided qualitative performance evaluation of the heat exchangers.
Nomenclature
A Heat Transfer Area
Cph Specific Heat Capacity of hot Fluid F Fouling Factor
m Mass Flow Rate (Kg/h) Qh Heat Duty of hot Fluid (KW) R Capacity Ratio
S Effectiveness
thi Inlet Temperature of hot fluid (oC) tho Outlet Temperature of hot fluid (oC) tci Inlet Temperature of cold fluid (oC) tco Outlet Temperature of cold fluid (oC)
Δtc Change in cold fluid temperature
Δth Change in hot fluid temperature U Overall heat transfer co-efficient
Ucal Overall Heat Transfer Coefficient from Data (KW/m2K) Uclean Overall Heat Transfer Coefficient from Design ( KW/m2k)
References
[1] E.A.Ogbonnaya, “Maintenance optimization of a marine heat exchanger subject to fouling,” Journal of Emerging Trend in Engineering and Applied Science (JETEAS), vol.1 no 2 pp. 161-168, 2010.
[2] F.O.Jegede and G.T. Polley, “Optimum heat exchanger design,” Transactions of the institution of Chemical Engineers 70 (Part A), pp. 133-141, 1992.
[4] Y. Hong, S.Park, Y.Choi,“A numerical study of the performance of a Heat Exchanger for a Miniature Joule- Thomson Refrigerator,” Proceedings of the 15th International Cryocooler Conference, University of Wiscosin WI53706, 2009, pp.1-13.
[5] C.W.M .van der Geld and J.M.W.M., Schoonen “Design Improvement of a Shell and Tube Heat Exchanger based on practical experience and Numerical Analysis,” Faculty of Mechanical Engineering. Eindhoven University of Technology, Netherlands, 1988.
[6] Y.M. Huang, “Study of unsteady flow in a heat exchanger by method of characteristics,” J. Pressure Vessel Technol, vol. 114, pp. 459, 1992.
[7] K.H.Othman, “Computional Fluid Dynamic simulation of Heat Transfer in Shell and Tube Exchanger,” B.Sc project, Dept. Chemical and Natural Resources Engineering,Univ. of Malaysia, 2009.
[8] R. L.Corneliseen, Thermodynamic and sustainable development: The use of exergy analysis and the reduction of irreversibility. FEBODRUK BV, Netherlands: Enschede, 1997, pp 23-32.
[9] H.Dardour, “Numerical Analysis of Plate Heat Exchanger Performance in Co-current fluids flow configuration,” World Academy of Science, Engineering and Technology, 2009.
[10] D.J. Kukulka, “Evaluation of surface coating on Heat Exchangers,” A study at the Great Lakes Research Centre of the University of New York College at Buffalo New York 14222 USA, 2008.