INTRODUCTION Description of the study area
The East Siang district is a wild, mountainous area and present a remarkable topographical variety. The district is bounded on
COMPUTER SCIENCE & TECHNOLOGY
www.computerscijournal.org
December 2011, Vol. 4, No. (2): Pgs. 341-349
An International Open Free Access, Peer Reviewed Research Journal
Land Use/Land Cover and Geomorphological
Characteristics Study Using Remotesensing and GIS:
A Model Study from Arunachal Pradesh
S.S. ASADI
1*, B.V.T. VASANTHA RAO
2,
M.V. RAJU
3and P. NEELA RANI
41Department of Civil Engineering, KL University, Green fields,Vaddeswaram - 522 502 (India). 2Department of Civil Engineering,p.v.p.siddhardha Institute of Technology,Kannure, Vijayawada (India).
3Department of Civil Engineering, Vignan University, Vadllamudi, Guntur (India). 4Research Scholer, J.N.T.University, Kukatpally, Hyderabad (India).
*Corresponding author: E-mail: asadienviron.asadi@gmail.com (Received: September 29, 2011; Accepted: October 16, 2011)
ABSTRACT
The demand for Natural resources is increasing day by day due to increasing population , rapid urbanization, industrial growth and agricultural utilization. The levels of Groundwater is decreasing over years due to all the above activities and decreasing of annual rainfall year by year due to climatic changes and increasing runoff due to urbanization and deforestation. Hence, it is necessary to increase the land and water resources levels for future demands. Keeping this in view, we have done a model study for Socio-Economic condition and mapping of Landuse/Land cover and geomorphology characteristics study . The Study area is situated at East siang district of Arunachalpradesh falling in SOI toposheet no. 83I/13,14,82L/5,10,11,14,16,82P/ 2,3,4,7,8,11,12,83M/1,5,9.
The present study was carried out to delineate Landuse/Land cover and Geomorphology cares tics IRS-ID PAN and LISS-III geocoded data on 1:50000 scale. Geographical Information System was used to prepare database on the above layers, analysis of relationship and integrated map preparation. The study area has a complex geomorphology. On the basis of geomorphic characteristics. The study has focused the utility of remote sensing data in creation of socio-economic condition data and identification of Land use/Land cover Geomorphology class even in a complex terrain like the study area. The result in the form of integrated map could be properly analyzed using the advantage of technology like GIS as the methodology, which includes analysis of many resources and their interpretation. In the final maps, identified different class of Land use/ Land cover and geomorphology in the study areas to meet future demand and proper utilization of resources.
Key words: Geomorphological Characteristics Study, Remote sensing, GIS.
which Yamne, Simong, Yembung are wor th mentioning.
The Adi tribe and its sub-tribes, viz, Minyong, Padam, Pasi etc, are the inhabitants of this district. The name of the district is derived from the Siang River. Pasighat, the district headquarters, is the first administrative Centre
East Siang District with its headquarters at Pahighat has been divided into 5(five) sub-divisions for better administrative control. These are Pasighat, Ruksin, Boleng, Yingkiong and Tuting. Each sub-division is put under the administrative control of Additional Deputy Commissioner or Extra Assistant Commissioner thus. Yingkiong sub-division is controlled by Additional Deputy Commissioner where as other four sub-divisions are run by Extra Assistant Commissioners. Further, sub-divisions are again breakup into 16 circles under the control of Extra Assistant Commissioner or Circle Officers. Mariyang circle is therefore, run by Extra Assistant Commissioner whereas Circle Officer are posted in the remaining circles.Above all the organization of over all district administration is controlled and guided by the Deputy Commissioner. He is the highest Administrative authority in the district.
Study Objectives
´ To extract and understand the topografical characteristics of the study area for effective management and future development ´ To create spatial digital database consisting
of Land use/Land cover, Geomorphology maps using IRS-ID PAN & LISS-III merged satellite data, SOI toposheets and ground data on ARC/INFO GIS platform
´ To generate attribute data base consisting of statistical details of each of the above thematic layers
Location Map of the Study Area
Table 1: Data Type, Important Features and Sources of Acquisition
S No. Data Type Source of acquisition
I Thematic Data
1 Land use/Land cover map Toposheets of Survey of India. State Forest Department. Satellite data
2 Hydrogeomorphology map Satellite data + SOI Toposheet II Collateral Data
1 Demographic data Bureau of Economics and Statistics Division
2 Rainfall Data Bureau of Economics and Statistics Division
3 Existing Statical data Department ofEconomics& Statistics.
III Field Data Field Work collection Of all information
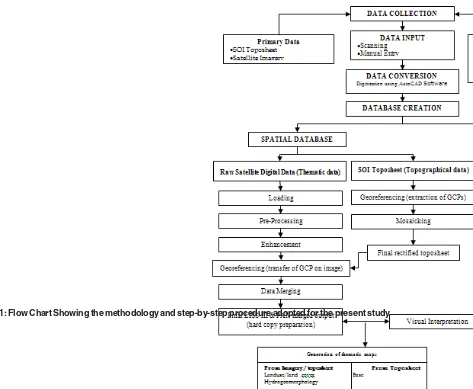
Methodology
Building Digital Database
The database development consumes substantial resources particularly, in the initial stages of system development. The geographic
Spatial Database
The spatial database relevant for this study are thematic maps of the present district.
1) Base map
2) Land use / Land cover map 3) Hydrogeomorphology
Data Creation
In GIS, topology is the term used to describe the geometric characteristic of objects, which do not change under transformations and are independent of any coordinate system. The topological characteristics of an object are also independent of scale of measurement. Topology as it relates to spatial data and non-spatial data consists of three elements, namely adjacency, containment and connectivity. Broadly, topology can be explained in two ways. Topology consists of metric aspects of spatial relations, such as size, shape, distance and direction. Many spatial relations between objects are topological in nature, including adjacency, containment and overlap. The geometric relationship between spatial entities and corresponding attributes are very crucial for spatial analysis and integration in GIS.In topology creation both the spatial and attribute data are linked from which different parameter maps are generated. These maps depict the spatial distribution of non-spatial information on non-spatial locations.
Digital Thematic Mapping
The procedure consists of a set of above image elements or characteristics which help in the recognition or interpretation of various land use /land cover and hydrogeomorphplogy features systematically on the enhanced satellite imagery during the classification of features (Lillesand, 2000) The land use/ Land cover and hydrogeomorphology classification system used in this project is the system which is pioneered by United States Geological Survey (USGS) and is modified by National Remote Sensing Agency(NRSA) according to Indian conditions. The details of this LU/LC and hydrogeomorphology system is beyond this report and one can be referred NRSA LU/LC and hydrogeomorphology book. A preliminary image classification key is prepared for the fussed pictorial data and is used during interpretation process. Using the image interpretation key, preliminary interpretation of
satellite imagery is carried by transferring the features from base map on to the transparency. This transparency with base line data features is then overlaid on the satellite imagery . Then the features of LU/LC and hydrogeomorphology are extracted and transferred from the satellite pictorial data.
The doubtful areas (due to similar spectral response and spectral signature) identified during the preliminary image classification are listed out before ground verification. After finalizing the ground traverse plan the doubtful areas are physically verified and field observation about terrain condition and land use and hydrogeomorphology pattern are noted. Ground photographs taken during field data collection is enclosed for understanding its use in image classification for Land use / Land cover and hydrogeomorphology system. Based on the ground information collected, corrections and modifications of miss classified land use/land cover and hydrogeomorphology details and doubtful areas are carried out on enhanced imageries for final land use/land cover and hydrogeomorphology classification. The final land use/land cover and hydrogeomorphology classes are separated by assigning standard colors with respect to each one of the land use/land cover and hydrogeo-morphology classes.
Data I ntegration
The work schedule gives the following principle steps involved.
1) Collection of toposheet from survey of India (1:50000 scale).
2) Collection of data from satellite imagery (fused data of IRS-IC PAN and
IRS-ID LISS-III Imagery) obtained from NRSA.
3) Delineation of the study area and conversion of raster data into vector data.
4) Preparation of thematic maps with the help of secondary data and primary data. 5) the above data is then exported to ARC/INFO
and further processed in ArcView GIS software to create digital database for subsequent data analysis.
RESULTS AND DISCUSSION Land use/land cover description
Present land use/land cover map showing the spatial distribution of various categories and their areal extent is vital for the present study. The spatial distributions of various land uses are interpreted based on fused data of IRS-1C, PAN and IRS-ID, LISS III data. The different land use. land cover classes existing in the area over space and time are briefly discussed here in their dimension.
Built up land
It is defined as an area of human habitation developed due to non agricultural use and that which has a cover of buildings, transport, communication, utilities in association with water, vegetation and vacant lands. Urban or built up land is composed of areas of intensive use with much of the land covered by structures. Included in this category are cities, towns, and areas occupied by commercial complexes, shopping centers, industrial complexes etc. Built up land appears as dark bluish green in the core and bluish on the periphery on satellite imagery. It may be either big or small in size, irregular in shape with coarse or mottled texture. The total residential area in the present study area is about 5.167 Kms.
Land With Scrub
It is the land, which has an undulating topography with thin soil cover and scattered trees/ scrubs. These lands are being used for grazing and are ideal sites for plantations. 224.135 Sq Kms in the central region of the study area is occupied by this pattern of land use.
Land Without Scrub
It is the land, which has an undulating topography with thin soil cover and devoid of any scrubs. These areas are prone to sheet wash and rill erosion. 0.118 sq Kms of the total area is occupied by this type of land cover.
Forest plantation
It is described as an area under agricultural tree crops planted adopting certain agricultural management techniques. It includes
tea, coffee, rubber, coconut, areca nut, citrus, orchards and other horticultural nurseries. Plantation can be seen very prominently on the imagery with a dark red to red tone, regular in shape, sharp edges and coarse to medium texture. Their size varies from small to medium. The area under this category forms 2.965 sq.kms of the total geographical area of the study area.
Water bodies
Lakes, tanks, ponds and rivers come under this category which occupy an area of 295.248 Sq Kms. There are small water bodies located in different parts of the study area. These water bodies are identified based on their tone, regular to irregular shape & smooth to mottled texture on the satellite imagery. Surface water spread of the tank or lake varies from season to season. The major river present in the study area includes the Shiang River. It appears as long, narrow to wide feature on the imagery with an irregular shape and a smooth texture. It is usually associated with vegetation along the banks and in the riverbed.
The rocks have undergone intense folding, faulting and trusting. As a result of complex deformation of the rocks units thrust over the younger ones, e.g. then differentiated Bichom (Marine Gondwanas) and Eocene are thrust over the Siwalik rocks. All the rock units except the Tertiaries and the undifferentiated Bichoms and Eocenes occur in the form of notch which is geologically known as ‘eastern syntaxial bend’ of the great Himalayas. The outer most rocks are high-grade schist’s and gneisses of Bomdila Group. The core of the ‘syntaxial bend is made up of the rocks Yinkiyoung or Rengging Formation.
Geomorphology description
Land Use / Land Cover classification in the study area
Land Use / Land Cover Total
Agriculture Crop Land (Kharif) 228.390
Agricultural Crop Land (Rabi) 10.571
Agriculture Plantations 2.965
Bamboo Forest 33.265
Built-upland Town 5.167
Built –Upland Villages 8.821
Forest Blanks 1.963
Forest Evergreen / Semi Evergreen Blanks 55.552 Forest Evergreen / Semi Evergreen Dense 2595.768 Forest Evergreen / Semi Evergreen Open 220.304 Forest Evergreen / Semi Evergreen Scrub 40.950
Grass Land / Grazing Land Open 115.838
Shifting Cultivation 7.139
Waste land with scrub 224.135
Waste land without scrub 0.118
Water bodies river 66.442
Waterbodies river dry 181.056
Water bodies river sandy area 1.347
Wetlands 46.403
Total 3845.182
Land Use / Land Cover Map of the
PIE CHART SHOWING AREA DISTRIBUTION OF LAND USE/ LAND COVER
2595.768 220.304
40.950 115.838
7.139 224.135
0.118 66.442
181.056 1.34746.403227.390
2.965
55.552 1.963 8.821 5.167 33.265 10.561
Agriculture Crop land (Kharif) Agriculture Crop land (Rabi) Agriculture Plantations Bamboo Forest Built-upland Town Built-upland Villages Forest Blanks
Alluvial Plain
It is described as an Nearly level plain formed by the deposition of alluvium by major rivers. It is further classified into 2 categories – 1) Older / Upper and 2) Younger/ Lower. The area under this category forms 70.13 sq.kms of the total geographical area of the study area.
Channel Island
It is described as An island formed in the braided rever course. The area under this category forms 29.53 sq.kms of the total geographical area of the study area.
Denudational Hills
It is described as an Hills formed due to differential erosion and weathering, so that a more resistant formation or intrusion stand as mountains / hills. The area under this category forms 126.58 sq.kms of the total geographical area of the study area.
Flood Plain
It is described as an Alluvium deposited
along the river / stream courses due to repeated flooding. It is classified into 2 categories – 1. Older/ Upper, 2. Younger / Lower. The area under this category forms 238.70 sq.kms of the total geographical area of the study area.
Grass Land
It is described as an area covered with gross is called grass land. The area under this category forms 24.03 sq.kms of the total geographical area of the study area.
Older Flood Plain
It is described as an Alluvium deposited along the river / stream courses due to repeated flooding. It is classified into 2 categories – 1. Older/ Upper, 2. Younger / Lower. Older refers to earlier cycle of deposition and upper refers to higher elevation . Based on the thickness of alluvium, it is classified into 3 categories -1 Shallow (0-10 m), 2. Moderate (10-20 m) and 3. Deep (>20 m). The area under this category forms 56.77 sq.kms of the total geographical area of the study area.
The general succession as given below
Age Lithie Units Correlation
Late Proterozoic Gneisses, Micaceaous Granetiferious, Potin and Kataba formations of Ansiri Carbonacaous and Biotite schists, District. Part – Bomdila Group Schistose and Massive Quartzites
Thrust
Late Proterozoic to Undifferentiated rocks equivalent to Tenga – Dilang Groups Upper Palsozonic Tenga and Dihang Groups: slates,
crystalline limestone, quartzites phyllites, metabasis and low grade schists. Thrust
Upper Palaeozoic Abor Volcanics: Basalt and tuffs Thrust
Eocene Yinkiong Formation
Thrust
Upper Palaeozoic Rocks belonging to Abor Volcanics with thrust and more towards south and southeast Miri quartzites
Thrust
Lower Palacozoic Undifferentiated rocks of Biehom and Eocene Marine Gondwanas
and Eocene Thrust
Upper Tertiary Sandstones, pabble horizons, conglomerates Tipams, Siwnlika-Subabsiri,
and shaly sandstones Kimn and Dilang formations
Palaeo Channel
It is described as an earlier river course filled with channel lag or channels fill sediments, which is cut off from the main river. The area under this category forms 53.65 sq.kms of the total geographical area of the study area.
Piedmont Plain (Lower)
It is described as an Alluvium deposited along foot hill zone due to sudden loss of gradient by river/stream in humid and sub-humid climate. Based on the formatin it is divided in to class the top layer is called piedmont plain (upper), the bottom layer is called piedmont plain (Lower) based on the thickness it it divided in to 3 categories 1)shallow 2) moderate 3)deep. The area under this category forms 87.79 sq.kms of the total geographical area of the study area.
Piedmont Plain (Upper)
It is described as an Alluvium deposited along foot hill zone due to sudden loss of gradient by river/stream in humid and sub-humid climate. Based on the formatin it is divided in to class the top layer is called piedmont plain (upper), the bottom layer is called piedmont plain (Lower) based on the t h i c k n e s s i t i t d i v i d e d i n t o 3 c a t e g o r i e s 1)shallow 2) moderate 3)deep. The area under this category forms 91.68 sq.kms of the total geographical area of the study area.
Piedmont Slope
It is described as an Slope formed by bajada and pediment together. The area under this category forms 255.27 sq.kms of the total geographical area of the study area.
River
It is described as an Running water body. The area under this category forms 66.68 sq.kms of the total geographical area of the study area.
River Dry
It is described as an th river course without water is called River Dry. The area under this category forms 169.71 sq.kms of the total geographical area of the study area.
Geomorphology Map of the Study Area
Hydrogeomorphological Unit Area (sqkms)
Alluvial Plain 70.13
Channel Island 29.53
Denudational Hills 126.58
Flood Plain 238.70
Grass Land 24.03
Older Flood Plain 56.77
Palaeo Channel 53.65
Piedmont Plain (Lower) 87.79
Piedmont Plain (Upper) 91.68
Piedmont Slope 255.27
River 66.68
River Dry 169.71
River Terrace 13.42
River Valley 18.18
Structural Hills 2542.62
Valley Fill 0.36
Total 3845.18
PIE CHART SHOWING AREA DISTRIBUTION OF HYDROGEOMORPHOLOGY
53.65
91.68
255.27 87.79 24.03
56.77 238.70
126.58 70.19
29.53 0.36 105.34 155.36
66.68
169.71
13.42 18.18
2281.92
River Terrace
It is described as an Flat upland adjoining the river course. Occurring at different levels and occupied by river-borne alluvium. It indicates the former valley floor. The area under this category forms 13.42 sq.kms of the total geographical area of the study area.
River Valley
It is described as an valley formed due to the river action. The area under this category forms 18.18 sq.kms of the total geographical area of the study area.
Structural Hills
It is described as an Linear to arcuate hills showing definite structural trends. The area under this category forms 2542.62 sq.kms of the total geographical area of the study area.
Valley Fill
It is described as an Valleys of different shapes and sizes occupied by valley fill material (partly detrital and partly weathered material). They are classified into 3 categories –> 1. Shallow (0 – 10 m) , 2. Moderate (10 – 20m), 3. Deep (more than 20 m). The area under this category forms 0.36 sq.kms of the total geographical area of the study area.
REFERENCES
1. Gautam, N.C. and Narayanan, L.R.A., Landsat MSS data for land use / land cover inventory and mapping: A case study of Andhra Pradesh. J. Indian Society of Remote Sensing, 11(3) : 15-28 (1983).
2. Jaiswal, R.K., Saxena, R. and Mukherjee, S., Application of remote sensing technology for land use / land cover change analysis. J. Indian Soc. Remote Sensing, 27(2) : 123-128 (1999).
3. Minakshi, Chaurasia, R. and Sharma, P.K., Land use / land cover mapping and change detection using satellite data – a case study of Dehlon Block, District Ludhiana, Punjab. J. Indian Soc. Remote Sensing, 27(2): 115-121 (1999).
4. Obi Reddy, G.P., Suresh Babu, R. and Sambasiva Rao, M., Hydrogeology and hydrogeomorphological conditions of Anantapur district, using remote sensing data. Indian. Geog. Jour., 69(2) : 128-135 (1994).
5. Perumal, A. Hydromorphological
investigation in parts of Athur Valley, Tamil Nadu, India, using remote sensing data. Ph. D Thesis (unpublished) University of Roorkee (1990).
6. Prithviraj, N., Geomorphic studies in Sarada river basin, Visakapattanam District, Andhra
Pradesh, India. Ph.D Thesis (unpublished), Andhra University, Visakhapatnam, India (1980).
7. Vaidyanathan, R. Geomor phology of Cuddapah basin. Jour. Indian Geosciences Assoc., 4: 29-36 (1964).
8. Remote Sensing for Sustainable
Development- Indian Perspective., U.R. Rao , Natural Resources Management- a new perspective , first edition (1992).
9. Anderson, J.R., Hardy, E.T., Roach, J.t. and Witmer, R.E., A Landuse and Landcover Classification system for use with Remote Sensor Data, USGS Prof. Paper No. 466: 1-26 (1976).
10. Bhan, S.K. Bhattacharya, A., Guha, P.K. & Ravindran, K.V., IRS-1A applications in Geology and Mineral Resources, Curr.Sci., Special 61(3-4): 247 (1991).
11. R.S. Rao, G. Meher Baba, G.V.A.