RP-HPLC Method Development and Validation for the Simultaneous Estimation of Atenolol and Indapamide in Pharmaceutical Tablet Dosage Form
9
0
0
Full text
(2) K.Madhavi et al / Int. J. of Pharmacy and Analytical Research Vol-3(1) 2014 [109-117]. Fig:1 Atenolol. MATERIALS AND METHODS Chemicals/ Reagents and Solvents Atenolol-25 mg and Indapamide-2.5mg were obtained from, ZYDUS MEDICA Health Care. Ltd. Ahmedabad, Double Distilled Water (HPLC grade), Methanol (HPLC grade), Acetonitrile (HPLC grade), orthophosphoric acid and Potassium-dihydrogen phosphate were of reagent grade. The pharmaceutical preparations of combination of Atenolol & Indapamide that is ATEN-D tablet (ZYDUS MEDICA Health Care. Ltd. Ahmedabad).. Instrumentation and Equipments The HPLC analysis was accomplished on WATERS high pressure liquid chromatograph outfitted with 515 reciprocating dual column HPLC pump, a manually operating Rheodyne injector with 20μL sample loop, X-terra C8 4.6mm x 150mm analytical column reversed-phase material of 5μ size and a 2487. Fig:2 lndapamide model UV-Visible detector. All the parameters of HPLC were controlled by N 2000 chromatographic system software. Other instruments used were TECHCOMP UV-Vis spectrophotometer of model 2310, Shimadzu electronic balance of model XEX200, ADWA of model AD102U digital pH meter and ENERTECH of model SE60US ultrasonic bath sonicator. ANALYTICAL METHOD DEVELOPMENT Optimization of UV conditions A waters symmetry X-terra C8 (4.6mm x 150mm, 5m) was used for chromatographic separation. Mobile phase and sample solution were filtered through a 0.45μm membrane filter and degassed. The mobile phase composed of pH3 Buffer (Potassium di hydrogen phosphate):Acetonitrile ( 40:60 ) at flow rate 0.7 mL/min with run time 5mins detection of both drugs was carried out at 240nm.. Fig.3. Isobestic point of Atenolol and indapamide. Optimized Method Parameters Mobile Phase : Phosphate buffer (3.0 pH): Acetonitrile(40:60) Column (Stationary Phase) : X-terra(C8) (4.6mm x 150mm, 5m) Flow rate (ml/min) :0.7 Column temperature (°C) : Ambient Volume of injection loop (l) : 20 Detection wavelength (nm) :240 Drug RT (min) : Atenolol – 2.1 Indapamide-3.6.
(3) 111 K.Madhavi et al / Int. J. of Pharmacy and Analytical Research Vol-3(1) 2014 [109-117]. Figure- 4 Optimized chromatogram. Procedure for preparation of solution Preparation of buffer. Sample Solution Preparation. Take 1000ml of HPLC grade water. Dissolve 2.72 grams of Potassium di hydrogen phosphate salt and Adjusted the pH to 3.0 with orthophosphoric acid.. Accurately weighed and transferred 58.8 mg of Atenolol and Indapamide tablet powder into a 100ml clean dry volumetric flask and added about 70 ml of diluent. It was sonicated to dissolve it completely and made volume up to the mark with the same diluent. (Stock solution). From the above stock solution, 3 ml of the solution was pipetted into a 10 ml volumetric flask and diluted up to the mark with diluent.. Preparation of mobile phase A mixture of above prepared buffer 400 ml (40%), and 600 ml of HPLC grade Acetonitrile (60%) were mixed and degassed in ultrasonic water bath for 5 minutes. The mobile phase was filterred through 0.45 µ filter under vacuum.. Procedure Diluent Preparation Use the Mobile phase as Diluent.. ASSAY Preparation of the Atenolol and Indapamide standard & sample solution Preparation of Standard Solution Accurately weighed and transferred 58.8mg of atenolol and indapamide working standard into a 50ml clean dry volumetric flask and added about 30ml of diluent. It was sonicated to dissolve completely and made volume up to the mark with the same diluent. (Stock solution) From the above stock solution, 10ml of the solution was pipetted into a 50 ml volumetric flask and diluted up to the mark with diluent. . From this, 3 ml of the solution was pipetted into another 10ml volumetric flask and diluted up to the mark with diluent... 20 µL of the standard and sample solutions were injected into the chromatographic system and areas for the Atenolol and Indapamide peaks were measured. %Assay was calculated by using the formulae.. Calculation Assay % = AT. WS. DT. P. Avg. Wt. --------- x -------- -x ------- x ------- x ------------- X 100 AS. DS. WT. 100. Label Claim. Where: AT = Average area counts of sample preparation. AS = Average area counts of standard preparation. WS = Weight of working standard taken in mg. P = Percentage purity of working standard LC = LABEL CLAIM mg/ml.. www.ijpar.com.
(4) 112 K.Madhavi et al / Int. J. of Pharmacy and Analytical Research Vol-3(1) 2014 [109-117]. ANALYTICAL METHOD VALIDATION The HPLC method was validated in accordance with ICH guidelines.. 10 x ASD/S, Where, ‘ASD’ is the average standard deviation and ‘S’ is the slope of the line.. Robustness Accuracy Accuracy was carried out by % recovery studies at three different concentration levels. To the preanalyzed sample solution of ATEN and INDA a known amount of standard drug powder of ATEN and INDA were added at 50, 100 and 150 % level.. Robustness was evaluated by making deliberate variations in few method parameters such as variation of wave length; flow rate and change in mobile phase composition. The robustness of the method was studied for ATEN and INDA.. RESULTS Selection of Chromatographic Conditions and Optimization of Mobile Phase. Precision The system precision of the method was verified by five replicate injections of standard solution containing ATEN and INDA. The method precision was carried out the analyte five times using the proposed method. Repeatability was measured by multiple injections of a homogenous sample of ATEN and INDA.. Linearity The linearity was determined separately for ATEN and INDA. Linearity of the method was studied by injecting 5 concentrations of both drugs prepared in methanol and calibration curves were constructed by plotting peak area against the respective concentrations. Limit of detection and Limit of quantitation Sensitivity of the proposed method was estimated in terms of Limit of Detection (LOD) and Limit of Quantitation (LOQ). LOD = 3.3 x ASD/S and LOQ =. Mobile phase was optimized to separate ATEN and INDA using Symmetry C8 column (150 mm x 4.6 mm i.d.,5 μm). Initially, ACN and phosphate buffer in the equal proportions were tried as mobile phase but the splitting of the peaks for both these drugs was observed. Therefore, after adjustment of pH of mixed phosphate buffer to 3.0 with ortho-phosphoric acid, and mobile phase composition (ACN and phosphate buffer in 40:60 % v/v) was tried for resolution of both drugs. Good resolution and symmetric peaks were obtained for both drugs when the pH of the mobile phase (buffer) was adjusted to 3.0. The flow rate of the mobile phase was 0.7 mL min-1. Under optimum chromatographic conditions, the retention time for ATEN and INDA was found to be 2.1 and 3.6 min, respectively when the detection was carried out at 240 nm. A typical chromatogram of two drugs is shown in (Figure -4). Table-1 Accuracy data for Atenolol and Indapamide:. Atenolol. Indapamide. Injection. 50%. 100%. 150%. 50%. 100%. 150%. Inj-1. 3058153. 4141888. 5193545. 464090. 614631. 751157. Inj-2. 3086875. 4139942. 5991256. 460733. 617416. 764616. Inj-3. 3039485. 4128889. 5134625. 463249. 602389. 774998. AVG. 3061504. 4136906. 5151290. 462690.7. 611478.7. 763590.3. S.D. 23872.09. 7011.059. 36865.34. 1746.758. 7994.097. 11953.55. %R.S.D. 0.78. 0.17. 0.72. 0.38. 1.31. 1.57. www.ijpar.com.
(5) 113 K.Madhavi et al / Int. J. of Pharmacy and Analytical Research Vol-3(1) 2014 [109-117]. Table-2 Accuracy(Recovery) result for Atenolol and Indapamide : Drug Name. Spike level. Area 3028171. 50% Atenolol. 100% 150%. Indapamide. Amount Added(mg). 50% 100% 150%. 90. Amount Found(mg). % Recovery. 89.8. 99.23. 4136906. 120. 121.2. 102. 5151290. 150. 150.9. 101. 4.524. 101.33. 462690. 4.50. 611478. 6. 763590. 7.50. 5.98 7.47. 99.33 99.33. Table-3 System Precision Result for Atenolol and Indapamide: S.No Injections Area of Atenolol Area of Indapamide 1. Injection-1. 2015090. 1030445. 2. Injection-2. 2100046. 1028130. 3. Injection-3. 2065369. 1001212. 4 5. Injection-4 Injection-5. 2096138 2103317. 1017377 1031363. Average. 2075992. 1021705.4. Standard deviation. 37259.27. 12744.02. %RSD. 1.79. 1.27. Table-4 Method precision (reproducibility) of Atenolol and Indapamide: S.No Injections Area of Atenolol Area of Indapamide 1. Injection-1. 2038600. 1086110. 2. Injection-2. 2069689. 1066922. 3. Injection-3. 2086267. 1095482. 4. Injection-4. 2147805. 1085921. 5. Injection-5. 2075926. 1083763. Average. 2083657.4. 1083640. Standard deviation. 40021.19. 10380.79. %RSD. 1.92. 0.96. www.ijpar.com. % of mean recovery. 100.74. 99.93.
(6) 114 K.Madhavi et al / Int. J. of Pharmacy and Analytical Research Vol-3(1) 2014 [109-117]. Table-5 LINEARITY RESULTS OF Atenolol and Indapamide: ATENOLOL. INDAPAMIDE. Conc(mcg/ml). Area. Conc(mcg/ml). Area. 20. 913226. 1. 29279. 40. 1482271. 2. 153131. 60 80. 2147805 2747059. 3 4. 312399 454118. 100. 3416501. 5. 613618. Figure-5: Linearity Graphs of Atenolol and Indapamide Linearity graph of Atenolol. ABSORBANCE AREA. CALIBRATION CURVE 700000. y = 14696x - 12839 R² = 0.999. 600000 500000 400000 300000 200000 100000 0 0. 1. 2. 3. 4. 5. 6. … Linearity graph of Indapamide. ABSORBANCE AREA. CALIBRATION CURVE 700000 600000. y = 146967x - 128391 R² = 0.9984. 500000 400000 300000 200000 100000 0 0. 1. 2. 3. …. www.ijpar.com. 4. 5. 6.
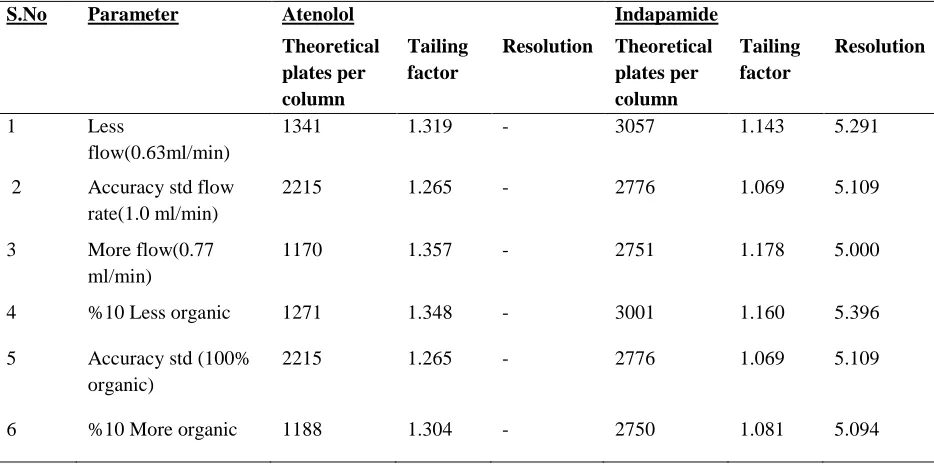
(7) 115 K.Madhavi et al / Int. J. of Pharmacy and Analytical Research Vol-3(1) 2014 [109-117]. Table-6 Results of LOD and LOQ. S.No. S.No. Drug name. Standard deviation. Slope. LOD. LOQ. 1. Atenolol. 21246. 313566. 0.223595. 0.677561. 2. Indapamide. 12744. 146966. 0.286155. 0.867139. Table -7 Robustness Result For Atenolol and Indapamide At Different Condition Parameter Atenolol Indapamide Theoretical plates per column 1341. Tailing factor. Resolution. Tailing factor. Resolution. -. Theoretical plates per column 3057. 1.319. 1.143. 5.291. 1. Less flow(0.63ml/min). 2. Accuracy std flow rate(1.0 ml/min). 2215. 1.265. -. 2776. 1.069. 5.109. 3. More flow(0.77 ml/min). 1170. 1.357. -. 2751. 1.178. 5.000. 4. %10 Less organic. 1271. 1.348. -. 3001. 1.160. 5.396. 5. Accuracy std (100% organic). 2215. 1.265. -. 2776. 1.069. 5.109. 6. %10 More organic. 1188. 1.304. -. 2750. 1.081. 5.094. The accuracy of the method studied at three different concentration levels i.e. 50 %, 100 % and 150 % showed acceptable % recoveries in the range of 100.74 % for atenolol and 99.93 % for indapamide.. injecting five concentrations of both drugs prepared in methanol and calibration curves were constructed by plotting peak area against the respective concentrations. The ATEN and INDA followed linearity in the concentration range of 20-100 μg mL1 and 1-5 μg mL-1; respectively.. Precision. Limit of detection and Limit of quantitation. The precision study of ATEN and INDA was evaluated on the basis of % RSD value was found to be in the range 0.7 – 1.8%respectively. As the RSD values were < 2% therefore developed method was precise.. The LOD was found to be 0.223595 and 0.286155 μg, respectively. The LOQ for ATEN and INDA was found to be and 0.677561 and 0.867139 μg, respectively. The low values of LOD and LOQ indicates high sensitivity of the method.. Linearity. Robustness study. The linearity was determined separately for ATEN and INDA. Linearity of the method was studied by. Robustness of the method was studied by making deliberate changes in the chromatographic conditions and the effects on the results were examined. The low. RESULTS AND DISCUSSION Accuracy. www.ijpar.com.
(8) 116 K.Madhavi et al / Int. J. of Pharmacy and Analytical Research Vol-3(1) 2014 [109-117]. value changes of theoretical plates, tailing factor indicating robustness of the method. When the method was performed by two different analysts under the same experimental and environmental conditions it was found to be rugged and % RSD (less than 2 %) indicating ruggedness of the method.. Analysis of marketed tablet formulation 3 replicates of the samples solutions (20 μL) were injected for quantitative analysis. The amounts of Assay Results Drug Atenolol. ATEN and INDA estimated were found to 100.74 % and 99.93 %, respectively. A good separation and resolution of both drugs indicates that there was no interference from the excipients commonly present in pharmaceutical formulations. System Suitability Test The system suitability parameters such as resolution, number of theoretical plates and tailing factor were studied... Table- 8 ASSAY RESULTS Amount present/tablet 25 mg 2.5mg. Indapamide. % of Assay 100.2 99.11. Table-9 System Suitability parameter System suitability parameters. Atenolol. Retention time(min. Indapamide. 2.1. Tailing factor. 1.332. Theoretical plates number. 1242. Resolution. -. 3.6 1.1405 2889 5.195. CONCLUSION. ACKNOWLEDGEMENTS. The developed RP-HPLC method is simple, precise, accurate, selective and reproducible. The method has been found to be adequately rugged and robust and can be used for simultaneous determination of Atenolol and Indapamidel in tablet formulation. The method was validated as per ICH guidelines. I like thankful to Pharmatech research labotatories., Hyderabad, India for providing the gift samples of Atenolol and Indapamide. And also to the principal Dr.K.Rajeshwar Dutt, Smt. Sarojini Ramulamma College of Pharmacy, Mahabubnagar, Andhra pradesh, India and special thanks for Ms.K.Deepti madam & Ms.Ramathilagam madam as well as my friends who helped during the project work.. REFERENCES [1] Indian pharmacopeia 2007. [2] British pharmacopeia 2007 vol-I . [3] Martindale the complete drug reference, thirty sixth edition. [4] Merck index, 12th edition [5] ICH, Q1A (R2) Stability testing of new drug substances and products, in: International Conference on Harmonization, IFPMA, Geneva, (2003). [6] Practical HPLC method development Lloyd R.Snyder, Joseph J. Kirkland, Joseph L. Glajch, second edition. www.ijpar.com.
(9) 117 K.Madhavi et al / Int. J. of Pharmacy and Analytical Research Vol-3(1) 2014 [109-117]. [7] http://www.rxlist.com/lozol-drug.htm [8] MeSH Indapamide [9] K. Basavaiah, U. Chandrashekar, Bulgarian Chem. Comm. 38(2) (2006), 104-111. [10] L. Dong, J. Huang, Chromatographia 64(9-10) (2006), 583-586. [11] R. Ceresole, M. A. Moyano, M. T. Pizzorno, A. I. Segall, J. Liq. Chromatography Related Techno. 29(20) (2006), 3009-3019. [12] L. Tong, Dan-dan Qi, Kai-shun Bi, Xiao-hui Chen, Zhongguo Xinyao Yu Linchuang Zazhi 25(11) (2006), 851-855. [13] A. Mohammadi, I. Haririan, N. Rezanour, L. Ghiasi, R. B. Walker, J. Chromatogr.A 1116 (2006) 153-157. [14] A. Weich, D. Carvalho de Oliveira, J. de Melo, K. Goebel, C.M.B. Rolim, Latin Am. J. Pharm. 26(5) (2007), 765-770). [15] T. Jiang, W. Wang, X. Zhang, Zhongguo Yaoshi (Wuhan, China) 11(9) (2008), 1068-1069. [16] S. Saraf, S. Saraf, G. Garg, Indian Pat. Appl. IN 2007MU00559 A 20081121, (2008). [17] Yan-lin Zhu, Jing Zhang, Dan-bi Tian, Huaxue Shiji 30(7) (2008), 512-514. [18] L. Li, X. Zhang, Yiyao Daobao 27(6) (2008), 714. [19] Y. Tang, L.Gu, Zhongnan Yaoxue 7(5) (2009), 341-343 [20] M. J. Legorburu, R. M. Alonso, R. M. Jimenez, E. Ortiz, J. Chromatographic Sci. 37(8) (1999), 283-287. [21] K. Abdussaleem, D. Boopathy, P. Perumal, Int. J. PharmTech Res. 2(1) (2010), 471-474. [22] A. B. Thomas, U. B. Chavan, R. K. Nanda, L. P. Kothapalli, S. N. Jagdale, S. B. Dighe, A. D. Deshpande, Acta Chromatographica 22(2) (2010), 219-226. [23] H. Jogia, U. Khandelwal, T. Gandhi, S. Singh, D. Modi, J. AOAC Int. 93(1) (2010), 108-115. *************************. www.ijpar.com.
(10)
Figure
Related documents
The study ’ s primary objective was to demonstrate the ability of the harmonic scalpel (H) to reduce intra- operative conversion rates compared to the conventional monopolar
BN: Boolean Network; CTSG: Controlled State Transition Graph; EV: Electric Vehicle; FVS: Feedback Vertex Set; GA: Genetic Algorithm; GB: Gigabytes; GBML: Genetics-Based
suis cells were detected on PAECs incubated with the negative control preparation (Figure 5d).. To assess whether the presence
AGDL: Agglomerative clustering on a directed graph; AGMFit: Affiliation graph model fitting; CD: Community discovery; CDlib: Community discovery library; CDTB: Community
In this paper we describe how a participatory, multi- method, continuous informed consent process developed by researchers, study participants and community stake- holders during
• The cattle that showed clinical signs before day 16 (early cases) stayed for a long time in the herd, and were culled only after a few days, while cattle that became sick later
