Engineering and Technology Journal e-ISSN: 2456-3358
Volume 04 Issue 10 October- 2019, Page No.-636-644
DOI:10.33826/etj/v4i10.01, I.F. - 4.449
© 2019, ETJ
Application of Expert Tool in Optimizing and Predicting Mild Steel Weld
Reinforcement Form Factor (WRFF) in Tig Welding Process
Nweze S
Department of Production Engineering University of Benin Benin City, Edo State, Nigeria
ABSTRACT: Welding is a process designed to permanently join pieces of materials together to produce weldments which significantly enhance the strength, reliability, and integrity of structural materials. It is imperative to know that the weld reinforcement form factor (WRFF) plays a key role in enhancing these strength properties of the fusion zone if the input parameters are optimized. So in this research work, the process parameters to be optimized are current, voltage, welding speed and gas flow rate. The research study focused on weld reinforcement form factor using response surface methodology. Mild steel plate measuring 60x40x10mm was used for the experiment. And from this study a Mathematical model for weld reinforcement form factor applicable to TIG four input process parameters (voltage, current, welding speed and gas flow rate) was developed. The results obtained showed that optimum WRFF was achieved when a current of 140.01 Amp, voltage of 20.00 volt, welding speed of 150.00mm/min, and gas flow rate of 12.01 L/min was used during welding operation of steel plate of 10mm thick, which produced a Weld reinforcement form factor (WRFF) of 2.33611mm. This solution was selected at a desirability value of 97.30%.
KEYWORDS: 3D plot, weld, RSM, WRFF, TIG
INTRODUCTION
To have real control over the strength of welded products, precise relationships between the process parameters and the bead parameters controlling the bead shape need to be established. Sudhakaran et al (2012) were of the opinion that the quality of a welded joint is directly influenced by the welding input parameters. Deepak et al (2011) investigated the effect of welding parameters on bead geometry. Gadewar et al (2010) investigated the effect of process parameters of TIG welding like weld current, gas flow rate, work piece thickness on the bead geometry of SS304.Good weldability of metals is judged by the quality of their bead geometry or welded joint geometry. It was found that the process parameters considered affected the mechanical properties to a great extent. Kumar (2011) stated that TIG weld quality is strongly characterized by the weld bead geometry and the bead geometry as well as the shape relationships affect the load carrying capacity as well as the number of passes needed to fill the groove of a welded joint. Parikshit (2007) developed a relationship between welding parameters and weld bead profile parameters of GTAW welded experimental data by using conventional regression analysis and the neural network based approach. . Ravikumar and Vijian (2014) said that welding quality is strongly characterized by the weld bead geometry which plays an important role in determining the mechanical properties of the welded joints. According to Achebo and Odinikuku (2015), welding is a process designed to permanently join pieces of materials together to produce weldments which significantly enhance the strength,
reliability, and integrity of structural materials. It is imperative to know that the weld reinforcement form factor (WRFF) plays a key role in enhancing the strength of the fusion zone if the input parameters are optimized. According to Dhas and Satheesh, (2013), the welded joint is considered to be sound and economical if it has a maximum penetration, minimum bead width, reinforcement and dilution. The quality of weld deposit also known as weld bead depends on the metallurgical formulation of its bead geometry(Omajene, 2014)
In this study, the Response Surface Methodology is used to optimize and predict the WRFF. This investigation is geared towards improving the quality and strength properties of weld joint.
METHODOLOGY
The process parameters to be optimized are current, voltage, welding speed and gas flow rate. The research study focused on weld reinforcement form factor using response surface methodology (RSM) to optimize and predict the output stated above, RSM was selected because of its capability to accommodate complex experimental designs. TIG welding process was adopted for this research, we used 100% Argon Shielding Gas to provide good protection of our mild steel samples against atmospheric contamination. 150 pieces of mild steel plate measuring 60x40x10mm was used for the experiment. This experiment was repeated 30 times producing a total of one hundred and fifty welded joints. For each run, five specimens were used to determine the weld penetration Size factors and the average recorded
“Application of Expert Tool in Optimizing and Predicting Mild Steel Weld Reinforcement Form Factor (WRFF) in
Tig Welding Process”
respectively. Table 1 shows the weld process parameter, figure 1a and b shows the TIG welding machine and the argon gas cylinder used to carry out this research respectively. Face Mask, Google’s and Hand Gloves were the personal safety kits used for protection against welding hazards
The various experimental stages required in the research are outlined below.
Stage 1: Table 1 shows the Process parameters ranges for Tungsten Inert Gas Welding process which are the input parameters include the gas flow rate, voltage, current and welding speed (see Table 2) were identified and put in a matrix layout. This matrix layout was developed using the Response surface Methodology (RSM) to create a design of experiment. The central composite tool was selected for our RSM process.
Table1. welding process parameters limits
Parameters Unit Symbol Coded value Coded value
Low(-1) High(+1)
Current Amp A 140 160
Gas flow rate Lit/min F 12 14
Voltage Volt V 20 24
Welding speed cm/min S 150 170
The selected input parameters have the upper (+)and lower limits (-).The limits of the four welding variables are shown in table 1
Stage 2: The Next stage involved carrying out experimentsusing each combination of the input parameters as shown in
Table 1, to weld mild steel specimens of dimension 60mm x 40mm x 10mm with the aid of the TIG welding apparatus, as shown in Fig 1a and b.
(a) (b)
Fig 1: TIG welding machine and Sample Weldments
The corresponding weld width and reinforcement were measured using a digital Vernier caliper to get the weld width and reinforcement whereas the WRFF was obtained
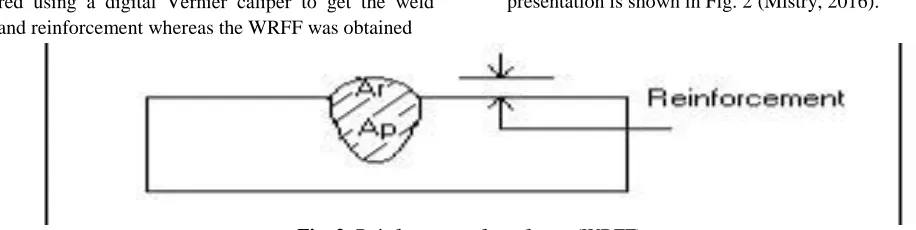
from Equation (1) as shown in Table 2. The schematic presentation is shown in Fig. 2 (Mistry, 2016).
Fig. 2: Reinforcement form factor (WRFF)
Weld reinforcement form factor (WRFF) = W/R = Weld width/Reinforcement ……….(1) Where W = weld width and R= reinforcement
“Application of Expert Tool in optimizing and Predicting Mild Steel Weld Reinforcement Form Factor
(WRFF) in Tig Welding Process”
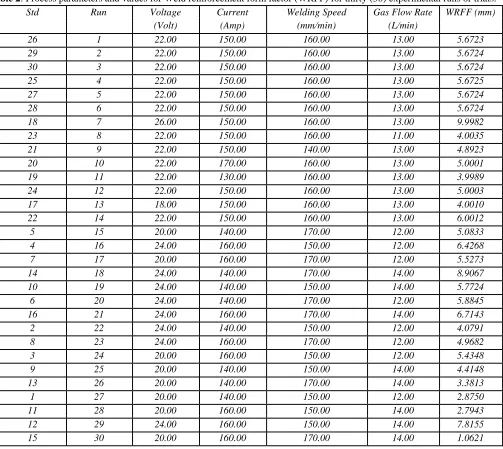
Table 2: Process parameters and values for Weld reinforcement form factor (WRFF) for thirty (30) experimental runs or trials.
Std Run Voltage Current Welding Speed Gas Flow Rate WRFF (mm)
(Volt) (Amp) (mm/min) (L/min)
26 1 22.00 150.00 160.00 13.00 5.6723
29 2 22.00 150.00 160.00 13.00 5.6724
30 3 22.00 150.00 160.00 13.00 5.6724
25 4 22.00 150.00 160.00 13.00 5.6725
27 5 22.00 150.00 160.00 13.00 5.6724
28 6 22.00 150.00 160.00 13.00 5.6724
18 7 26.00 150.00 160.00 13.00 9.9982
23 8 22.00 150.00 160.00 11.00 4.0035
21 9 22.00 150.00 140.00 13.00 4.8923
20 10 22.00 170.00 160.00 13.00 5.0001
19 11 22.00 130.00 160.00 13.00 3.9989
24 12 22.00 150.00 160.00 13.00 5.0003
17 13 18.00 150.00 160.00 13.00 4.0010
22 14 22.00 150.00 160.00 13.00 6.0012
5 15 20.00 140.00 170.00 12.00 5.0833
4 16 24.00 160.00 150.00 12.00 6.4268
7 17 20.00 160.00 170.00 12.00 5.5273
14 18 24.00 140.00 170.00 14.00 8.9067
10 19 24.00 140.00 150.00 14.00 5.7724
6 20 24.00 140.00 170.00 12.00 5.8845
16 21 24.00 160.00 170.00 14.00 6.7143
2 22 24.00 140.00 150.00 12.00 4.0791
8 23 24.00 160.00 170.00 12.00 4.9682
3 24 20.00 160.00 150.00 12.00 5.4348
9 25 20.00 140.00 150.00 14.00 4.4148
13 26 20.00 140.00 170.00 14.00 3.3813
1 27 20.00 140.00 150.00 12.00 2.8750
11 28 20.00 160.00 150.00 14.00 2.7943
12 29 24.00 160.00 150.00 14.00 7.8155
15 30 20.00 160.00 170.00 14.00 1.0621
Stage 3: Preprocessing of the experimental data is carried out. Design Expert 7.0 software was instructed to process the data gotten from experimental means, where the significance of the model was determined using analysis of variance (ANOVA) in table 3, Differential Functioning of Items and Texts (DFITS) a measure of the influence of each
Table 3: Analysis of Variance Components
observation on the values fitted. The significance of the input process parameters for the two responses was determined using the P-value of the lack of fit and the input process parameters were compared using a significance level of significance of Alpha α = 0.05. Table 4 shows the RSM design summary for optimizing weld parameters.
Variation Degree of Sum of Squares Mean Square Fisher Ratio Source Freedom Df SS
MS
F-value
Error of n-2 cni
SSE
residuals SSE
( yij y
ij)
2
MSE
n 2i1 j 1
Regression 1 c ni SSR MSR
SSR
(
y
ij
y
)
2MSR
1F
MSEi1 j 1
“Application of Expert Tool in optimizing and Predicting Mild Steel Weld Reinforcement Form Factor (WRFF) in
Tig Welding Process”
Lack of fit C -2
2 1 1
)
(
ij c i ni j iji
y
y
SSLF
2
c
SSLF
MSLF
MSPE
MSLF
F
*
Total n-1
2 1 1
)
(
c i ni j ij ijy
y
SSTD
- - RESULTSThe model summary which shows the factors and their lowest and highest values including the mean and standard deviation is presented as shown in Table 4; Result of Table 4 revealed that the model is of the quadratic type which
Table 4: RSM design summary for optimizing weld parameters
requires the polynomial analysis order as depicted by a typical response surface design. The minimum value of weld reinforcement form factor (WRFF) was observed to be 1.062mm, with a maximum value of 9.998mm, mean value of 5.269 and standard deviation of 1.715.
Study type Response surface Run 30 Initial Design Central composite Blocks No Blocks Design Model Quadratic
Factor Name Units Type Low High Low High Mean Std. Actual Actual Coded Code Dev.
d
A Voltag Volt Numeri 20.00 24.00 -1.00 1.00 22.000 1.78
e c
9
B Curren Amp Numeri 140.00 160.00 -1.00 1.00 150.00 8.94
t c
0 4
C W.S M/mi Numeri 150.00 170.00 -1.00 1.00 160.00 8.94
n c
0 4
D GFR L/min Numeri 12.00 14.00 -1.00 1.00 13.000 0.89
c
4
Respons Name Units Obs Analysis Minimu Maximu Mean Std. Rati Tran Model
e
m m Dev. o s
Y1 WRFF mm 30 Polynomia 1.062 9.998 5.269 1.715 9.41 None Quadrati
l 4 c
In assessing the strength of the quadratic model towards minimizing the weld reinforcement form factor (WRFF), one way analysis of variance (ANOVA) was done for the response variable and result is presented in Table 5. Analysis of variance was needed to check whether or not the model is significant and also to evaluate the significant
contributions of each individual variable and the combined and quadratic effects towards each response.
In assessing the strength of the quadratic model towards minimizing the weld reinforcement form factor (WRFF) one way analysis of variance (ANOVA) was done for each response variable and result is presented in Table 5.
Table 5: ANOVA table for validating the model significance towards maximizing WRFF Response 1WPSF
ANOVA for Response Surface Quadratic Model
Analysis of Variance table [Partial Sum of Squares-Types III]
Source Sum of df Mean F P-Value Square Square Value Prob>F
Model 80.42 14 5.74 11.01 <0.0001 Significant A-Voltage 42.64 1 42.64 81.74 0.0001
“Application of Expert Tool in optimizing and Predicting Mild Steel Weld Reinforcement Form Factor (WRFF) in
Tig Welding Process”
AB 0.31 1 0.31 0.59 0.4545 AC 0.51 1 0.51 0.97 0.3404 AD 14.28 1 14.28 27.39 0.0001 BC 6.65 1 6.65 12.75 0.0028 BD 4.54 1 4.54 8.71 0.0099 CD 0.71 1 0.71 1.37 0.2602
A2 2.20 1 2.20 4.22 0.0577
B2 3.20 1 3.20 6.14 0.0256
C2 0.30 1 0.30 0.58 0.4588
D2 3.19 1 3.19 6.12 0.0258
From the result of Table 5, the model F-value of 11.01 implies the model is significant. There is only a 0.01% chance that a "Model F-Value" this large could occur due to noise. Values of "Prob > F" less than 0.0500 indicate model
terms are significant. In this case A, AD, BC, BD, B
2
, D2
are significant model terms. Values greater than 0.1000 indicate the model terms are not significant. If there aremany insignificant model terms (not counting those required to support hierarchy), model reduction may improve your model.
To validate the adequacy of the model based on its ability to minimize the weld reinforcement form factor (WRFF), the goodness of fit statistics presented in Table 6 was employed.
Table 6: GOF statistics for validating model significance in minimizing WRFF
Std. Dev 0.72 R-Squared 0.9113
Mean 5.27 Adj R-Squared 0.8286
C.V% 13.71 Pred R-Squared 0.4893
PRESS 45.07 Adeq Precision 15.487
Coefficient of determination (R-Squared) value of 0.9113 as observed in Table 6 shows the strength of response surface methodology and its ability to minimize the weld reinforcement form factor (WRFF). Adjusted (R-Squared) value of 0.8286 as observed in Table 6 indicates a model with 82.86% reliability. Adeq Precision measures the signal to noise ratio. A ratio greater than 4 is desirable. Adequate precision values of 15.487 as observed in Table 6 indicate an adequate signal. This model can be used to navigate the design space and minimize the weld reinforcement form factor (WRFF).
The optimal equation which shows the individual effects and combine interactions of the selected variables against the mesured responses (WRFF) is presented based on the coded and the actual variables in equation (2) and (3) The coded equation for:
WRFF = +5.67 +1.33*A +0.098*B +0.17*C +0.11*D +0.14*A*B +0.18*A*C +0.94*A*D -0.64*B*C -0.53*B*D
-0.21*C*D +0.28*A2 -0.34B2 -0.10C2 -0.34D2……… (2)
Final equation in terms of actual factors:
WRFF= +254.93407-11.05438*A +2.60628*B +1.39875*C +9.95289*D +6.93125E-003*A*B +8.89000E-003*A*C
+0.47244*A*D -6.44625E-003*B*C -0.053276*B*D - 0.021126*C*D +0.070840*A2 -3.41665E-003B2 -1.04852E- 003C2 -0.34106D2 ………. (3)
Where, A=voltage, B=current, C=welding speed, D=gas flow rate, A*B =voltage*current, A*C= voltage*welding speed, A*D= voltage*gas flow rate, B*C= current*welding speed, B*D= current*gas flow rate, C*D= welding
speed*gas flow rate, A2= voltage2, B2= current, C2=
welding speed2 and D2= gas flow rate2
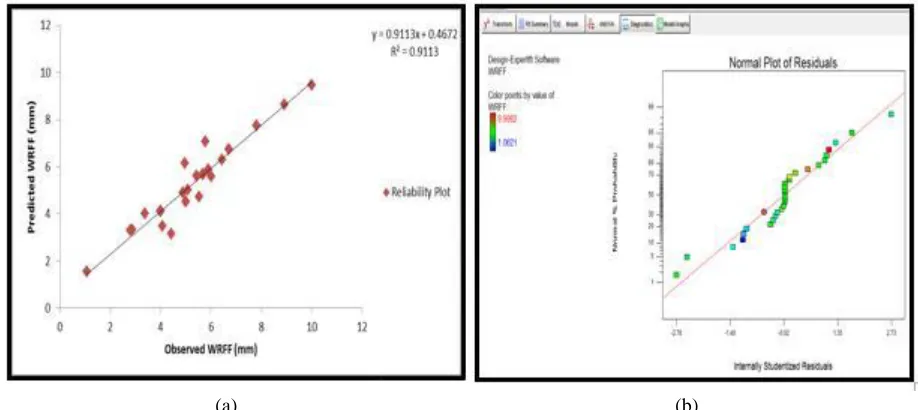
To asses the accuracy of prediction and established the suitability of response surface methodology using the quadratic model, a reliability plot of the observed and predicted values of the WRFF response were obtained as
presented in Fig.3a.The high coefficient of determination (r2 =0.9113) as observed in Fig.3a was used to established the suitability of response surface methodology in minimizing the weld reinforcement form factor.
To accept any model, its satisfactoriness must first be checked by an appropriate statistical analysis.
To diagnose the statistical properties of the model, the normal probability plot of the WRFF residual presented in Fig 3b was employed.
“Application of Expert Tool in optimizing and Predicting Mild Steel Weld Reinforcement Form Factor (WRFF) in
Tig Welding Process”
(a) (b)
Fig.3: Reliability plot of observed vs predicted WRFF and Normal probability plot of studentized residuals for WRFF
The normal probability plot of studentized residuals was employed to assess the normality of the calculated residuals. The normal probability plot of residuals which is the number of standard deviation of actual values based on the predicted values was employed to ascertain if the residuals (observed – predicted) follows a normal distribution. It is the most significant assumption for checking the sufficiency of a statistical model. Results of Fig.3b revealed that the computed residuals are approximately normally distributed an indication that the model developed is satisfactory. In addition, result of the normal probability plot of residual also indicates that the data used are devoid of possible outliers.
Fig.4 shows a 3 dimensional surface plot on contour plot which was employed to give a clearer concept of the response surface and the relationship between the variables on the response. As the color of the curved surface gets darker, the weld reinforcement form factor (WRFF) decreases proportionately. The presence of a colored hole at the middle of the upper surface gave a clue that more points lightly shaded for easier identification fell below the surface. To study the effects of combine variables on each response; weld reinforcement form factor (WRFF) 3D surface plots is presented in Fig 4 we employed.
Fig. 4:Effect of current and voltage on weld reinforcement form factor (WRFF)
A 3 dimensional surface plot on contour plot was employed to give a clearer concept of the response surface. The presence of a colored hole at the middle of the upper surface gave a clue that more points lightly shaded for easier identification fell below the surface.
The 3D surface plot as observed in Figures 4.3 a-c shows the relationship between the input variables (voltage, current, welding speed and gas flow rate) and the response variables (weld penetration size factor (WPSF), weld reinforcement form factor (WRFF) and % dilution). It is a 3
“Application of Expert Tool in optimizing and Predicting Mild Steel Weld Reinforcement Form Factor (WRFF) in
Tig Welding Process”
dimensional surface plot which was employed to give a clearer concept of the response surface. As the color of the curved surface gets darker, the weld penetration size factor (WPSF) gets higher while the weld reinforcement form factor (WRFF) and the % dilution decreases proportionately. The presence of a colored hole at the middle of the upper surface gave a clue that more points lightly shaded for easier identification fell below the surface. Finally, numerical
optimization was performed to ascertain the desirability of the overall model.
In the numerical optimization phase, we ask design expert to minimize the weld reinforcement form factor (WRFF) while also determining the optimum value of voltage, current, welding speed and gas flow rate. The interphase of the numerical optimization showing the goal of the objective function is presented in Fig. 5.
Fig. 5: Interphase of numerical optimization model for minimizing WRFF
The interface of numerical optimization defines the objective function (minimize or maximize) as the case maybe, defines the lower and upper limit of the response with the level of importance indicated. For a minimization
case, the weight leans towards the lower limit as seen above for WRFF.
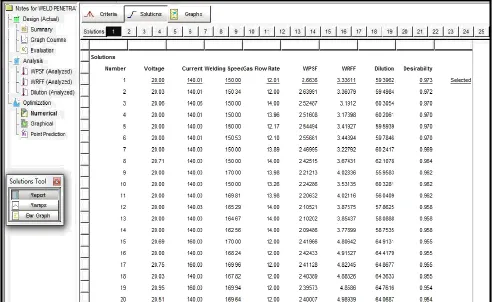
The numerical optimization produces about twenty (20) optimal solutions which are presented in Fig. 6.
Fig. 6: Optimal solutions of numerical optimization model
“Application of Expert Tool in optimizing and Predicting Mild Steel Weld Reinforcement Form Factor (WRFF) in
Tig Welding Process”
From the results of Fig. 6, it was observed that current of 140.01 Amp, voltage of 20.00 volt, welding speed of 150.00mm/min and gas flow rate of 12.01 L/min will produce a weld material of Weld reinforcement form factor (WRFF) of 2.33611mm. This solution was selected by design expert as the optimal solution with a desirability value of 97.30%.
It can be deduce from the result of Figure 4.6 that the model developed based on response surface methodology and
optimized using numerical optimization method, predicted the weld penetration size factor (WPSF) by an accuracy level of 98.22%, weld reinforcement form factor (WRFF) by an accuracy level of 97.11% and percent dilution by an accuracy level of 96.56%.
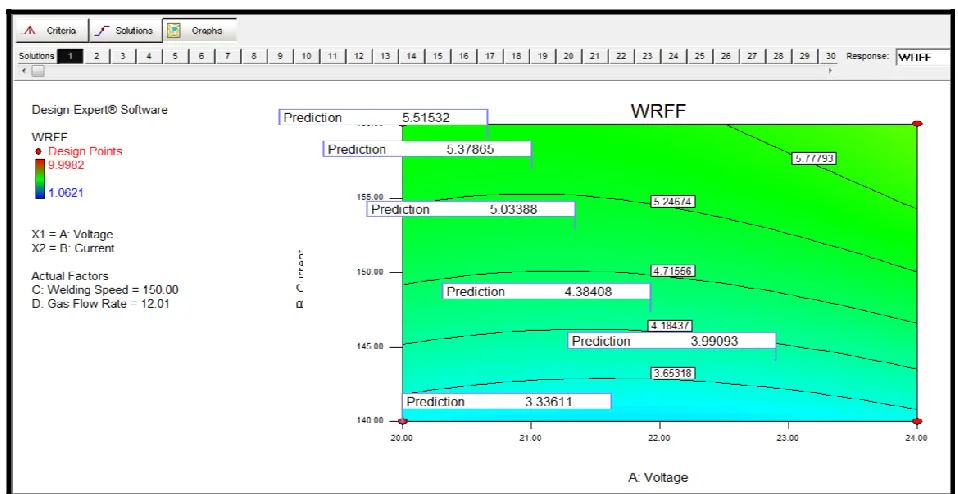
Based on the optimal solution, the contour plots showing the WRFF response variable against the optimized value of the input variable is presented in Fig. 7.
Fig. 7: Predicting weld reinforcement form factor (WRFF) using contour plot
The contour plots in fig.7 show different predictions; when voltages =20.00, 21.00, 22.00, and 23.00, WRFF= 3.33611, 5.37865, 4.38408 and 3.99093 respectively.
CONCLUSION
And from this study we have been able to establish a Mathematical model for weld reinforcement form factor applicable to TIG four input process parameters (voltage, current, welding speed and gas flow rate). The results obtained showed that optimum WRFF was achieved when a current of 140.01 Amp, voltage of 20.00 volt, welding speed of 150.00mm/min, and gas flow rate of 12.01 L/min was used during welding operation of steel plate of 10mm thick, which produced a Weld reinforcement form factor (WRFF) of 2.33611mm. This solution was selected at a desirability value of 97.30%.
Also, it was observed that an increase in current will only produce a moderate weld reinforcement form factor, while a moderate voltage and welding speed will always produce a high weld reinforcement form factor. An increase in current will only produce a moderate weld reinforcement form factor, while a moderate voltage and welding speed will always produce a high weld reinforcement form factor. The results of this study will help reduce the cost of try and
error experiment which is expensive and time wasting .It will also help fabrication industries to maximize the quality of their products.
REFERENCES
1. Sudhakaran, R. Vel-Murugan, V. And Sivasa Kthivel, PS (2012) Effect of Process Parameters on Depth of Penetration in Gas Tungsten Arc Welded (GTAW) 202 Grade Stainless Steel Plates Using Response Surface Methodology. TJER, Vol.9, N0. 1, pp. 64-79.
2. Deepak Choudhary, Sandeep Jindal and N.P.Mehta (2011) “To study the effect of welding parameters on weld bead geometry in SAW welding process”, Elixir Mechanical Engg. Vol.40, 5519-5524 3. S.P.Gadewar, PeravliSwaminadhan, M.G.Harkare,
S.H.Gawande (2010) “Experimental investigation of weld characteristics for a single pass TIG welding with SS304”, International Journal of Engineering Science and Technology, Vol. 2(8), 3676-3686.
4. Kundan Kumar. Somnath Chattopadhyaya, Avadhesh Yadav (2010), “Surface Response Methodology for predicting the output responses of
“Application of Expert Tool in optimizing and Predicting Mild Steel Weld Reinforcement Form Factor (WRFF) in
Tig Welding Process”
TIG welding process” Asian Journal of engineering Materials Characterization and Engineering. 3.
research ISSN-2319-2100 298-308.
5. Parikshit Dutta and Dilip Kumar Partilhar (2007) 8. J. E. R. Dhas and M. Satheesh (2013), "Sensitivity Modeling of TIG Welding Process Using analysis of submerged arc welding parameters for Conventional Regression Analysis and Neural low alloy steel weldment," Indian Journal of Network – Based Approaches, Journal of Material Engineering and Materials Sciences, vol. 20, pp. Processing Technology, 184, 56-68. 425-434.
6. Ravikumar, S.M. and Vijian, P. (2014) 9. Omajene, J.E., Martikainen, J. And Kah, P. (2014) Optimization of Weld Bead Geometry in Shielded Effect of Welding Parameters on Weld Bead Shape Metal Arc Welding Using Taguchi Based Grey for Welds done underwater. International Journal Relational Analysis. International Journal of of Mechanical Engineeering and Applications Vol. Mechanical and Mechatronics Engineering IJMME 2, No.61. pp 128-134
–IJENS, Vol. 14, No.4, pp. 86-91. 10. Mistry, P.J. (2016) Effect of Process Parameters on 7. Achebo, J. and Odinikuku, W. (2015) Optimization Bead Geometry and Shape Relationship of Gas of Gas Metal Arc Welding Process parameters Metal Arc Weldments. International Journal of using Standard Deviation (SDV) and Multi- Advanced Research in Mechanical Engineering & Objective Optimization on the Basis of Ratio Technology, Vol. 2, issue 2, pp. 24-27.
Analysis (MOORA). Journal of Minerals and