Issues
ISSN: 2146-4138
available at http: www.econjournals.com
International Journal of Economics and Financial Issues, 2016, 6(4), 1625-1631.
Testing the Structure-Conduct-Performance Paradigm for the
Turkish Banking Sector: 2008-2013
Tuncay Çelik
1*, Muhittin Kaplan
21School of Applied Sciences, Erciyes University, Kayseri, Turkey, 2Faculty of Economics, Istanbul University, Istanbul, Turkey. *Email: [email protected]
ABSTRACT
The history of the studies on traditional industrial economics goes back to 1940’s. These studies (Mason, 1939; Bain, 1951) were in general conducted to provide information about market structure. The structure-conduct-performance (SCP) approach stemmed from these studies argues that, in the case of hindered market entry, the higher the concentration ratio and collusion among firms, the lower the level of competition in the market. Later on, a number of authors have contributed to the traditional SCP approach to improve it in a number of ways: The first hypothesis is called “the collusion hypothesis” and developed by Bain (1952); the second one was due to Demsetz (1973) and called the “efficient structure hypothesis.” This study aims at testing the applicability of the SCP approaches using the data related to 23 Turkish commercial banks operating over the period 2008-2013. The empirical results have shown that the modified efficient structure hypothesis holds for the Turkish banking sector over the sample period.
Keywords: Structure-Conduct-Performance, Efficiency, Concentration, Turkish Banking
JEL Classification: G21
1. INTRODUCTION
The traditional structure-conduct-performance (SCP) approach has been first developed by Mason (1939) and Bain (1951). The empirical studies conducted to test the SCP approach have shown that there is a positive relationship between firm performance and market concentration. To explain the underlying reason behind the relationship between firm performance and market concentration, two main hypotheses have been put forward: The first hypothesis is called “the collusion hypothesis” and developed by Bain (1952); the second one was due to Demsetz (1973) and called the “efficient structure hypothesis.”
The basic premise of the collusion hypothesis is that collusion among firms in markets with high concentration ratios is also high (Bain, 1951). The collusion among firms will lead to an increase in the prices of services provided and thereby it will result in the acquisition of excess profits in the market. As a result, this will lead to the weakening of the market’s competitive structure and the appearance of imperfect competitive market structure. In addition, when the market shares of the companies increase, this
will lead to an increase in concentration ratio and cause the level of competition to decrease. At the beginning of the 1970s, Demsetz (1973) has criticized the collusion hypothesis. According to Demsetz (1973), the market share of the companies and therefore the concentration ratios in markets are high because these firms are efficient and low cost firms. In such cases, it would be possible to observe high market shares-concentration ratios simultaneously with highly competitive market structure.
Turkish economy since 1980. The third part of the study provides the theoretical and empirical literature on the subject. Fourth section provides the results obtained from econometric analysis of the data. The last section concludes with an overall assessment of the results.
2. BRIEF HISTORY OF THE TURKISH
BANKING SECTOR
It is important to provide a general overview on Turkish banking sector before getting into an empirical analysis of the determinants of the structure of the Turkish banking sector. The year 1980 marked a turning point for both the Turkish economy and the Turkish banking system. In 1980s, Turkey has undertaken the financial liberalization and deregulation of the economy. The initial reforms began in 1981 when controls on interest rates were removed. In 1984 foreign exchange trade was relaxed. In 1986 Istanbul Stock Exchange was reopened. In 1987 the Central Bank began open market operations. The benchmark date for financial liberalization is 1989 when controls on capital movements were removed entirely and Turkish currency became convertible. After the financial liberalization in late 1980s both Turkish economy and banking sector strongly incorporated with global financial system.
It was widely argued that financial liberalization promotes savings and channelizes them to real investment and thereby increases economic growth. However, financial liberalization has caused speculative trading in Turkish financial markets. As a result, the fragility of the Turkish financial system as well as economy had increased. When it comes to 1994, Turkish banking sector has faced first major financial crises. The first economic crisis took place in April 1994 in which Turkish Lira (TL) was devalued by approximately 100% and the operations of the three banks that had excessive foreign exchange debts were halted. The regulatory authority brought 100% guarantee on deposits in order to reduce the negative effects of the crisis. Despite the government’s intervention, the crises had adverse impact on Turkish economy as well as on banking sector. During this period, 35% of the total assets of the banking sector decreased; however, reassuring policies have led to the rapid recovery of the sector in the coming periods. Towards the end of 1990s, the Turkish banking sector had rapidly developed and the total number of commercial banks had increased from 55 in 1995 to 61 in 1999. While there were positive developments in the banking sector, a new financial crisis emerged in February 2001 and again affected the sector adversely. During this period, the total assets of the banking sector decreased by almost half. The interbank overnight interest rates in Turkey increased to 7.000%; banks that had maturity mismatch position incurred immense losses and the market value of their securities declined enormously. Devaluation in TL by switching from the fixed exchange rate system to a floating exchange rate system in February 2001 caused the banks to incur foreign exchange losses (BRSA, 2002. p. 12). The contraction of the economy led to increase in non-performing loans of the banks and, as a result, some banks stopped operating and some were transferred to the savings deposit insurance fund.
Although it is believed that the negative effects of the crisis can be felt for a long time, Turkish banking industry began rapid recovery process through introduction of the “Restructuring Program” to the banking sector in late 2001. The 2003 general elections also created confidence about the long term economic stability and contributed to the recovery process. The Restructuring program was aimed at recreating competition in the banking sector after the crisis by implementing the new regulations. For this purpose, new entries to the sector have been encouraged to increase the total number of banks.
The new regulations became effective in short time and the mortgage and car loans grew rapidly due to declining interest and inflation rates. The increase in demand for banking services also attracted foreign investors and the number of foreign banks increased from 13 in 2005 to 17 in 2013. The foreign investors interested in banking sector in Turkey were mainly from the European Union (EU) member countries including the Netherlands, Germany, England, France and Italy. The foreign investment was realized by the acquisition of a domestic bank in Turkey.
In 2008, Turkish banking sector faced the global financial crisis, which had negative impacts on financial markets, but it was not affected deeply due to “Restructuring Program” implemented in 2001. The lessons drawn from 2001 financial crunch and the measures taken in 2001, such as strengthening the capital structure and increasing the capital adequacy ratio, mitigated the effects of the global crisis on the banking sector in Turkey. During the 2001 financial crisis, banks’ average capital adequacy ratio was at 4%, in the following years, this rate has gradually increased and rose to 17% in 2015.
After the effects of the global financial crisis on the Turkish economy have been observed in 2009, the Turkish banking sector has experienced a dramatic increase in the use credit cards. With the contributions of purchasing by installments using the credit cards, it has increased the volume of credit card transactions and the ratio of credit card transaction volume to gross domestic product (GDP) has increased from 17% in 2009 to 25% in 2014 (TBB, 2014). Partly due to the slowdown in Turkey’s economy after the year 2010, the ratio of non-performing loans ratio to loans in the banking sector has increased significantly. This rate was approximately 1.2% in 2005 but it has increased to 3% in 2015 implying a significant increase in the riskiness of the (BRSA, 2015).
3. SCP FRAMEWORK AND LITERATURE
The SCP paradigm assumes that the concentration in a market promotes the collusion between the firms that operate in the sector. In other words, as the concentration in a market increases, a firm’s market power increases; and the firms start signing open or secret agreements and raise the price of the products to increase their profit. Thus, a monopolistic market structure emerges in the sector. According to collusion hypothesis developed by Bain (1951), there is a positive relationship between concentration and profitability and negative relationship between concentration and market performance (competition). The existence of barriers to market entry causes continuous high profits in the market.
In the early 1970’s, the traditional industrial economy hypothesis was criticized by the founder of the “efficient structure” hypothesis. This hypothesis was developed by Demsetz (1973) and Peltzman (1977). It argues that concentration in a market is not a random phenomenon. Demsetz (1973) has shown that concentration in a sector does not occur by chance; rather it appears by the high efficiency (i.e., lower costs) of the pioneer firms in the market. In other words, firms that have cost advantages compared to their competitors will reduce their prices and have greater market share than inefficient firms. All these will cause concentration ratio to be higher in the market. According to Demsetz (1973), even though the concentration is high in a market due to efficient firms, the level of competition could still be high in the market. Briefly, the “efficient structure” hypothesis suggests that there is a spurious relationship between profitability and concentration. The true relationship can be explained as follows: “High efficiency in a sector leads to high market share and it causes to high concentration in the sector.” For this reason, market share can be considered as a measure of efficiency (Smirlock, 1985. p. 70-71). However, using market structure as a proxy for efficiency in empirical analysis has been heavily criticized and it was argued that efficiency should be measured and used directly in empirical analysis (Shepherd, 1986; Timme and Yang, 1991; Berger, 1995). The main reason for using efficiency measures directly in testing collusion and efficiency market hypotheses is related to the interpretation problem that the traditional specification involves: Shepherd (1986) for example argues that market share only reflects market power. However Smirlock (1985) interprets high market share as a signal that the most efficient firms have low costs and earn market share. In this sense, market share can be considered as a proxy to efficiency. Following the criticisms of the absence of direct efficiency measurement in empirical analysis, the following econometric model is frequently used to test for collusion and efficient structure hypotheses in the empirical literature:
πi α β n β i β i βi i
n
i i
CR MS EFF A e
= + + + + +
=
∑
1 2 3
4 (1)
πi: i. firm profitability ratio (return on equity [ROE] or return of assets [ROA]),
CRn: n firm concentration ratio, MSi: i. firm market share ratio, EFFi: i. firm efficiency ratio,
A: Other control variables vector for i. firm.
In Equation (1) above, πi is used a measure of bank performance (ROA or ROE), MS denotes market share of firm i, CRn represents concentration ratio and EFF shows efficiency scores measured directly for each bank. The following section provides detailed information about how efficiency scores for each bank has been measured. According to the coefficients obtained from the Equation (1) given above, the hypotheses that will be tested to analyze the relationship between bank performance and market structure can be summarized as follows:
Collusion hypothesis:
0; 0; 0
CR MS EFF
∂ ∂ = ∂ =
∂ ∂ ∂ (2)
Efficient structure hypothesis:
0; 0; 0
CR MS EFF
∂ = ∂ = ∂
∂ ∂ ∂ (3)
Relative efficient structure hypothesis:
∂
∂ =
∂ ∂
∂ ∂
π π π
CR 0; MS 0; EFF 0 (4)
Hybrid efficient structure hypothesis:
∂ ∂
∂
∂ =
∂ ∂
π π π
CR0; MS 0; EFF 0 (5)
The hypothesis given in Equation (2) represents the traditional collusion hypothesis (Bain, 1952). In other word, if the coefficients of β2 = 0 and β3 = 0 in Equation (1) and are statistically insignificantly equal to zero and the coefficient β1 is significant and different from zero, then the Bain’s collusion hypothesis holds in the market. The hypothesis given in Equation (3) represents the efficient structure hypothesis (Demsetz, 1973). In this case, while the coefficients β1 = 0 and β2 = 0, they are statistically insignificant, β3 ≻ 0 should be positive and statistically significant. If the estimation result shows that only β3 is positive and statistically significantly different from zero, then we will conclude that the efficient structure hypothesis holds in the market.
The hypothesis given in Equation (5) represents the relative efficient structure hypothesis (Shepherd, 1986). If this hypothesis is true, then we expect that while β1 is equal to zero, β2 and β3 should be positive and statistically significant in Equation (1). If this is the case, then, different from the collusion hypothesis in where all firms earn abnormal profits, those banks with high market share and differentiated services will have a market power and earn excess profits. In this hypothesis, it is also assumed that like in the efficient market hypothesis, concentration is the result of high efficiency and in turn high market share.
seems to be the second factor that affects profitability. However, it is worth mentioning that market share has no effect on profitability according to this hypothesis.
In the industrial economics literature, there are many studies that aimed at testing the hypotheses given above for banking sector. Some of these empirical studies involve Smirlock (1985), Evanof and Fortier (1988), Berger (1995), Molyneux and Forbes (1995), Frame and Kamershen (1997), Maudos (1998), Pilloff and Rhoades (2002), and Akhigbe and McNulty (2003), Mensi and Zouari (2011), Sahoo and Mishra (2012), Nabieu (2013), Bello and Isola (2014). There are also a number of studies that tests the SCP hypothesis for the Turkish banking sector. Denizer (1997) has found that there is a positive relationship between profitability implying that the efficiency hypothesis holds for the Turkish banking sector over the period 1986-1992. However, Kasman (2001) provided opposite evidence indicated no relationship between profitability and concentration for the Turkish banking sector over the period 1988-1996. Okumuş (2002) searched for the determinants of market structure of the Turkish banking sector over the period 1989-1995. They concluded that the Turkish data provided support for efficiency structure hypothesis rather than collusion hypothesis. Günalp and Çelik (2004) also found out that the efficient structure hypothesis held for the Turkish banking sector over the period 1990-2000. In contrast to the previous studies, Abbasoğlu et al. (2007), in their study for the Turkish banking sector over the period 2001-2005, failed to find a significant relationship between profitability and efficiency. Uludağ and Gökmen (2010) carried out their study to analyze the determinants of profits of the Turkish banking sector for the 1999-2009 periods. They found out that while bank-specific factors play an important role in affecting bank profitability, they also observed a positive and significant relationship between profitability and concentration. In as similar study, Sarıgül (2013) confirmed an existence of a positive and meaningful relationship between concentration and profitability over the period 2003-2012. Özcan and Çitfçi (2015) provided the evidence supporting the efficient market hypothesis for the 2006-2013 periods.
4. DATA ENVELOPMENT ANALYSIS (DEA)
AND EFFICIENCY IN TURKISH BANKING
SECTOR
DEA is a data oriented approach for evaluating performance of similar units. It involves converting multiple inputs to multiple outputs. It is a very useful methodology because one can find the relationship between multiple inputs and outputs even without specifying mathematical model explicitly. Since DEA does not require market prices, it is often used modeling the relationship between inputs and outputs in the service sector. However, one should be careful about selecting the inputs and outputs in their study because the selection of inputs and outputs may affect the results (Berg, 2010).
Efficiency in banking examines the ability of banks to turn the inputs of operation into outputs. Given the production technology, if a bank cannot reduce its inputs without causing a reduction
in its outputs it is called efficient banks. However, if a bank achieves the current performance using higher number of inputs than other similar banks, this indicates that the bank does not use its resources efficiently. These inefficiencies may be arising from mismanagement, inappropriate sizes of banks and external factors.
The main aim of the empirical studies on efficiency measurement is to construct empirical production frontiers to evaluate the performance across banks. To this end, Farrell (1957) defined efficiency, given the technology, as a distance to empirical production frontier. Production frontier represents the highest possible performance that can be achieved using available technology. Each decision making unit’s (DMU) efficiency, in this case a bank, is measured by comparing the efficiency score of this unit with banks that constructs the frontier. Although there are different alternative methods to determine production frontier (parametric and non-parametric), most of the previous empirical studies in banking employed the DEA method.
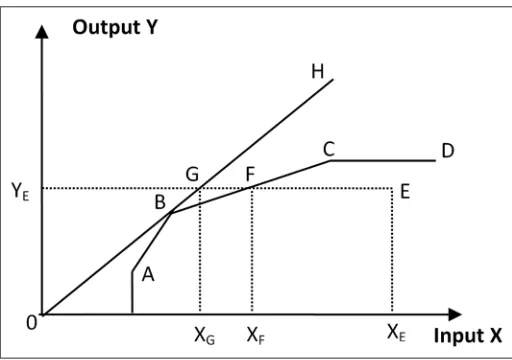
Figure 1 provides a simple example of measuring efficiency using DEA and shows the meaning of efficiency. To simplify the presentation, it is assumed that banks use only one input to produce one output.
In Figure 1A-E represents banks in the input (X)-output (Y) plane. Under the assumption of constant returns to scale, the most efficient bank is the one that has the highest output-input ratio in the case of one input and one output. In the figure, constant returns to scale is shown with a linear line stems from the origin. According to Figure 1 the most efficient bank is the bank B since the slope of OH line has the highest value at point B (efficiency score = 1). Thus, efficient production technology is determined by the OH line that goes through point B. All other points are inefficient because they are under this line (efficiency score <0).
After determining efficient frontier in this way, at the second stage, the efficiency scores for inefficient banks are calculated as follows. Assuming that the observation on the efficiency line (in our example this is shown by point B) is efficient, efficiency score corresponding to this point is one (or 100%). Banks which are under the efficiency line are inefficient and the level of inefficiency
of these banks is related to the distance to line H. Efficiency score for bank E, is determined by the ratio of XG/XE.
Although it is easy to measure efficiency level for one input and one output, when the number of inputs and outputs are greater than one it becomes very difficult to measure efficiency scores. In such cases, the linear programming methods are employed to measure the efficiency scores. The theoretical underpinnings of DEA analysis is developed by Farrell (1957) but the DEA model that allows the measurement of efficiency when there are more than one input and output is developed by Charnes et al. (1978). DEA is a non-parametric technique that is used in construction of empirical production frontier and evaluation of performances of homogenous DMU’s. In our analysis, DMU’s are banks which use more than one input to produce multiple outputs. In the analysis, assuming that the number of DMU’s is n and each of these units use m inputs and s output, the mathematical representation of DEA model can be written as (Lovell, 1993):
DEA model;
maxh u y v x
c
r rc r
s
i ic i
m
= =
=
∑
∑
1
1
(6)
u y
v x
r rj r
s
i ij i
m =
=
∑
∑
≤1
1
1
ur, vi ≥0
r = 1,2,…,s; i = 1,2,…,m; j = 1,2,…,n
Where, c represent the DMU that its efficiency level will be evaluated, yrj is the bank j’s rth output, x
ij is bank j’s ith input,
ur and vi are the weights that will be obtained from solving the model corresponding to input r’s and output i’s respectively. Model (6), involves the maximization of objective function hc’s, DMU c’s weighted output to weighted inputs ratio, including itself under the restriction of no one DMU ratio is greater than one. The weights of ur and vi in the model is obtained with optimization. To solve the optimization problem given in Model (6) we equate hc’s denominator to one thereby turning the problem into linear programming. Corresponding model suitable to linear programming can be written as:
maxu, c r rc r
s
h u y
=
=
∑
1(7)
i ic i
m
x =
=
∑
11
u yrc rj ic ijx
i m
r s
− ≤
=
=
∑
∑
01 1
u, v ≥ 0 r = 1,…,s; i = 1,…,m and j = 1,…,n
In Model (7), it is assumed that constant returns technology is employed in the optimization problem. In addition, as seen from the Model (7), the weighted average of inputs is equal to one and outputs are maximized. This formulation of the DEA model is called input oriented efficiency measurement and indicates that banks try to minimize inputs given the outputs. The dual of the primal linear programming model given in Model (7), can be written by defining the input weights of banks as θc and output weights as λj:
Dual model;
min hc = θc (8)
j rj i rc
j n
y −s+ =y
=
∑
1
λj ij i θc ic
j n
x +s− = x
=
∑
1
j, ,s si− i+≥0 j = 1,2,…,n
The values of θc scores obtained solving the model is equal to one and the slacks si+
and si−
is equal to zero, bank c is called efficient. The efficiency bank implies that it is impossible for the bank to achieve the given output level with using less inputs. If θc is smaller than one, these banks are called less efficient than the benchmark reference banks and the value of θc indicates the extent that bank c needs to reduce input usage to reach efficient frontier. For inefficient reference banks are obtained using the optimum values of λj’s. To consider the variable returns to scale in the production, an extra restriction of j
j n
=
∑
=1 1
needs to be added to the Model (8).
5. ECONOMETRIC ESTIMATION AND
RESULTS
To test the SCP approach for the Turkish banking sector, we will use the augmented version of the Smirlock (1985)’s empirical model given in the Equation (1) above. The bank profitability model subject to empirical analysis is provided in the Equation (9) below. This model will be estimated using the Turkish banking data over the period 2008-2013. The data is obtained from the balance sheets of 23 commercial banks operating during the sample period continually1.
πit = +α β1CRni+β2MSit+β3EFFit+β4LASSTit+β5DEP eit+ i
(9)
i = 1....,23 t = 1...,6 In the profitability Equation (9):
πi: i. firm profitability ratio (ROA), CRn: n firm concentration ratio, MSi: i. firm market share ratio,
1 The data is obtained from the sectoral balance sheets provided by the
EFFi: i. firm efficiency ratio,
LASST: i. firm liquid assets/total assets, DEP: i. firm deposit growth rate.
In the Equation (9), concentration ratio in the Turkish banking sector is measured as CR5, sum of the first 5 banks’ share in the sector. MS shows the market share of each bank in the sector and measured by dividing bank i’s assets by total assets in the banking sector. The EFF variable indicates the efficiency scores measured by using the DEA approach for each bank. One of the elements of the Ai vector in the Equation (1) is the variable LASST which represents the scale of a bank and is measured by dividing total liquid assets to total assets of banks. To represent demand conditions of the sector, the variable DEP is included into the model. The DEP variable is measured by the growth rate of total deposits. The sign of the coefficients of the first three variables in Equation (9) above are expected to be positive theoretically since an increase in concentration, market share and efficiency lead to an increase in profits in banking sector. However, the coefficient of the LASST variable in the Equation (9) might assume positive or negative sign depending on the extent to which liquid assets are used efficiently. The DEP variable in Equation (9) represents changes in demand for the services of banking sector. While an increase in deposits leads to an increase in profitability of banks under the assumption that there is no new entry to the market, it may reduce profits in banking sector if there is a new entry to the market. For this reason, the sing of the coefficient of the DEP variable is uncertain.
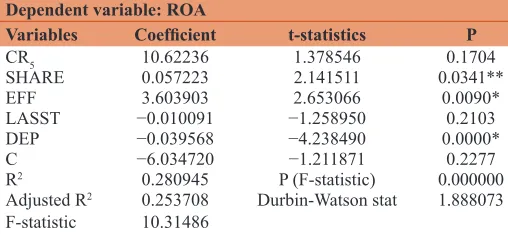
The results obtained from testing the hypotheses put forward to explain the SCP relationship are presented in Table 1. We employed the pooled regression analysis to analyze the data related to the 23 banks in the Turkish banking sector over the period 2008-2013. It is worth mentioning that we both employed panel data and pooled regression in the empirical analysis. Since both techniques provided the same results, the following section presents the pooled regression results only.
The examination of the Table 1 shows that the coefficients of concentration, market share and efficiency variables assume the theoretically expected sings. While the coefficient of sector concentration variable is statistically insignificant, the coefficients of the efficiency and the market share variables are statistically significant at 1% and 5% levels respectively. Although the coefficients of both the liquidity variable LASST and the deposit
variable DEP have negative sings, the results indicate that while the coefficient of the liquidity variable is insignificant, the coefficient of deposit variable has statistically different from zero at 1% level of significance. It is also worth to remember that the sector has experienced continuous fluctuations in entry and exits during the sample period. Similarly, the sector has also experienced similar fluctuations in liquid assets and deposits.
While the banking sector deposits and liquid assets have increased in real terms during the period 2008-2010, we observe declines in these figures in real terms between 2011 and 2012 period. Although these figures have shown recovery in 2013, they have reached to 2010 levels in real terms. Entry to the sector has increased especially after 2001 with an increased interest of foreign banks. The number of foreign banks rose from 13 in 2001 to 17 in 2008. Although this number decreased to 16 in 2011 and 2012, it also rose to 17 in 2013 again. As the results have shown, while the liquid assets have no significant effect on the profitability, the deposits have a significant impact on the profitability during the period. The reason for the observed significant and negative effects may be due to a real decline occurred in deposits in recent years.
The empirical findings of this study also provide valuable information about the SCP relationship in the Turkish banking sector. The results indicate that, among alternative hypothesis, the hybrid efficient structure (Schmalensee, 1987) hypothesis given in the Equation (6) is the one that holds for the Turkish banking sector during the sample period. The estimation results show that while the coefficients of β1≻ 0 and β3≻ 0 are statistically significantly different and positive, the coefficient β2 = 0 is insignificant. This implies that while the first and the main factor that determines banks’ profitability is efficiency, concentration appears to be another important factor that affects profitability. However, the results have shown that the market share has no impact on the profitability of banks. Taken together, the findings of this study indicate that while the Turkish banking sector data do not provide a support for the traditional cooperation hypothesis, it provides a strong supports for the relevancy of the efficient structure hypothesis.
6. CONCLUSION
This study aimed at investigating the bank performance and the determinants of bank performance using the Turkish banking sector data over the period 2008-2013. The results of the study revealed that while efficiency variable seems to be the most important determinant of bank profitability, concentration variable also appears to be another factor that plays an important role in increasing bank profits. The findings also indicated that the market share of banks had no impact on profitability over the sample period. Taken together, the empirical findings of this study, in conformity with the results of previous studies reviewed in the literature above, provided a strong support for the relevance of the hybrid efficient structure rather than the traditional collusion hypothesis. The policy implications of this study involves that, to improve bank performance in the Turkish banking sector, the supervisory and regulatory agencies should primarily aim at
Table 1: Pooled regression estimation results
Dependent variable: ROA
Variables Coefficient t-statistics P
CR5 10.62236 1.378546 0.1704
SHARE 0.057223 2.141511 0.0341**
EFF 3.603903 2.653066 0.0090*
LASST −0.010091 −1.258950 0.2103
DEP −0.039568 −4.238490 0.0000*
C −6.034720 −1.211871 0.2277
R2 0.280945 P (F-statistic) 0.000000
Adjusted R2 0.253708 Durbin-Watson stat 1.888073
F-statistic 10.31486
increasing the effectiveness of banks’ efficiency instead of taking measures to reduce concentration ratio.
REFERENCES
Abbasoğlu, O.F., Aysan, A.F., Güneş, A. (2007), Concentratıon, competition, efficiency and profitability of the Turkish banking sector in the post-crises period. Banks and Bank Systems, 2(3), 106-115. Akhigbe, A., Mcnulty J.E. (2003), The profit efficiency of small US
commercial banks. Journal of Banking and Finance, 27(2), 307-325. Bain, J.S. (1951), Relation of profit rate to industry concentration.
Quarterly Journal of Economics, 65, 293-324.
Bello, M., Isola, W.A. (2014), Empirical analysis of
structure-conduct-performance paradigm on Nigerian banking industry. The Empirical
Econometrics and Quantitative Economics Letters, 3(3), 24-34. Berg, S. (2010), Water Utility Benchmarking: Measurement, Methodology
and Performance Incentives. London, UK: International Water Association Publishing.
Berger, A.N. (1995), The profit-structure relationship in banking-tests of market-power and efficient-structure hypotheses. Journal of Money, Credit, and Banking, 27(2), 404-431.
BRSA, Banking Regulation and Supervision Agency. Annual Report, Various Years (2002, 2006, 2015), Ankara.
Charnes, A., Cooper, W.W., Rhodes, E. (1978), Measuring the efficiency of decision making units. European Journal of Operational Research,
2, 429-444.
Demsetz, H. (1973), Industry structure, market rivalry, and public policy. Journal of Law and Economics, 16(1), 1-9.
Denizer, C. (1997), The Effects of Financial Liberalization and New Bank Entry on Market Structure and Competition in Turkey. Washington, DC: World Bank Policy Research Working Paper. No: WPS 1839. Evanoff, D.D., Fortier, D.L. (1988), Reevaluation of the
structure-conduct-performance paradigm in banking. Journal of Financial
Services Research, 1, 277-294.
Farrell, M.J. (1957), The measurement of productive efficiency. Journal of Royal Statistical Society Series A (General), 120(2), 253-281. Frame, W.S., Kamershen, D.R. (1997), The profit-structure relationship
in legally protected banking. Journal of Industrial Organization, 12(1), 9-22.
Günalp, B., Çelik, T. (2004), Türk Bankacılık Sektöründe Piyasa Yapısı ve Performans İlişkilerinin Etkinlik İçin Doğrudan Bir Ölçüt Kullanılarak Test Edilmesi. Gazi Üniversitesi İktisadi ve İdari Bilimler Fakültesi Dergisi, 6(3), 31-57. (Turkish).
Kasman, A. (2001), The profit-structure relationship in the Turkish banking industry using direct measures of efficiency. Ege Akademik Bakış Dergisi, 1(1), 141-164.
Lovell, C.A.K. (1993), Production frontiers and productive efficiency. In:
Fried, H.O., Schmidt, S.S., editors. The Measurement of Productive Efficiency: Techniques and Applications. Oxford, UK: Oxford University Press. p3-67.
Mason, E.S. (1939), Price and production policies of large-scale enterprise. American Economic Review, 29, 61-74.
Maudos, J. (1998), market structure and performance in Spanish banking using a direct measure of efficiency. Applied Financial Economics, 8, 191-200.
Mensi, S., Zouari, A. (2011), Banking industry, market structure and
efficiency: The revisited model to intermediary hypotheses.
International Journal of Economics and Research, 2(1), 23-36. Molyneux, P., Forbes, W. (1995), Market structure and performance in
European banking. Applied Economics, 27(2), 155-159.
Nabieu, G.A.A. (2013), The structure, conduct and performance of commercial banks in Ghana. European Journal of Business and Innovation Research, 1(4), 34-47.
Okumuş, H.Ş. (2002), Market structure and efficiency as determinants of profitability in the Turkish banking industry. Yapı Kredi Economic Review, 13(1), 65-88.
Özcan, A., Çiftçi, C. (2015), Türkiye’de Mevduat Bankacılığında Yoğunlaşma ve Karlılık İlişkisi (2006-2013 Dönemi). Niğde Üniversitesi İktisadi ve İdari Bilimler Fakültesi Dergisi, 8(3), 1-12. (Turkish).
Peltzman, S. (1977), The gains and losses from industrial concentration. Journal of Law and Economics, 20, 229-263.
Pilloff, S.J., Rhoades, S.A. (2002), Structure and profitability in banking markets. Review of Industrial Organization, 20(1), 81-89.
Sahoo, D., Mishra, P. (2012), Structure, conduct and performance of Indian banking sector. Review of Economic Perspectives, 12(4),
235-264.
Sarıgül, H. (2013), Concentration and Profitability in Turkish Banking Industry. Proceedings of the 11th Eurasia Business and Economics Society Conference (EBES), September 12-14, Ekaterinburg. Schmalensee, R. (1987), Collusion versus differential efficiency: Testing
alternative hypotheses. The Journal of Industrial Economics, 35, 399-425.
Shepherd, W.G. (1986), Tobin’s q and structure-conduct-performance relationship: Reply. American Economic Review, 76, 1205-1210. Smirlock, M. (1985), Evidence on the (non) relationship between
concentration and profitability in banking. Journal of Money, Credit and Banking, 17(1), 69-83.
Timme, S.G., Yang, W.K. (1991), On the use of a direct measure of efficiency in testing structure-conduct-performance relationships. Georgia State University Working Paper, GSU, Atlanta-USA. Uludağ, B.K., Gökmen, H. (2010), Türk Bankacılık Sektörünün