RESEARCH
Bacterial conversion of depolymerized Kraft
lignin
Krithika Ravi
1, Omar Y. Abdelaziz
1, Matthias Nöbel
1,3, Javier García‑Hidalgo
2, Marie F. Gorwa‑Grauslund
2,
Christian P. Hulteberg
1and Gunnar Lidén
1*Abstract
Background: Lignin is a potential feedstock for microbial conversion into various chemicals. However, the microbial degradation rate of native or technical lignin is low, and chemical depolymerization is needed to obtain reasonable conversion rates. In the current study, nine bacterial strains belonging to the Pseudomonas and Rhodococcus genera were evaluated for their ability to grow on alkaline‑treated softwood lignin as a sole carbon source.
Results: Pseudomonas fluorescens DSM 50090 and Rhodococcus opacus DSM1069 showed the best growth of the tested species on plates with lignin. Further evaluation of P. fluorescens and R. opacus was made in liquid cultivations with depolymerized softwood Kraft lignin (DL) at a concentration of 1 g/L. Size‑exclusion chromatography (SEC) showed that R. opacus consumed most of the available lower‑molecular weight compounds (approximately 0.1– 0.4 kDa) in the DL, but the weight distribution of larger fractions was almost unaffected. Importantly, the consumed compounds included guaiacol—one of the main monomers in the DL. SEC analysis of P. fluorescens culture broth, in contrast, did not show a large conversion of low‑molecular weight compounds, and guaiacol remained unconsumed. However, a significant shift in molecular weight distribution towards lower average weights was seen after cultivation with P. fluorescens.
Conclusions: Rhodococcus opacus and P. fluorescens were identified as two potential microbial candidates for the conversion/consumption of base‑catalyzed depolymerized lignin, acting on low‑ and high‑molecular weight lignin fragments, respectively. These findings will be of relevance for designing bioconversion of softwood Kraft lignin. Keywords: Base‑catalyzed depolymerization, Indulin AT, Microbial conversion, Pseudomonas, Rhodococcus, Guaiacol, Biorefineries
© The Author(s) 2019. This article is distributed under the terms of the Creative Commons Attribution 4.0 International License (http://creat iveco mmons .org/licen ses/by/4.0/), which permits unrestricted use, distribution, and reproduction in any medium, provided you give appropriate credit to the original author(s) and the source, provide a link to the Creative Commons license, and indicate if changes were made. The Creative Commons Public Domain Dedication waiver (http://creat iveco mmons .org/ publi cdoma in/zero/1.0/) applies to the data made available in this article, unless otherwise stated.
Introduction
Lignin is one of the most abundant biopolymers on Earth and constitutes 18–32% [1] of woody biomass by weight and 40% by energy [2]. Its natural abundance, high calo-rific value and the fact that it is one of the few available renewable sources of aromatic chemicals in nature make it a prime feedstock for targeted valorization towards biofuels, renewable polymer composites, and valuable chemical precursors [3, 4]. Despite this, most large-scale industrial facilities that exploit plant polysaccharides
(e.g., from wood) have almost exclusively incinerated the co-produced lignin to generate heat and power for bio-mass conversion and/or product drying, and have not aimed for higher-value products [5]. The emergence of biorefineries, which predominately convert the carbo-hydrate part of cellulosic biomass into liquid fuels, will generate substantially more lignin than needed for pro-cess heat or for power generation to the operation, which will add to the lignin volumes already generated in the pulp and paper industry. Hence, efforts are underway for lignin conversion into higher-value products [6, 7].
Among the three principal polymers in plants (cellu-lose, hemicellulose and lignin), lignin has the most het-erogeneous and complex composition and structure, which makes its efficient utilization a major technological
Open Access
*Correspondence: [email protected]
1 Department of Chemical Engineering, Lund University, P.O. Box 124, 221 00 Lund, Sweden
challenge. The lignin biopolymer is built of phenyl pro-panoid units which are substituted at different positions and connected together by ether and C–C cross-links/ bonds [8, 9]. It is noteworthy that the relative abundance of these building blocks is very different between dif-ferent types of biomass (e.g., softwood, hardwood and monocots) [10]. In addition, there are different tech-niques for the separation of lignin from lignocellulosic biomass and the resultant lignin vary in terms of bond structures, building block composition, added functional groups, and molecular weight distribution depending on the separation process. Hence, the term “lignin” is per se not very descriptive.
A central process step needed for biological lignin valorization is the breakdown of the lignin macromol-ecule into smaller compounds that can be converted by microorganisms [1]. This depolymerization process is essential, as most likely only low-molecular weight compounds (mono- or possibly oligomers) can pass the cellular membranes of microbes and enter the cellular metabolism. The distribution of bond strengths in the different C–O and C–C bonds make the depolymeriza-tion quite challenging. Ideally, pretreated lignin streams for bacterial conversion should consist of water-soluble monomers. For chemical depolymerization in particular, char formation and repolymerization of produced phe-nolic radicals to large water-insoluble complexes, thus, need to be avoided. High concentrations of low molec-ular compounds are also normally desirable—a value of 100 g/L [5] has been mentioned—although tolerance of the microbe to the monomers will likely limit the allowed process concentrations. Until now, obtained monomeric species in lignin streams are still in the range of only a few g/L [11].
The monomers resulting from chemical depolymeri-zation are quite diverse. In a biological conversion pro-cess, it is, thus, important to choose organisms that have the ability to funnel a large range of the lignin-derived aromatic compounds to central intermediates (mainly protocatechuate and catechol) via the upper-funneling catabolic pathways [1]. The principal intermediates are then further channeled to valuable products using natu-ral or genetically engineered microorganisms [12–14]. In previous studies, various microorganisms capable of utilizing lignin/model compounds as a sole source of car-bon have been identified, including Pseudomonas putida,
Rhodococcus opacus, Rhodococcus jostii, Amycolatopsis
sp., Sphingobium sp., and Cupriavidus necator [15–18]. Furthermore, successful proof-of-principle studies have been demonstrated for the microbial bioconversion of lignin from alkaline pretreated corn stover and organo-solv lignin into various products such as PHA, muco-nate and lipids [11, 19–25]. Apart from monomers, the
depolymerization of lignin also results in a heterogene-ous mixture of oligomers and higher-molecular weight compounds; thus, selecting microorganisms able to break down these larger fragments would allow for a process option where complete lignin depolymerization is not required. This, however, requires the use of organisms which secrete extracellular lignolytic enzymes (e.g., lac-cases and DyP-type peroxidases).
In the present study, we explore the possibilities of uti-lizing depolymerized softwood Kraft lignin (Indulin AT) as a substrate for bacterial conversion. Softwood Kraft lignin is potentially available at large quantities from pulp mills in Scandinavia [26]. Its inherent complexity, broad molecular weight distribution and high average molecu-lar weight call for depolymerization, if this feedstock is to be used in bioprocessing. Alkaline depolymerized lignin was used to evaluate nine bacterial species with known aromatic-metabolizing capacity for their ability to grow on plates using depolymerized lignin, with the objective of finding organisms capable of both extracellular lignin breakdown and intracellular aromatic metabolism. Fur-ther evaluation of selected strains was carried out in liq-uid shake flask cultivations using alkaline-treated partly depolymerized lignin as a substrate. Additional cultiva-tions were also made with a mixture of selected model compounds that are representative of monomers found in the depolymerized lignin.
Materials and methods
Lignin substrate preparation
Depolymerized lignin for plate screening was obtained from previously prepared samples [27] at the tempera-tures 190, 220 and 240 °C and flow rates of 5 and 10 mL/ min. For liquid cultivation experiments, it was prepared as follows: A commercial Kraft lignin, Indulin AT, which is a pine softwood lignin precipitated from the black liquor of linerboard-grade pulp [28], was obtained as a dry brown powder from MeadWestvaco Corporation (Charleston Heights, SC, USA). This lignin fraction has a typical moisture content of 4.5 wt% and ash content of 3.5 wt%. The feed of the chemical depolymerization was comprised of 5 wt% lignin substrate, 5 wt% NaOH, and 90 wt% deionized water. Vacuum filtration for the reactor feed was performed to ensure that no precipitation could take place in the pump and to counteract clogging prob-lems within the pressure valve post reaction.
Depolymerization apparatus and operation
Salamander tubular CFR reactor (Cambridge Reactor Design Ltd., Cottenham, UK) with a typical volume of 10 mL. The reactor was equipped with a preheater (8 mL) that ensures bringing the reactant mixture to the desired reaction temperatures. The product stream exiting the reactor was further condensed with the aid of a Julabo circulating water bath, and a pressure control valve made from nickel–molybdenum–chromium superalloy (Has-telloy C276; UNS N10276) was installed to maintain the pressure throughout reaction. A filter was connected directly after the condensation step and attached to the inlet of the pressure control valve to protect it from any char depositions. The total operating system volume was about 50 mL. The setup was heated up to a working temperature of 220 °C and pressurized to 120–130 bars before starting. The feed was pumped continuously to the plug flow reactor at a volumetric flow rate of 5 mL/min, which corresponds to a residence time in the heating zone of about 2 min. For the reaction operating param-eters, the temperature was adjusted using a Eurotherm temperature controller (Eurotherm, Ashburn, Virginia, USA) and the pressure was tuned through a backpressure regulator (Bronkhorst High-Tech B.V., Ruurlo, Nether-lands). After exiting the reaction zone and throttling the product mixture/effluent to atmospheric pressure, the liquid depolymerized product (bio-oil) was continuously collected. Samples were taken for analysis and stored at 4 °C until used in liquid cultivations.
Bacterial strains
Nine bacterial strains were used in this study.
Pseu-domonas putida KT2440 (DSM 6125), Pseudomonas
fluorescens (DSM 50090), Rhodococcus erythropolis
(DSM 43066) and Rhodococcus opacus (DSM 1069) were purchased from the Deutsche Sammlung von Mikroor-ganismen und Zellkulturen, Braunschweig, Germany.
Pseudomonas putida EM42 was generously provided
by Esteban Martínez-García at the Centro Nacional de Biotecnología, Madrid, Spain. Four previously reported isolates (B, C, 9.1 and 19), with tentative identifications, were used. Isolate B (Pseudomonas sp. strain B; DSM
104484) and isolate C (Pseudomonas plecoglossicida
strain C; DSM 104486) were isolated from mature com-post samples [29] and isolate 9.1 (Pseudomonas decep-tionensis) and isolate 19 (R. erythropolis) were isolated from sediments of the Baltic Sea [30].
Culture media and carbon source
M9 medium was used for all the solid and liquid culture experiments. The media consist of M9 salts (containing per L: 6 g Na2HPO4, 3 g KH2PO4, 1 g NH4Cl, 0.5 g NaCl), 2 mM MgSO4, 100 µM CaCl2 and 10 mL L−1 trace ele-ment mixture [31, 32]. All the media components were
either autoclaved or sterile filtered. The final pH was tuned to 7.
If lignin or depolymerized lignin (DL) was used as a carbon source, the pH was adjusted approximately to 7 using 50% H2SO4, before adding it to the M9 medium. At pH 7, lignin or DL was stable at no more than 1 g/L. Henceforth, for liquid culture experiments, a concentra-tion of 1 g/L was used to enable biomass measurements.
If lignin model compounds were used as a carbon source, 50 mM stock solutions were prepared and stored (4 °C) for use within 2 weeks. Model compounds, if not soluble in water, were dissolved using a few drops of 5 N NaOH. The final pH of cultivation media containing lignin model compounds was 7. All the chemicals, rea-gents and materials used were obtained from either VWR (West Chester, PA, USA) or Sigma-Aldrich (St. Louis, USA), unless specified.
Growth on plates
Plates were prepared using a final concentration of 1.5% agar in M9 medium. The carbon source utilized was 4 g/L glucose, 5 mM vanillin/guaiacol or 1–5 g/L DL. The prepared plates were stored (4 °C) until further use. For screening of several organisms in a single plate, the plates were equally gridded and each grid was inoculated with a single strain. The inoculated plates were sealed (parafilm) and incubated (30 °C).
The lignin and lignin model compound plates were ini-tially inoculated from a freshly grown glucose plate (in M9 medium). Later, when a few colonies were visible, it was re-streaked on to the fresh plates containing the same carbon source. This was performed to maintain the microbial adaptation to a particular carbon source.
Liquid culture experiments
Liquid culture experiments were conducted in 250-mL shake flasks containing 50-mL culture media. The car-bon source added was either 10 g/L glucose (pre-culture), 5 mM guaiacol, 3 mM each of guaiacol, vanillin and 4-HBA (4-hydroxybenzoic acid), 1 g/L DL supplemented with 5 g/L glucose (high-cell density experiments), or 1 g/L lignin or DL (low-cell density experiments).
(SEC—size-exclusion chromatography) and consumption of monomers (UHPLC—ultra-high-performance liquid chromatography).
Biomass measurements
Biomass growth was measured spectrophotometrically by optical density at 620 nm (OD620). The color of Kraft lignin is dark and it significantly affects the absorbance measurements; hence, the culture was centrifuged to remove cells and the obtained supernatant was used as a blank prior biomass measurements. The samples, when-ever required, were diluted with water/saline to stay in the linear range of optical density (0.03–0.3), in which case, the supernatant was also diluted with the same fac-tor. Subsequently, the cells were removed by centrifuga-tion (3 min at 12,300g) and the supernatants were kept at − 20 °C for UHPLC and SEC analyses.
Calculation of yield and rates
Growth rate, uptake rate and yield were calculated for
R. opacus on 5 mM guaiacol. Biomass dry weight was
measured at the end of cultivation. This was used to con-vert the optical density into biomass concentration with a response factor of 0.4. Biomass yield (YSX), expressed in both g/g and g/mmol, was calculated using the phase plane plot of biomass produced and substrate utilized. The maximum specific growth rate (µ) (1/h) was deter-mined from the plot of natural logarithm of biomass in the broth over time. The specific substrate uptake rate (qSubstrate) was calculated by dividing µ with YSX.
UHPLC analysis
The frozen samples were thawed, mixed and filtered (0.2-µm pore size) before analysis. A Waters Acquity UPLC system connected with a photodiode array detector (Waters, Milford, MA, USA) was operated for the analy-sis of phenolic compounds. The column used for separa-tion was Ethylene Bridged Hybrid C18 with a length of 100 mm, 2.1-mm internal diameter and 1.7-µm particle size. Samples were injected at a volume of 2.5 µL and the temperature of the column was kept at 47 °C. The mobile phase was composed of 3% acetonitrile, 95% water, 2% acetic acid (fraction A) and 85% acetonitrile, 13% water, 2% acetic acid (fraction B).
The analysis method was obtained from Schwarz et al. [33] with minor modifications. A flowrate of 0.6 mL/min was used. The LC gradient elution method was as fol-lows: 100% A at time 0, decreased to 90% A in 5 min, held at 90% A for 2 min and decreased to 25% A in 4.5 min. Following the gradient, the column was washed for 5 min with 100% B and was equilibrated for 5 min with 100% A. The chromatographic system was controlled by Acquity
UPLC Console and the data were processed using the Empower 3 software (Waters, Milford, MA, USA).
If unknown peaks appeared as a result of metabolic intermediates excretion, MS–MS analysis [30] was per-formed to identify and confirm the respective com-pounds. Later, the identified peaks were quantified using standards in UHPLC.
Size‑exclusion chromatography
The molecular weight distributions (MWDs) of differ-ent lignin samples were determined with a size-exclusion chromatography (SEC) system, following an established method [34]. The setup adopted for the size measure-ments was a Waters 600E high-performance liquid chro-matography (HPLC) system (Waters, Milford, MA, USA) equipped with a Waters 2414 refractive index detector, a Waters 486 ultraviolet (UV) tunable absorbance detector, and an analytical column packed with 30 cm of Superdex 30 and 30 cm of Superdex 200 (GE Healthcare, Uppsala, Sweden). The column was operating at ambient tempera-ture and eluted with 125 mM NaOH solution (analytical grade) as mobile phase at a flowrate of 1.0 mL/min. Cali-bration was carried out using polyethylene glycol (PEG) standards ranging from 400 to 35,000 g/mol in the eluent (Merck Schuchardt OHG, Hohenbrunn, Germany). The samples were diluted at concentrations of 0.5 mg/mL in the eluent and the solutions were filtered using a 0.2-µm filter (Schleicher and Schuell, Dassel, Germany) to get rid of any suspended matter. Finally, about 500 µL from the filtered solution was injected into the SEC system for data acquisition. Due to comparison with incorporated PEG standards, both the molecular weight and the molecular number should be interpreted relatively. UHPLC analy-sis of fractions collected after SEC revealed the pres-ence of aromatic monomers in the 0.4 kDa peak fraction (Additional file 1: Figure S1). The monomers were subse-quently identified and quantified using UHPLC.
Results
Bacterial screening on agar plates with depolymerized lignin
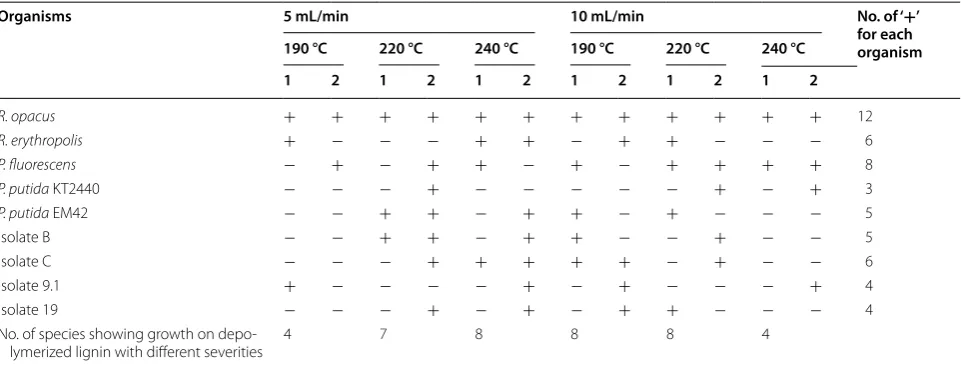
with a reduced DL concentration (2 g/L). Within the first 2 weeks, colonies were formed by R. opacus on almost all plates—although only a few at each plate. After one addi-tional week, some colonies were also seen for a few other organisms (Table 1). The growth on these plates was somewhat ambiguous for some of the organisms, but was clearly visible when the organisms were re-streaked onto fresh plates with 1 g/L DL (not shown).
Shake flask experiments with depolymerized lignin
Rhodococcus opacus DSM 1069 showed growth on the
largest number of plates (12), followed by P. fluorescens
DSM 50090 (8). These two organisms were chosen for experiments with liquid cultures on DL. In addition,
P. putida EM42 was included due to the well-known
robustness of its parental strain KT2440 [29]. Further-more, the strain EM42 is streamlined for industrial appli-cations by heavy genome editing and hence of interest as a host organism [37]. Based on the previous work on chemical lignin depolymerization [27], a temperature of 220 °C was chosen for preparation of a larger batch of depolymerized lignin for liquid cultures. The yield of lower-molecular weight lignin compounds is likely lower than at 240 °C but the temperature is further from the coking point (250 °C) [27], and preferable for reasons of operational stability. DL, 1 g/L, produced at a flow rate of 5 mL/min and a temperature of 220 °C was supple-mented to M9 medium and used in these experiments. Low inoculum flask experiments (initial OD < 0.01) were conducted with both depolymerized and non-depolym-erized lignin. A non-inoculated control flask was also
included to monitor potential changes in the background OD due to lignin precipitation.
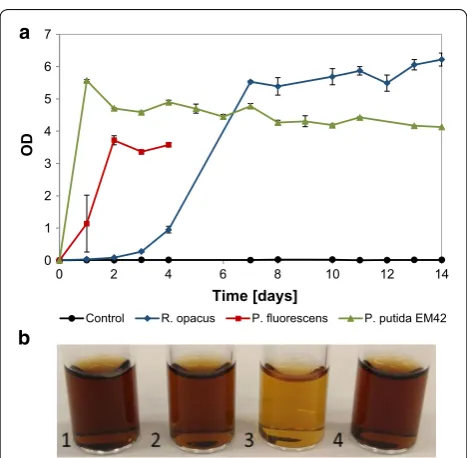
The OD in cultures of P. fluorescens reached a plateau after 1 day at value of about 0.1, and similar trend was seen for P. putida EM42 and R. opacus, but on days 2 and
Table 1 Growth of bacterial strains on agar plates with 2 g/L depolymerized lignin in M9 medium
The lignin samples (originating from [27]) had been depolymerized with two different flow rates (5 and 10 mL/min) and three different severities (190, 220, 240 °C) for each flow rate. The plates were incubated for 3 weeks at 30 °C. The isolates were previously tentatively reported as Pseudomonas sp. (B); P. plecoglossicida (C); P. deceptionensis (9.1); and Rhodococcus erythropolis (19). Biological duplicates are indicated as 1 and 2. (+ growth; − no growth)
Organisms 5 mL/min 10 mL/min No. of ‘+’
for each organism 190 °C 220 °C 240 °C 190 °C 220 °C 240 °C
1 2 1 2 1 2 1 2 1 2 1 2
R. opacus + + + + + + + + + + + + 12
R. erythropolis + − − − + + − + + − − − 6
P. fluorescens − + − + + − + − + + + + 8
P. putida KT2440 − − − + − − − − − + − + 3
P. putida EM42 − − + + − + + − + − − − 5
Isolate B − − + + − + + − − + − − 5
Isolate C − − − + + + + + − + − − 6
Isolate 9.1 + − − − − + − + − − − + 4
Isolate 19 − − − + − + − + + − − − 4
No. of species showing growth on depo‑
lymerized lignin with different severities 4 7 8 8 8 4
0 0.05 0.1 0.15 0.2
OD
0 0.05 0.1 0.15 0.2
8 10 12 14
0 2 4 6
0 2 4 6 8 10 12 14
OD
Time [days]
R. opacus P. fluorescens P. putida EM42 Control
a
b
3, respectively (Fig. 1a). P. fluorescens formed aggregates after 4 days and thereafter, it was not possible to measure the cell density by OD; microscopic analysis revealed that the aggregates were bacterial clusters. For all organisms, formation of biofilms was seen at the air–liquid interface of the flask after 4 days. The biofilms were re-suspended before sampling. In the case of the non-depolymerized lignin, less increase in OD was observed, but a small growth was detected for all three organisms in the first 2 days, after which the OD stayed constant until day 14 (Fig. 1b). The maximum OD reached for non-depolymer-ized lignin was approximately one-third of that obtained with depolymerized lignin. This is in line with the fact that unprocessed lignin has a lower availability of mono-mers/oligomers for direct consumption than the depo-lymerized lignin.
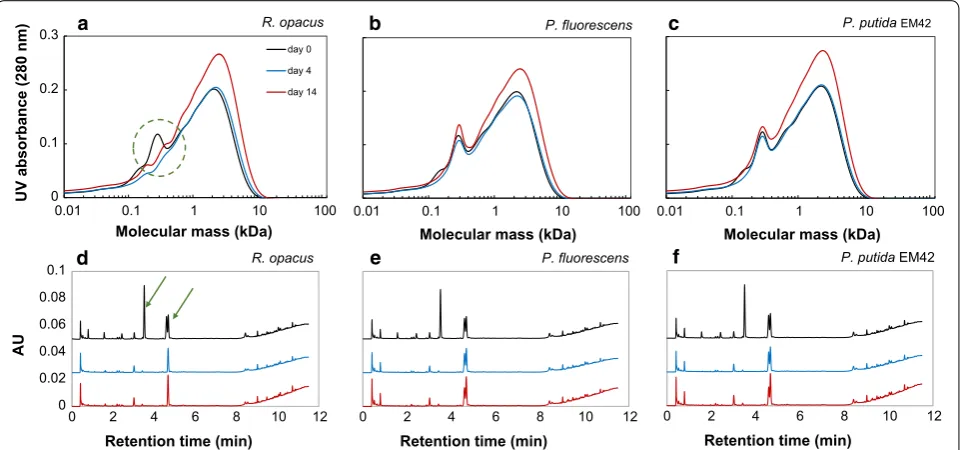
From SEC analyses, it was found that the low-molec-ular weight fraction (0.1–0.4 kDa) of the DL disap-peared within 4 days in the cultures with R. opacus, indicating a possible consumption of these compounds (Fig. 2a). In the cultures of P. fluorescens, the peak for compounds between 0.1 and 0.2 kDa disappeared, and minor effects were possibly seen also for other frac-tions in the first 4 days (Fig. 2b). In the case of P. putida
EM42, only compounds between 0.1 and 0.2 kDa dis-appeared, with no other change in the MWD (Fig. 2c).
The peak area and height for the SEC analyses at day 14 were increased for all cultivations, which is prob-ably due to lignin reconfiguration/repolymerization (Fig. 2a–c).
Monomer analysis in depolymerized lignin
Ultra-high-performance liquid chromatography analy-sis showed the presence of several monomers, some of which have previously been identified by supercritical fluid chromatography–mass spectrometry [27, 38]. The previously identified compounds found in the DL were 4-HBA (retention time 1.6 min), vanillate (2.4 min), vanillin (3.5 min), guaiacol (4.6 min) and acetovanil-lone (4.7 min). These monomer peaks were quantified by UHPLC and the yields based on initial lignin were found to be 3.5, 1.3, 0.95, 0.31, and 0.27 wt%, respec-tively, for guaiacol, vanillin, acetovanillone, vanil-late and 4-HBA, which adds up to the total monomer yield of 6.3 wt%. From the UHPLC chromatograms, it appears that all three organisms consumed 4-HBA, vanillate and vanillin within 4 days (Fig. 2d–f). In addition, R. opacus consumed guaiacol as well as an unknown compound that gave a peak eluting at 0.8 min. None of the organisms consumed acetovanillone.
12
Retention time (min)
P. fluorescens
0 0.02 0.04 0.06 0.08 0.1
12
AU
Retention time (min) R. opacus
d
100
Molecular mass (kDa) P. putida EM42
c
0.01 0.1 1 10 100
Molecular mass (kDa) P. fluorescens
b
0 0.1 0.2 0.3
100
UV absorbance (280 nm
)
Molecular mass (kDa) R. opacus
day 0 day 4 day 14
a
0 2 4 6 8 10
0 2 4 6 8 10
0.01 0.1 1 10
0.01 0.1 1 10
0 2 4 6 8 10 12
Retention time (min)
P. putida EM42
e f
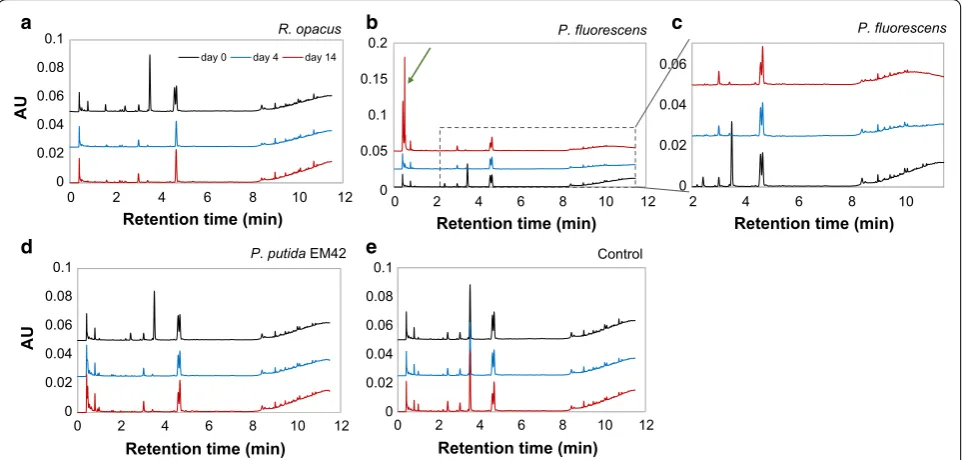
Fig. 2 SEC (a–c) and UHPLC (d–f) chromatograms of 1 g/L depolymerization lignin on days 0, 4 and 14 after bacterial conversion by R. opacus, P. fluorescens and P. putida EM42. The bacterial cultures, which were inoculated with a single colony, were grown using depolymerized lignin as the only carbon source in M9 medium. In the UHPLC chromatograms (d–f), the peaks at retention times 1.6, 2.4, 3.5, 4.6 and 4.7 min were identified as 4‑HBA, vanillate, vanillin, guaiacol and acetovanillone, respectively. The consumption of low‑molecular weight fraction (0.1–0.4 kDa) by R. opacus
Flask experiments with depolymerized lignin and glucose Experiments were also made in which glucose (5 g/L) was added as a second carbon source, allowing an ini-tial growth phase and a higher biomass concentration for conversion of the DL (1 g/L). All organisms showed growth due to glucose (Fig. 3a), and the fastest growth was found for P. putida EM42 which obtained its maxi-mum OD within 24 h. P. fluorescens achieved its maxi-mum OD within 2 days. For R. opacus the initial growth phase lasted 5–7 days, but the OD kept increasing slowly throughout the entire experiment (Fig. 3a). Similar to the experiments with low cell density, P. fluorescens formed aggregates after day 4, and hence it was not possible to monitor the cell density beyond that time. Interestingly, there was a noticeable reduction in media color for P. flu-orescens (Fig. 3b).
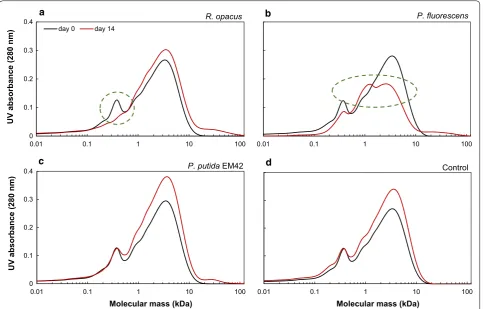
Size-exclusion chromatography analyses showed that the lower-molecular weight fraction (between 0.1 and 0.4 kDa) was consumed by R. opacus (Fig. 4a), similar to the experiments without glucose (Fig. 2a). There was, in contrast, a large change in the SEC chromatograms in the cultivations of P. fluorescens. The peak height of the largest fraction (2–7 kDa) was markedly reduced. Part of the lower-molecular weight fraction also remained unconsumed. The SEC chromatogram of P. putida EM42 was almost identical to the control, i.e., no major con-version of any fraction was found. An overall increase in
peak height between 1 and 10 kDa was observed also for the control, which shows that this change is not due to microbial activity. A slight increase in molecular weight between 15 and 100 kDa was observed for all the inocu-lated samples (Fig. 4).
The UHPLC chromatograms showed similar patterns for the conversion of the monomers by all the three organisms (Fig. 5) as in the experiments without added glucose (Fig. 2). However, one significant difference was the occurrence of new large peaks at short residence times (0.4–0.5 min) in the experiments with P. fluorescens
(Fig. 5b).
Shake flask experiments with aromatic compounds
The UHPLC analyses of the shake flask experiments with DL, indicates consumption of guaiacol by R. opa-cus (cf. Figs. 2d and 5a), a rather uncommon trait among microbes. Consumption of guaiacol was, therefore, tested in shake flask experiments of R. opacus using guaiacol (5 mM) as the only source of carbon and energy, and growth on guaiacol was indeed confirmed (Fig. 6). Inocu-lum was taken from agar plates with guaiacol and no lag phase was observed in the shake flask cultures. A specific growth rate of 0.2 (± 0.001) h−1 and a biomass yield of 0.7 (± 0.02) gcdw/g was obtained and a complete conversion of guaiacol was achieved with a specific conversion rate of 2.4 (mmol/gcdw/h).
The main identified low-molecular weight aromatic compounds in the DL, apart from guaiacol, were vanil-lin, vanillate and 4-HBA (4-hydroxybenzoate). Additional shake flask experiments were made, in which a mixture of 3 mM each of guaiacol, vanillin and 4-HBA served as carbon and energy source for growth of R. opacus, P. fluo-rescens and P. putida EM42. These three compounds also represent different branches of the upper-funneling/β-ketoadipate pathways [1].
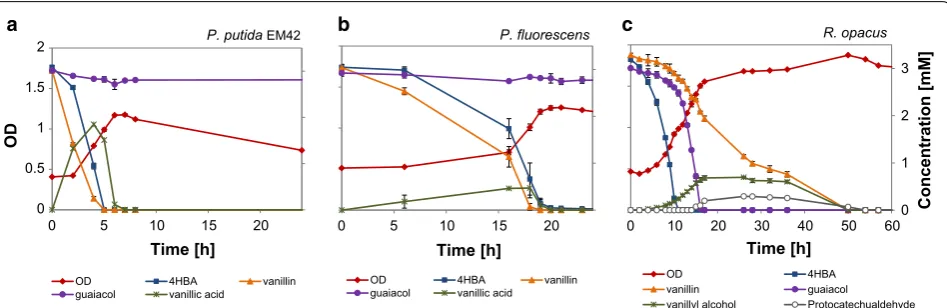
The fastest growth was obtained for P. putida EM42, which reached its maximum OD in 6 h (Fig. 7a). Vanillin and 4-HBA were converted/consumed almost simultane-ously. Vanillin was converted into vanillic acid, which was excreted by the cell, then subsequently taken up (Fig. 7a). Guaiacol, however, remained unconsumed even after 200 h in EM42. P. fluorescens showed a somewhat longer lag phase, but after this, vanillin and 4-HBA were simul-taneously converted/taken up (Fig. 7b). The conversion of vanillin into vanillic acid was similar to that of P. putida
EM42 and guaiacol remained unconsumed for 200 h. Multiauxic growth was observed in case of R. opacus, which reached its maximum OD in around 50 h (Fig. 7c). The substrate consumption was sequentially starting with 4-HBA, which was consumed in 11 h, and after the depletion of 4-HBA, guaiacol was consumed within 17 h. Interestingly, R. opacus converted vanillin into 0
1 2 3 4 5 6 7
0 2 4 6 8 10 12 14
OD
Time [days]
Control R. opacus P. fluorescens P. putida EM42
a
b
Fig. 3 a Growth (OD) of R. opacus, P. fluorescens and P. putida EM42 on 1 g/L depolymerized (at 220 °C with 2‑min residence time) lignin supplemented with 5 g/L glucose in M9 medium. A non‑inoculated control is shown with a black line. b Change in media color on day 14 for 1‑non‑inoculated control; 2‑R. opacus; 3‑P. fluorescens; 4‑P. putida
vanillyl alcohol—partly concomitant with the conversion of 4-HBA and guaiacol. A slight excretion of protocate-chualdehyde was observed in the medium. The remain-ing vanillin and the excreted protocatechualdehyde and vanillyl alcohol were all consumed around 50 h (Fig. 7c).
Discussion
The present study aimed to identify bacterial strains capable of bioconversion of pretreated Indulin AT—a technical softwood Kraft lignin. Kraft lignin is a complex substrate with high molecular weight making it a difficult substrate for direct microbial uptake, and therefore, a previously developed alkaline depolymerization method was employed to break down a part of the higher-molec-ular weight lignin fragments into compounds of lower molecular weight [27]. The nine bacterial strains/iso-lates (cf. Table 1) examined here have been previously reported to metabolize lignin-related compounds [17, 21, 29, 35, 36, 39], and fall into two phyla (Proteobacteria and Actinobacteria), with a significant evolutionary distance between them. During the plate screening with DL, an initial concentration of 5 g/L was already inhibitory and
hence, no growth was observed within the first 3 weeks. It is well known that several aromatic compounds, e.g., vanillin, are inhibitory to microbial growth and metabo-lism of many bacteria and yeasts [40]. However, the total concentration of quantified aromatic monomers in the 5 g/L DL was only in the range of few millimoles (2.3 mM), well below the concentrations of the defined medium tested at which P. putida EM42, P. fluorescens, and R. opacus all grew (Fig. 7). This suggests that the inhibition is due to the presence of other unknown toxic compounds present in the depolymerisate. When the concentration was decreased to 2 g/L DL, a few colo-nies appeared in 2 weeks. An adaption of at least 2 weeks was essential for the organisms to initiate growth on DL plates (Table 1). Upon re-streaking to new lignin plates, the growth was rather quick (3 days).
In liquid cultures of R. opacus, P. fluorescens and P.
putida EM42, the initial increase in OD was due to the
uptake of the readily available low-molecular weight lignin compounds in the DL. Later, there was a station-ary phase for 8–10 days, after which a slight further growth could be seen (Fig. 1a). Possibly, enzymes for the
100
P. fluorescens
0 0.1 0.2 0.3 0.4
0.01 0.1 1 10
0.01 0.1 1 10 100
UV absorbance (280 nm
)
R. opacus
day 0 day 14
100
Molecular mass (kDa)
Control
0 0.1 0.2 0.3 0.4
0.01 0.1 1 10
0.01 0.1 1 10 100
UV absorbance (280 nm
)
Molecular mass (kDa)
P. putida EM42
a b
c d
breakdown of HMW (higher-molecular weight) lignin were expressed during this time and LMW (lower-molecular weight) fragments were obtained. It was not possible to measure the growth of P. fluorescens after the first 3 days due to the aggregation of cells in the culture medium. Such behavior of cell aggregation and increased hydrophobicity has previously been observed in P. putida
CP1 [41, 42] and P. fluorescens [21] when grown under stressful conditions. Due to the reduction in size of cells under these conditions, the increase in cell counts has
previously been shown to be in disagreement with the cell dry weight and optical density [41].
SEC analyses at day 14 indicated an increase in the average molecular weight (Fig. 2). The main change—at 1–10 kDa—was observed not only for the inoculated cul-tures, but also for the non-inoculated lignin (cf. Fig. 4d). This phenomenon is, therefore, probably not a result of microbial action, but may be due to instability of lignin fragments, which undergoes reconfiguration and results in higher UV absorbance. The slight increase in molecu-lar weight (in the range of 15–100 kDa) for all the inoc-ulated flasks in high-cell density cultures (Fig. 4a–c) is probably due to the secretion of extracellular laccases. Even though the secreted extracellular enzymes are expected to break down the higher-molecular weight lignin, they are also known for polymerizing phenolic compounds [43]. The balance between the depolym-erizing and polymdepolym-erizing abilities of these enzymes depends on several factors (reaction temperature, origin of enzyme, feedstock structure, etc.) and has been previ-ously reported [44].
The use of cultures with glucose as a co-substrate together with DL revealed the ability of P. fluorescens to break down the HMW fraction (Fig. 4b). Both the reduc-tion in color of the DL media (Fig. 3b) and the reducreduc-tion of peak size in the UPLC chromatograms after 10 min (Fig. 5c) clearly showed that this organism degrades
0 0.05 0.1 0.15 0.2
Retention time (min) P. fluorescens
0 0.02 0.04 0.06
Retention time (min) P. fluorescens
0 0.02 0.04 0.06 0.08 0.1
AU
Retention time (min) P. putida EM42
0 0.02 0.04 0.06 0.08 0.1
Retention time (min)
Control 0
0.02 0.04 0.06 0.08 0.1
0 2 4 6 8 10 12 2 4 6 8 10
4 6 8 10 12 0 2 4 6 8 10 12
0 2
0 2 4 6 8 10 12
AU
Retention time (min) R. opacus day 0 day 4 day 14
a b
d e
c
Fig. 5 UHPLC chromatograms of 1 g/L depolymerized lignin on days 0, 4 and 14 after high‑cell density bacterial conversion by aR. opacusb, c P. fluorescens, dP. putida EM42 e non‑inoculated control in M9 medium. The peaks at retention times 1.6, 2.4, 3.5, 4.6 and 4.7 min were identified as 4‑HBA, vanillate, vanillin, guaiacol and acetovanillone, respectively. The occurrence of new large peaks at retention times 0.4–0.5 min for P. fluorescens on day 14 are highlighted with a green arrow. For a better visibility of the newly formed peaks on day 14, the chromatograms are arranged in reverse order (bottom–top) for b, c
0 1 2 3 4 5
0 0.3 0.6 0.9 1.2
0 3 6 9 12
Concentration [mM]
OD
Time [h]
OD Guaiacol
HMW lignin fragments. It was not determined to what extent the degradation products were consumed. Addi-tional peaks appearing in the UHPLC chromatograms indicated that not all the generated compounds were consumed (Fig. 5b). This is in agreement with the reports by Salvachúa et al. on P. fluorescens Pf-5, which was found able to depolymerize HMW lignin, but was not able to consume the produced monomers [21]. In contrast to a few previous reports on the ability of P. putida KT2440 to breakdown HMW lignin [20, 21], no such behavior was observed for P. putida EM42 strain, despite its genetic similarities with KT2440 [37]. This could be due to the different lignin source used in this study, since the lignin obtained from corn stover differs much from the techni-cal lignin (Indulin AT) in terms of the structure, primary building blocks and successive breakdown products [45, 46]. R. opacus has previously been reported to break down HMW corn stover lignin to some extent, but a larger conversion was obtained with R. jostii in the same study [24]. Co-fermentation using both these strains, fur-thermore, proved to increase the conversion significantly [24].
Laccases and peroxidases are known to be responsi-ble for higher-molecular-weight-lignin breakdown [47, 48]. Hence, BLAST (Basic Local Alignment Search Tool) searches [49] were performed using well-characterized DyP-type peroxidases [50, 51] and laccases [52] against the genome of P. fluorescens (taxid: 294), P. putida
KT2440 (taxid: 160488) and R. opacus (taxid: 37919) to discover, if there are any putative enzymes responsible for lignin breakdown (Additional file 1: Tables S1 and S2). Two enzymes from the subfamily of DyPA and three from DyPB were selected from R. jostii RHA1 and P. fluo-rescens Pf-5 [16, 53, 54]. As the enzymes from subfam-ily DyPC and DyPD were not found/annotated either in
Pseudomonas or Rhodococcus group of organisms, those
were selected from the well-studied Amycolatopsis sp. 75iv2 and Bjerkandera adusta, respectively [50, 55]. Additionally, two laccases were selected, one from P. fluo-rescens and another from R. opacus PD630. It seems that laccases, DyPA and DyPB, are widely present (note the absence of DyPA in KT2440) in all the three organisms used in this study (Additional file 1: Tables S1 and S2). However, the inability of R. opacus and P. putida to depo-lymerize the HMW lignin to the expected level might be due to the inefficiency of enzyme secretion or due to the lack of gene expression in the given environment.
P. fluorescens was the only organism in which proteins
similar to DyPC and DyPD were found (Additional file 1: Table S1). Steady-state enzyme kinetics of the DyP sub-classes has revealed that C- and D-type DyPs have higher peroxidase activities than A- and B-type DyPs [54], pos-sibly explaining the much more efficient degradation of high-molecular weight lignin fractions by P. fluorescens
than by the other organisms studied.
The growth of organisms on the mixture of model compounds (guaiacol, vanillin and 4-HBA) was in good agreement with their growth on DL—in terms of the consumption of monomers. Depending on the origin of lignin, its mode of separation and the method of depolymerization, very different low molecular com-pound distributions can be obtained. Previously identi-fied compounds in the depolymerized softwood lignin samples using the depolymerization method employed here have been 4-HBA, vanillate, vanillin and guaiacol [38]. Similar compounds were also reported in other related substrates (Additional file 1: Table S3). These compounds belong to different branches of the upper-funneling pathways, which mostly converge to either protocatechuic acid or catechol that eventually enters
0 1 2 3
0 10 20 30 40 50 60 Concentration [mM]
Time [h]
R. opacus
OD 4HBA
vanillin guaiacol
vanillyl alcohol Protocatechualdehyde Time [h]
P. fluorescens
OD 4HBA vanillin
guaiacol vanillic acid
0 0.5 1 1.5 2
0 5 10 15 20
0 5 10 15 20
OD
Time [h]
P. putida EM42
OD 4HBA vanillin
guaiacol vanillic acid
a b c
the beta-ketoadipate pathway and promotes cell growth [56]. In this study, 4-HBA, vanillin and vanillate were consumed by all the three organisms, shown both from liquid cultures on DL and in model media (M9).
4-HBA, which belongs to the p-coumaryl branch of
the upper-funneling pathway, has been reported to be converted by a number of microbes, including Acineto-bacter baylyi, Cupriavidus necator, P. aeruginosa, and is apparently not very toxic [29, 57–59]. In contrast, van-illin and guaiacol (belonging to the coniferyl branch of the funneling pathway) have been reported to be quite toxic to many organisms [60–65]. Microbial detoxifica-tion mechanisms of vanillin are related to conversion of its aldehyde group either by oxidation into vanillic acid or by reduction into vanillyl alcohol [66]. The con-version of vanillin towards the less toxic intermediate vanillic acid is common in Pseudomonas species [29, 67]. The vanillic acid is—possibly following a period of excretion and accumulation in the medium—fur-ther converted into protocatechuic acid entering the beta-ketoadipate pathway. This was observed in our liq-uid cultivations for P. fluorescens and P. putida EM42 (Fig. 7a, b). Strong effects on gene expression have been reported when vanillin was provided as a sole carbon source to P. putida KT2440. The expression of more than 600 genes was changed, including not only the beta-ketoadipate pathway but also the central energy metabolism and genes associated with solvent toler-ance [68].
Interestingly, in our study, R. opacus converted vanil-lin into vanillyl alcohol in the presence of other carbon sources (guaiacol and 4-HBA) (Fig. 7c). The detoxifica-tion of vanillin to vanillyl alcohol is mainly reported not only in yeasts [64], but also in some bacterial species such as Gluconacetobacter xylinus, which converted vanillin (0.5 mM) into vanillyl alcohol at 80% yield, in the presence of 25 g/L glucose [63]. In the current study, the excretion of vanillyl alcohol stopped after exhaustion of 4-HBA and guaiacol and the remaining vanillin was metabolized within 50 h. Enzymes respon-sible for vanillin degradation (vanillin dehydrogenase, vanillate O-demethylase and vanillyl-alcohol oxidase) have been identified in Rhodococcus, but during growth on vanillin, vanillate O-demethylase was found to be more upregulated than vanillin dehydrogenase [69]. The inefficient expression of vdh (vanillin dehydroge-nase) is a possible reason for the detoxification of van-illin to vanillyl alcohol instead of the more common vanillic acid. The slight generation of protocatechualde-hyde could be due to the action of the guaiacol dem-ethylase system, which is likely to be highly expressed in this mixture. This system may recognize vanillin with
low affinity, remove its methoxy moiety and give rise to small amounts of protocatechualdehyde.
Guaiacol is one of the main depolymerization prod-ucts in alkaline treatment of softwood lignin [38]. R. opa-cus was the only organism tested which showed growth on guaiacol plates (Additional file 1: Table S4). When grown in liquid cultures, the growth rate on guaiacol was 0.2 h−1, which is slightly higher than the growth of the same strain on vanillate (0.127 h−1) and 4-HBA (0.126 h−1) [17]. Some bacterial species have previously been reported to be able to grow on guaiacol [70, 71] or possess genes related to guaiacol breakdown [72]. Purifi-cation and characterization of cytochrome P450 involved in guaiacol demethylation have been reported in Morax-ella sp., R. rhodochrous and Amycolatopsis sp. ATCC 3116 [73–75]. A partial N-terminal amino acid sequence of cytochrome P450 responsible for the conversion of guaiacol into catechol was identified for the first time in
R. rhodochrous [74]. This 21 amino acid-long sequence
was used to find the corresponding protein (UniprotKB: W4A0P3) in R. rhodochrous (ATCC 21198), which was subsequently blasted against the genome of R. opacus
(taxid: 37919) and an identity of 81% was found, which strongly indicates the presence of a similar protein. When the same enzyme was blasted against the genome of KT2440 (taxid: 160488), no similar protein was found and with P. fluorescens (taxid: 294), only a protein with low identity (28%) was found. Pseudomonas sp. strain PN-1 has been reported to convert guaiacol into catechol under anaerobic conditions [76]. It was suggested that the anaerobic demethylation system of this species has a broader specificity in the degradation of lignin molecules than the aerobic enzyme [76]. P. putida KT2440 pos-sesses genes encoding proteins necessary to metabolize catechol [18], and recently the cloning of genes respon-sible for the guaiacol-demethylating cytochrome P450 has enabled growth on guaiacol [72, 77]. As the softwood lignin contains a significant amount of G-type lignin, the utilization of guaiacol remains essential.
Conclusions
to some extent. P. fluorescens showed a considerable abil-ity for breakdown of HMW lignin. Even more interesting was the ability of R. opacus to consume guaiacol, which is the main monomer present after the depolymeriza-tion of softwood-based lignin. The yields of monomeric compounds obtained after depolymerization of softwood Kraft lignin typically amount to only a few percent, and this would likely need to be increased to enable com-mercial processes. However, the organisms of this study are certainly of interest—either as potential host organ-isms, or sources of genetic material, in development of microbes for the production of fine/bulk chemicals from softwood lignin.
Additional file
Additional file 1: Figure S1. (a) The SEC chromatogram of 1 g/L depo‑ lymerized (at 220 °C, 5 mL/min) lignin. Red‑dotted lines represent the fractions collected. The collected fraction at 95–108 minutes corresponds to the 0.2–0.4 kDa peak in the SEC chromatograms calibrated with PEG standards. (b) UHPLC chromatograms of the fractions obtained from SEC. The peaks in the fraction 95–108 minutes correspond to aromatic monomers (Vanillin‑3.5 min; guaiacol‑4.6 min; acetovanillone‑4.7 min). Table S1. Results of homology BLAST with the previously well‑character‑ ized DyP proteins against the genome of the organisms used in this study. P. putida EM42 strain used in this study is the modified version of KT2440 and hence, the genome of KT2440 (parental strain) was used for BLAST searches. Proteins with identity more than 75 % are emphasized in green. Proteins that were found absent and the ones with less than 30 % query are highlighted in red. P. fluorescens highlighted in blue is the only organ‑ ism with proteins similar to DyPC and DyPD. Table S2. Results of homol‑ ogy BLAST with laccases against the genome of the organisms used in this study. P. putida EM42 strain used in this study is the modified version of KT2440 (parental strain) and hence, the genome of KT2440 was used for BLAST searches. Proteins with identity more than 75 % are emphasized in green. Table S3. Some studies reporting guaiacol, vanillin and related compounds in depolymerized lignin. Table S4. Growth of bacterial strains on agar plates with 5 mM vanillin/guaiacol as the only source of carbon in M9 medium, incubated for 2 weeks at 30 °C. The isolates were previously tentatively reported as Pseudomonas sp. (B); P. plecoglossicida (C); P. decep-tionensis (9.1); and Rhodococcus erythropolis (19). Duplicate experiments were performed and the growth results were similar (++ abundant growth; + growth; − no growth). R. opacus was the only organism to show growth on guaiacol (highlighted).
Abbreviations
DL: depolymerized lignin; SEC: size‑exclusion chromatography; OD: optical density; MWD: molecular weight distribution; UHPLC: ultra‑high‑performance liquid chromatography; UV: ultraviolet; LMW: low molecular weight; HMW: high molecular weight; BLAST: basic local alignment search tool; CFR: continu‑ ous flow reactor; 4‑HBA: 4‑hydroxybenzoate; PEG: polyethylene glycol; HPLC: high‑performance liquid chromatography.
Authors’ contributions
GL, CH and MGG conceived the project. KR, OA, JGH and GL designed the study. KR, OA and MN performed the experiments. All authors discussed and interpreted the results. KR and OA drafted the manuscript. GL, CH and JGH revised the manuscript. All authors read and approved the final manuscript.
Author details
1 Department of Chemical Engineering, Lund University, P.O. Box 124, 221 00 Lund, Sweden. 2 Department of Chemistry, Applied Microbiology, Lund University, P.O. Box 124, 221 00 Lund, Sweden. 3 Present Address: Australian
Institute for Bioengineering and Nanotechnology (AIBN), The University of Queensland, Brisbane, QLD 4072, Australia.
Acknowledgements
This research was financed by the Swedish Foundation for Strategic Research (SSF) through the grant contract RBP14‑0052. C. Hulteberg also acknowledges the Swedish Energy Agency (Contract no. 41288‑1). We would like to thank Esteban Martínez‑García from CNB (Madrid, Spain) for kindly providing a bacterial strain and Per Tunå for the valuable support with CFR setup. We are grateful to Jens Prothmann and Sofia Essén for MS analyses, Kena Li for provid‑ ing depolymerized lignin, Johan Thuvander for technical support with SEC, and Daniel Brink for linguistic advice.
Competing interests
The authors declare that they have no competing interests.
Availability of supporting data
The datasets used and/or analyzed during the current study are available from the corresponding author on reasonable request.
Consent for publication Not applicable.
Ethics approval and consent to participate
This article does not contain any studies with human participants or animals performed by any of the authors.
Funding
This work was financed by the Swedish Foundation for Strategic Research through the Grant Contract RBP14‑0052.
Publisher’s Note
Springer Nature remains neutral with regard to jurisdictional claims in pub‑ lished maps and institutional affiliations.
Received: 16 November 2018 Accepted: 8 March 2019
References
1. Abdelaziz OY, Brink DP, Prothmann J, Ravi K, Sun M, García‑Hidalgo J, Sandahl M, Hulteberg CP, Turner C, Lidén G, Gorwa‑Grauslund MF. Biological valorization of low molecular weight lignin. Biotechnol Adv. 2016;34:1318–46.
2. Zakzeski J, Bruijnincx PC, Jongerius AL, Weckhuysen BM. The catalytic valorization of lignin for the production of renewable chemicals. Chem Rev. 2010;110:3552–99.
3. Rinaldi R, Jastrzebski R, Clough MT, Ralph J, Kennema M, Bruijnincx PCA, Weckhuysen BM. Paving the way for lignin valorisation: recent advances in bioengineering, biorefining and catalysis. Angew Chem Int Ed. 2016;55:8164–215.
4. Upton BM, Kasko AM. Strategies for the conversion of lignin to high‑value polymeric materials: review and perspective. Chem Rev. 2016;116:2275–306.
5. Beckham GT, Johnson CW, Karp EM, Salvachúa D, Vardon DR. Opportuni‑ ties and challenges in biological lignin valorization. Curr Opin Biotechnol. 2016;42:40–53.
6. Ragauskas AJ, Beckham GT, Biddy MJ, Chandra R, Chen F, Davis MF, Davi‑ son BH, Dixon RA, Gilna P, Keller M, et al. Lignin valorization: improving lignin processing in the biorefinery. Science. 2014;344:1246843. 7. Schutyser W, Renders T, Van den Bosch S, Koelewijn SF, Beckham GT, Sels
BF. Chemicals from lignin: an interplay of lignocellulose fractionation, depolymerisation, and upgrading. Chem Soc Rev. 2018;47:852–908. 8. SjÖStrÖM E. Chapter 4—LIGNIN. In: Wood chemistry, 2nd ed. San Diego:
Academic Press; 1993. p. 71–89.
9. Chakar FS, Ragauskas AJ. Review of current and future softwood kraft lignin process chemistry. Ind Crops Prod. 2004;20:131–41.
11. Linger JG, Vardon DR, Guarnieri MT, Karp EM, Hunsinger GB, Franden MA, Johnson CW, Chupka G, Strathmann TJ, Pienkos PT, Beckham GT. Lignin valorization through integrated biological funneling and chemical cataly‑ sis. Proc Natl Acad Sci USA. 2014;111:12013–8.
12. Shi Y, Yan X, Li Q, Wang X, Liu M, Xie S, Chai L, Yuan J. Directed bioconver‑ sion of Kraft lignin to polyhydroxyalkanoate by Cupriavidus basilensis B‑8 without any pretreatment. Process Biochem. 2017;52:238–42. 13. Zhao C, Xie S, Pu Y, Zhang R, Huang F, Ragauskas AJ, Yuan JS. Syn‑
ergistic enzymatic and microbial lignin conversion. Green Chem. 2016;18:1306–12.
14. Barton N, Horbal L, Starck S, Kohlstedt M, Luzhetskyy A, Wittmann C. Enabling the valorization of guaiacol‑based lignin: integrated chemical and biochemical production of cis, cis‑muconic acid using metabolically engineered Amycolatopsis sp. ATCC 39116. Metab Eng. 2018;45:200–10. 15. Shi Y, Chai L, Tang C, Yang Z, Zhang H, Chen R, Chen Y, Zheng Y. Charac‑ terization and genomic analysis of kraft lignin biodegradation by the beta‑proteobacterium Cupriavidus basilensis B‑8. Biotechnol Biofuels. 2013;6:1.
16. Ahmad M, Roberts JN, Hardiman EM, Singh R, Eltis LD, Bugg TD. Iden‑ tification of DypB from Rhodococcus jostii RHA1 as a lignin peroxidase. Biochemistry. 2011;50:5096–107.
17. Kosa M, Ragauskas AJ. Bioconversion of lignin model compounds with oleaginous Rhodococci. Appl Microbiol Biotechnol. 2012;93:891–900. 18. Jiménez JI, Miñambres B, García JL, Díaz E. Genomic analysis of the
aromatic catabolic pathways from Pseudomonas putida KT2440. Environ Microbiol. 2002;4:824–41.
19. Vardon DR, Franden MA, Johnson CW, Karp EM, Guarnieri MT, Linger JG, Salm MJ, Strathmann TJ, Beckham GT. Adipic acid production from lignin. Energy Environ Sci. 2015;8:617–28.
20. Rodriguez A, Salvachua D, Katahira R, Black BA, Cleveland NS, Reed M, Smith H, Baidoo EEK, Keasling JD, Simmons BA, et al. Base‑catalyzed depolymerization of solid lignin‑rich streams enables microbial conver‑ sion. ACS Sustain Chem Eng. 2017;5:8171–80.
21. Salvachúa D, Karp EM, Nimlos CT, Vardon DR, Beckham GT. Towards lignin consolidated bioprocessing: simultaneous lignin depolymerization and product generation by bacteria. Green Chem. 2015;17:4951–67. 22. Le RK, Wells T Jr, Das P, Meng X, Stoklosa RJ, Bhalla A, Hodge DB, Yuan JS,
Ragauskas AJ. Conversion of corn stover alkaline pre‑treatment waste streams into biodiesel via Rhodococci. RSC Adv. 2017;7:4108–15. 23. Kosa M, Ragauskas AJ. Lignin to lipid bioconversion by oleaginous Rho‑
dococci. Green Chem. 2013;15:2070.
24. He Y, Li X, Ben H, Xue X, Yang B. Lipid production from dilute alkali corn stover lignin by Rhodococcus strains. ACS Sustain Chem Eng. 2017;5:2302–11.
25. Numata K, Morisaki K. Screening of marine bacteria to synthesize polyhydroxyalkanoate from lignin: contribution of lignin derivatives to biosynthesis by Oceanimonas doudoroffii. ACS Sustain Chem Eng. 2015;3:569–73.
26. Gellerstedt G. Softwood kraft lignin: raw material for the future. Ind Crops Prod. 2015;77:845–54.
27. Abdelaziz OY, Li K, Tunå P, Hulteberg CP. Continuous catalytic depolymeri‑ sation and conversion of industrial kraft lignin into low‑molecular‑weight aromatics. Biomass Convers Biorefin. 2018;8:455–70.
28. Hu Z, Du X, Liu J, Chang H‑M, Jameel H. Structural characterization of pine kraft lignin: BioChoice lignin vs indulin AT. J Wood Chem Technol. 2016;36:432–46.
29. Ravi K, Garcia‑Hidalgo J, Gorwa‑Grauslund MF, Liden G. Conversion of lignin model compounds by Pseudomonas putida KT2440 and isolates from compost. Appl Microbiol Biotechnol. 2017;101:5059–70. 30. Ravi K, Garcia‑Hidalgo J, Nobel M, Gorwa‑Grauslund MF, Liden G. Biologi‑
cal conversion of aromatic monolignol compounds by a Pseudomonas isolate from sediments of the Baltic Sea. AMB Express. 2018;8:32. 31. Sambrook J, Russell D. Molecular cloning: a laboratory manual. Cold
Spring Harbor: Cold Spring Harbor Laboratory Press; 2001. 32. Pfennig N, Lippert KD. Über das Vitamin B12‑Bedürfnis phototropher
Schwefelbakterien. Archiv für Mikrobiologie. 1966;55:245–56. 33. Schwarz M, Rodríguez MC, Guillén DA, Barroso CG. Development and
validation of UPLC for the determination of phenolic compounds and furanic derivatives in Brandy de Jerez. J Sep Sci. 2009;32:1782–90.
34. Abdelaziz OY, Hulteberg CP. Physicochemical characterisation of technical lignins for their potential valorisation. Waste Biomass Valoriz. 2017;8:859–69.
35. Wei Z, Zeng G, Huang F, Kosa M, Huang D, Ragauskas AJ. Bioconversion of oxygen‑pretreated Kraft lignin to microbial lipid with oleaginous Rhodoc-occus opacus DSM 1069. Green Chem. 2015;17:2784–9.
36. Taylor CR, Hardiman EM, Ahmad M, Sainsbury PD, Norris PR, Bugg TD. Isolation of bacterial strains able to metabolize lignin from screening of environmental samples. J Appl Microbiol. 2012;113:521–30.
37. Martinez‑Garcia E, Nikel PI, Aparicio T, de Lorenzo V. Pseudomonas 2.0: genetic upgrading of P. putida KT2440 as an enhanced host for heterolo‑ gous gene expression. Microb Cell Fact. 2014;13:159.
38. Prothmann J, Sun M, Spegel P, Sandahl M, Turner C. Ultra‑high‑ performance supercritical fluid chromatography with quadrupole‑ time‑of‑flight mass spectrometry (UHPSFC/QTOF‑MS) for analysis of lignin‑derived monomeric compounds in processed lignin samples. Anal Bioanal Chem. 2017;409:7049–61.
39. Nelson KE, Weinel C, Paulsen IT, Dodson RJ, Hilbert H, Martins dos Santos VA, Fouts DE, Gill SR, Pop M, Holmes M, et al. Complete genome sequence and comparative analysis of the metabolically versatile Pseu-domonas putida KT2440. Environ Microbiol. 2002;4:799–808.
40. Franden MA, Pilath HM, Mohagheghi A, Pienkos PT, Zhang M. Inhibition of growth of Zymomonas mobilis by model compounds found in ligno‑ cellulosic hydrolysates. Biotechnol Biofuels. 2013;6:99.
41. Fakhruddin ANM, Quilty B. Measurement of the growth of a floc forming bacterium Pseudomonas putida CP1. Biodegradation. 2007;18:189–97. 42. Farrell A, Quilty B. Substrate‑dependent autoaggregation of Pseudomonas
putida CP1 during the degradation of mono‑chlorophenols and phenol. J Ind Microbiol Biotechnol. 2002;28:316–24.
43. Ghoul M, Chebil L. Enzymatic polymerization of phenolic compounds by oxidoreductases. Dordrecht: Springer; 2012. p. 1–46.
44. Brzonova I, Kozliak EI, Andrianova AA, LaVallie A, Kubátová A, Ji Y. Production of lignin based insoluble polymers (anionic hydrogels) by C. versicolor. Sci Rep. 2017;7:17507.
45. Constant S, Wienk HLJ, Frissen AE, Peinder P, Boelens R, van Es DS, Grisel RJH, Weckhuysen BM, Huijgen WJJ, Gosselink RJA, Bruijnincx PCA. New insights into the structure and composition of technical lignins: a com‑ parative characterisation study. Green Chem. 2016;18:2651–65. 46. Katahira R, Mittal A, McKinney K, Chen XW, Tucker MP, Johnson DK,
Beckham GT. Base‑catalyzed depolymerization of biorefinery lignins. ACS Sustain Chem Eng. 2016;4:1474–86.
47. de Gonzalo G, Colpa DI, Habib MH, Fraaije MW. Bacterial enzymes involved in lignin degradation. J Biotechnol. 2016;236:110–9. 48. Brown ME, Chang MC. Exploring bacterial lignin degradation. Curr Opin
Chem Biol. 2014;19:1–7.
49. Altschul SF, Gish W, Miller W, Myers EW, Lipman DJ. Basic local alignment search tool. J Mol Biol. 1990;215:403–10.
50. Yoshida T, Sugano Y. A structural and functional perspective of DyP‑type peroxidase family. Arch Biochem Biophys. 2015;574:49–55.
51. Colpa DI, Fraaije MW, van Bloois E. DyP‑type peroxidases: a promising and versatile class of enzymes. J Ind Microbiol Biotechnol. 2014;41:1–7. 52. Chauhan PS, Goradia B, Saxena A. Bacterial laccase: recent update on
production, properties and industrial applications. 3 Biotech. 2017;7:323. 53. Rahmanpour R, Bugg TD. Characterisation of Dyp‑type peroxidases from Pseudomonas fluorescens Pf‑5: oxidation of Mn(II) and polymeric lignin by Dyp1B. Arch Biochem Biophys. 2015;574:93–8.
54. Roberts JN, Singh R, Grigg JC, Murphy MEP, Bugg TDH, Eltis LD. Charac‑ terization of dye‑decolorizing peroxidases from Rhodococcus jostii RHA1. Biochemistry. 2011;50:5108–19.
55. Brown ME, Barros T, Chang MC. Identification and characterization of a multifunctional dye peroxidase from a lignin‑reactive bacterium. ACS Chem Biol. 2012;7:2074–81.
56. The eLignin Microbial Database. http://www.elign indat abase .com/. Accessed 12 Apr 2018.
57. Fischer R, Bleichrodt FS, Gerischer UC. Aromatic degradative pathways in Acinetobacter baylyi underlie carbon catabolite repression. Microbiology. 2008;154:3095–103.
•fast, convenient online submission
•
thorough peer review by experienced researchers in your field
• rapid publication on acceptance
• support for research data, including large and complex data types
•
gold Open Access which fosters wider collaboration and increased citations maximum visibility for your research: over 100M website views per year
•
At BMC, research is always in progress.
Learn more biomedcentral.com/submissions
Ready to submit your research? Choose BMC and benefit from: 59. Kuhnigk T, Konig H. Degradation of dimeric lignin model compounds
by aerobic bacteria isolated from the hindgut of xylophagous termites. J Basic Microbiol. 1997;37:205–11.
60. Zaldivar J, Martinez A, Ingram LO. Effect of alcohol compounds found in hemicellulose hydrolysate on the growth and fermentation of ethanolo‑ genic Escherichia coli. Biotechnol Bioeng. 2000;68:524–30.
61. Zaldivar J, Martinez A, Ingram LO. Effect of selected aldehydes on the growth and fermentation of ethanologenic Escherichia coli. Biotechnol Bioeng. 1999;65:24–33.
62. Kitahara Y, Yin T, Zhao X, Wachi M, Du W, Liu D. Isolation of oleaginous yeast (Rhodosporidium toruloides) mutants tolerant of sugarcane bagasse hydrolysate. Biosci Biotechnol Biochem. 2014;78:336–42.
63. Zhang S, Winestrand S, Guo X, Chen L, Hong F, Jönsson LJ. Effects of aromatic compounds on the production of bacterial nanocellulose by Gluconacetobacter xylinus. Microb Cell Fact. 2014;13:62.
64. Wang X, Liang Z, Hou J, Bao X, Shen Y. Identification and functional evaluation of the reductases and dehydrogenases from Saccharomyces cerevisiae involved in vanillin resistance. BMC Biotechnol. 2016;16:31. 65. Capasso R, Evidente A, Schivo L, Orru G, Marcialis MA, Cristinzio G. Anti‑
bacterial polyphenols from olive oil mill waste waters. J Appl Bacteriol. 1995;79:393–8.
66. Shen Y, Li H, Wang X, Zhang X, Hou J, Wang L, Gao N, Bao X. High vanillin tolerance of an evolved Saccharomyces cerevisiae strain owing to its enhanced vanillin reduction and antioxidative capacity. J Ind Microbiol Biotechnol. 2014;41:1637–45.
67. Overhage J, Priefert H, Steinbüchel A. Biochemical and genetic analyses of ferulic acid catabolism in Pseudomonas sp. strain HR199. Appl Environ Microbiol. 1999;65:4837–47.
68. Simon O, Klaiber I, Huber A, Pfannstiel J. Comprehensive proteome analysis of the response of Pseudomonas putida KT2440 to the flavor compound vanillin. J Proteom. 2014;109:212–27.
69. Chen HP, Chow M, Liu CC, Lau A, Liu J, Eltis LD. Vanillin catabolism in Rhodococcus jostii RHA1. Appl Environ Microbiol. 2012;78:586–8. 70. Dardas A, Gal D, Barrelle M, Sauret‑Ignazi G, Sterjiades R, Pelmont J. The
demethylation of guaiacol by a new bacterial cytochrome P‑450. Arch Biochem Biophys. 1985;236:585–92.
71. Sutherland JB. Demethylation of veratrole by cytochrome P‑450 in Strep-tomyces setonii. Appl Environ Microbiol. 1986;52:98–100.
72. Tumen‑Velasquez M, Johnson CW, Ahmed A, Dominick G, Fulk EM, Khanna P, Lee SA, Schmidt AL, Linger JG, Eiteman MA, et al. Accelerating pathway evolution by increasing the gene dosage of chromosomal seg‑ ments. Proc Natl Acad Sci. 2018;115:7105–10.
73. Mallinson SJB, Machovina MM, Silveira RL, Garcia‑Borràs M, Gallup N, Johnson CW, Allen MD, Skaf MS, Crowley MF, Neidle EL, et al. A promiscu‑ ous cytochrome P450 aromatic O‑demethylase for lignin bioconversion. Nat Commun. 2018;9:2487.
74. Eltis LD, Karlson U, Timmis KN. Purification and characterization of cytochrome P450RR1 from Rhodococcus rhodochrous. Eur J Biochem. 1993;213:211–6.
75. Sauret‑Ignazi G, Dardas A, Pelmont J. Purification and properties of cytochrome P‑450 from Moraxella sp. Biochimie. 1988;70:1385–95. 76. Taylor BF. Aerobic and anaerobic catabolism of vanillic acid and some
other methoxy‑aromatic compounds by Pseudomonas sp. strain Pn‑1. Appl Environ Microbiol. 1983;46:1286–92.