Issues
ISSN: 2146-4138
available at http: www.econjournals.com
International Journal of Economics and Financial Issues, 2016, 6(2), 515-522.
Modeling of Human Potential Parameters in the Context of
Innovation and Technological Development of the Country: Case
of Asia-pacific Countries
Natalia Victorovna Kuznetsova
1*, Ekaterina Victorovna Kocheva
2, Nikolay Anatolievich Matev
31Department of World Economy, School of Economics and Management, Far Eastern Federal University, Vladivostok 690950, Russia, 2Department of Business Informatics and Mathematic Methods in Economics, School of Economics and Management, Far Eastern Federal University, Russia, 3Department of Business Informatics and Mathematic Methods in Economics, School of Economics and Management, Far Eastern Federal University, Russia. *Email: [email protected]
ABSTRACT
In this study, human capital is considered as a key factor for the innovative development of the country. The authors proposed an empirical model
of the impact of human development on innovation and technological development of the country. Due to the high differentiation of the Asia-pacific region, classification of countries, which was taken into account later when constructing the regression model, was carried out by defining the object
of study indicators.
Keywords: Asia-pacific Region, Human Capital, Innovations, Patents, Econometric Modeling
JEL Classifications: O, O15
1. INTRODUCTION
In 60-80 years of the last century, there was a tendency to the
emergence of the new economic growth theories (Lucas, Becker, Schultz) proving that the main factor of the economic growth was a human capital. The level of the society development is determined not only by the dominant types of economies, but also by the established hierarchy of values and interests, and the population characteristics, which is “human capital.” The human capital involves the abilities, knowledge, and skills of employees, which give them the opportunity to operate in an economic environment. Investing in human capital tends to lead to higher productivity
and increased production efficiency. A practice has shown that an
increase in human capital through education, better health care and nutrition, affects economic growth, especially in the countries (regions) with low incomes and limited human capabilities.
McCullosh clearly defined human resources as the capital (McCullosh 1870. р. 57). In addition, he pointed out the close
analogy between the common and human capital, considering
that investment in human resources should have turnover rates consistent with the turnover rate of other investments plus the normal rate of turnover determined bythe market interest rate
during possible life of an individual (McCullosh, 1870. р. 67). In
our view, it was an attempt to quantify the human capital.
Senior suggested that human resources can be treated as capital; nonetheless, in this capacity, he took skills and acquired abilities,
but not the person (Senior, 1939. р. 68-69). On occasion, however,
he treated human resources as capital with maintenance costs
invested in person with the expectation of receiving benefits in the future. He argued that there is a slight difference between
the arguments about the value of a slave and the values of a free man. The principal difference is that a free man sells himself for a certain period and for a certain relation, while the slave is sold on all his life.
Macleod considered the “producing” person as the fixed capital.
From his point of view if this person isn’t productive, he or she
The Marginalists adhere to the following considerations about the nature of human capital. Von Thunen noted the reluctance of some economists to assess human resources in money, this reluctance, he said, “… arises the lack of clarity and confusion of concepts in one of the important areas of the political economy. Moreover, it may seem that the freedom and dignity of the people could be successfully provided, if they were subject to the laws
of capital” (Thunen, 1875. р. 3). Von Thunen assumed that many
social institutes could be cancelled if expenses which increase labor productivity, were considered in the analytical scheme of the human capital. The capitalized value of these expenses, besides, has to be included as a part in the aggregated stock of the capital
(Thunen, 1875, р. 1-10).
Walras included all human resources in the capital. And the value
or the price of these human resources, Walras said, is defined like other capital goods (Walras, 1954. р. 40, 214-216). He argued
that the pure theory, “inherent in complete abstractionfrom the consideration of fairness and practicality,” and urged, “to consider human resources solely in terms of exchange value” (Walras,
1954. р. 271).
At the beginning of the XX century, the neoclassic Marshall admitted that estimates of the capitalized cost of the person can be useful, and considered them in an explicit formby the method of capitalization of net earnings (consumption subtracted from earnings before capitalization) he rejected this notion as “unrealistic” because human resources are not sold on the market
(Marshall, 1959. р. 469-470, 705-706).
The human resources were included in the definition of the capital by Fisher. Capital, as he claimed, is, “a useful intended material
object,” and, therefore, as human beings possess this characteristic, the sequence in reasoning demands their inclusion in the concept of
the capital (Fisher, 1897. р. 201-202; 1927. p. 51-52, 68). However,
the skill of an individual isn’t the capital, it is an additive to the individual. Fisher pointed that there is trained individual who is
to be included in the concept of capital (Fisher, 1965. р. 12-13).
According to Huebner, the human capital can have the same scientific interpretation as the usual capital has. Its operational definition can be received “by capitalization of human life cost
through bonds, giving them a life annuity (for this labor) and negotiability (as to a credit source), considering them by the principle of providing and using a method of depreciation fundsfor the implementation of the considered object, if only the person has prospect of future business activity, and his family has obligations to block the existing risk of uncertainty of duration of human life.”
(Huebner, 1914. p. 18-19).
Some authors used estimates of the capital cost of the person as
an assessment of losses in World War I (Guyot, 1914; Crammond,
1915; Bogart, 1919).“The person is the capital,” told Guyot, “and society have to be interested in the reduction of death not only on humanitarian, but also for the economic reasons.” (Guyot, 1914.
р. 1197). Bogart claimed that the assessment of the monetary cost
of the human lives lost in war is “method of doubtful statistical relevance,” nevertheless, he considered that only the monetary
assessment of these lives lost in war can help to realize their
enormous economic importance (Bogart, 1919. р. 269).
Boag considered a question of, whether it is correctly or not “to include in estimates of reduction of the capital, as costs of war,
losses of human lives (Boag, 1916. р. 7).” He drew a conclusion
that it is correct, as there is a close analogy between “material and human” the capital. Moreover, Boag has formulated some important issues relating to evaluation of the human capital. The
first issue stated that the method of assessment should depend on
the purposes for which the evaluation will be used. The second issue proposed that it is necessary to be careful in carrying out calculations for articles both for human, and for the usual capital. And, the third issue pointed that interference of costs of the usual and human capital should be taken into account.
Schutz substantiated the following thesis, “If education affects the production, which is important for the economy, therefore, it is a
form of capital” (Shultz, 1973. р. 50), and as “a form of capital
is education, it is called ‘human’ because it becomes part of the person, and the capital is due to the fact that the future is a source
of satisfaction or future earnings, or both together” (Shultz, 1979. р. 13). Becker examined this concept in a broad sense, “Human
capital is formed at the expense of investment in human, among which there are education, training in the workplace, health care costs, migration and search for information on prices and incomes”
(Becker, 1962. р. 14).
Ben-Porath defines human capital as the “fund, whose function
is a production of labor services in conventional units, and which in its quality is similar to any car as the representative of the
material capital” (Ben-Porath, 1967. р. 352). Dolan under the
human capital understands “the capital in the form of intelligence obtained through formal training or education, or through practical experience” (Dolan and Lindsey, 1992). Fischer, giving his
definition of this category, relates to capital’s ability to generate
income, as well as innate abilities, education and the acquired
qualification.
Currently, innovation is one of the mechanisms to ensure the
country’s economic growth. Theseinnovations lead to the renewal of markets, quality improvement and expansions of the range of goods and services, creation of new manufacture methods,
marketing, and management efficiency. Providing quality growth is possible under specific conditions which would enhance and strengthen the innovative component. The influence of innovation
on the development of national economies has become the impetus for the development of the developed countries of the complex of measures aimed at elaboration of innovation. Indeed, progress
in the field of innovation can only be achieved by a person, his
abilities, and opportunities.
As Eminov fairly marked in his study dedicated to the assessment of the innovative aspects of economic growth: “The providing of
quality growth is possible under specific conditions which would
enhance and strengthen the innovative component” (Eminov,
2012). The influence of innovation on the development of
of the developed countries of the complex of measures aimed at elaboration of innovation. In particular, Eminov noted: “Today countries have a task to improve the quality of economic growth, to become the countries that provide such growth not only due to primary industries and their exports but also due to the high technology factors, to form the economy of innovation type, and to make innovation a key factor in economic growth” (Eminov,
2012). The achievement of these goals is certainly not possible
without human development since the human being is a key factor in ensuring the innovative development of the country.
Thus, the purpose of the study is to model the relationship of indicators of human potential in the context of the innovative development of the country.
The identification of factors that have a significant impact on the
innovativedevelopment of the country is determined by the need to develop strategies encouraging innovation in the economy. As Shtertser noted in his study, dedicated to the detection of determinants of region’s innovation activitythat the innovative activity consists of three integrated successive stages (Shtertser,
2010):
• Invention - The development of new scientific and technical
ideas and solutions
• Innovation - Introduction of the inventionintoproduction and
on the market
• Diffusion - The spread of innovations in time and space.
Moreover, it should be noted that quantitative evaluation of volumes and effectiveness of innovative development is quite
difficult due to the limited statistical information at the regional
and country aspects. The main measure of innovation activity in the foreign economic literature is the number of patent applications, and for comparison, in some Russian studies the used indicator is the number of innovative enterprises. Thus, the selection of indicators as a measure of innovative activity is the choice of the researcher.
2. METHODS
In this study, we agree with the views of foreign researchers, because
patents to more accurately reflect the state of the research sector, as
the main source of new knowledge and innovation, than the number of active, innovative enterprises. Exactly the number of submitted
patent applications reflects the effectiveness of the active, innovative enterprises. Certainly, the innovative activity of enterprise has an
impact on the innovative development of the country and its regions and is predetermined by a vast number of factors.
Selection of factors that have aninfluence on the innovativedevelopment of the country was conducted with the help of regression analysis methods. As the basic model was chosen
a model with a fixed error, because the selection is not random,
and there is a possibility of having a strong correlation between the individual characteristics of the country and the regressors.
The regression equation was estimated for 41 countries of the
Asia-pacific region in the period 2008-2013 (246 observations). The
selection did not include North Korea, Nauru, Tuvalu, Marshall
Islands and Palau in the absence of data ofa number of indicators.
The information base for the study was the statistics from World Bank base.
As the dependent variable characterizing the innovative activity of the country in the real research was used the number of the submitted applications for patents from residents and nonresidents
calculated on 100 thousand population (Patent).
The following indicators were considered as the regressors:
• Gross indicator of coverage of the populationby the higher
education, in percentage (EDU_H). This indicator thatreflects
the level of education of the population is a characteristic of the human potential.
• Gross domestic product (GDP) per capita, on PPP in the
international dollars (GDPpc). This index reflects the
socio-economic development of the country.
• Public expenditure on education in the percentage of GDP
(EDU_GDP). The indicator reflects the socio-economic development of the country.
• Expenses on research and development, as a percentage of GDP (RgD). The indicator reflects the funding of research
and development.
• Imports of high-tech products as a percentage of imports
of goods (IMP_HT). The indicator characterizes the impact of foreign trade activities on innovation and technological development of the country.
• Engineers in research and development sector, on 1 million
people (TECH_RgD). The indicator reflects the quality of
human potential.
• Researchers in research and development sector, on 1 million
people (RES_RgD). The indicator reflects the quality of human
potential.
• The coefficient of demographic loading, a number of people
at the age of 0-14 and 65+ on 100 people at the age of
15-64 (TDR). This is an indicator of human potential for the characteristic of age structure of the population.
• The public and private expenditures on health care, as
a percentage of GDP (HEALTH_GDP). The indicator
characterizes the development of human development as every person needs different events directed to themaintenance of health.
• The expected life expectancy at the birth, years (LEB). The indicator characterizes human potential.
• Direct foreign investments, pure outflow, as a percentage of GDP (INV_OUT). The indicator reflects the investment
attractiveness of the country.
• The unemployment rate, as a percentage (U_EMPL). This is an indicator for the characteristic of human potential.
• Export of hi-tech goods, the percentage of industrial export
(EX_HT). The indicator characterizes the influence of foreign economic activity on theinnovative and technological development of the country.
• Direct foreign investments, pure inflow, as a percentage GDP
(INV_IN). The indicator reflects investment attractiveness of
the country.
Internet services, on 1 million people (IT_SERV). The indicator characterizes access for the person to information resources.
• Articles in scientific and technical journals, quantity (SAJ).
The indicator reflects the quality of human potential. • Internet users, on 100 people (IT_US). The indicator
characterizes access for the person to information resources.
As previously noted, the approbation of the regression model
is conducted according to the Asia-pacific region. Obviously,
there is a fairly high degree of differentiation both in terms of characterizing the socio-economic development and in terms of
innovation and technological development in the Asia-pacific region. In this study, it is supposed to divide Asia-pacific countries
into homogeneous groups on all indicators described above.
Based on the proposed set of indicators characterizing the level of innovation and technological development of the country, it is implemented a multi-dimensional grouping of countries in
the Asia-pacific region, which was conducted with the use of IBM SPSS Statistics package for hierarchical scheme by Ward’s
method, the criterion of association, which is the metric of the city (city-block [Manhattan] distances).
As a result of the cluster analysis, the Asia-pacific countries will
be divided into homogeneous groups according to the level of innovation development. In this regard, it seems appropriate the introduction to model a dummy variable, which will take into
account the specificities of each country. We will present the specification of countries (countries belonging to a particular
cluster) by binary attributes (Figure 1).
Taking into the consideration the information above, the basic regression model has the form (Formula 1):
Patenti= α + β1+ EDU_H + β2+GDPpc + β3+EDU_GDP +
β4+RgD + β5+ IMP_HT + β6+ TECH_RgD + β7+ RES_RgD +
β8− TDR + β9+ HEALTH_GDP + β10+ LEB + β11− INV_OUT +
β12− U_EMPL + β13+ EX_HT + β14+ INV_IN + β15+ IT_SERV +
β16+ SAJ + β17+ IT_US + µ1Cl_A + µ2Cl_B + µ3Cl_C + ξi (1)
Where α, β, µ - The parameters of the equation; ξi - Residue; symbols with the variables indicate the direction of the relation.
3. RESULTS
On the basis of earlier offered set of indicators of innovative development, the multi-dimensional group of Asia-pacific
countries for 2008-2013 was released. The results are presented
in Table 1.
In 2013 cluster A included 12 Asian-pacific countries (29% of the
total). The main characteristic of the countries that are included in this cluster is a low level of innovative development. This is evidenced by the low number of submitted applications for patents
on average for 100 thousand populations, a number of articles in scientific magazines, and also and also the low number of engineers
and researchers in research and development sector (mainly due to
Chile, India and South Africa). As for the indicators characterizing
human development, in this group of the countries it is possible to note average values in comparison with other clusters of indicators
of GDP per capita, the gross coverage of the population with higher education (the average for the group is about 38%), life expectancy at birth an average of 72.7 years in the group.
During 2008-2013, the structure of cluster A had qualitative changes: According to the results of 2008 the group consisted of
16 countries; for the considered period, the Russian Federation, Vietnam and Brazil, having improved their ratings on the part of indicators that characterizes the innovative development, moved to
the group of counties of cluster B. Herewith, the negative tendency
of decrease of innovation activity indicators was noted in Brunei Darussalam (the number of the submitted applications for patents
for the considered period decreased from 19.7 to 2.6 units [on
The belonging to a cluster
Cluster А
Cluster В
Cluster С
Cluster D
The binary variables
Cluster А Cluster В Cluster С
1 0 0
0 1 0
0 0 1
0 0 0
Figure 1: Replacing the qualitative parameters of the regression model by binary attributes
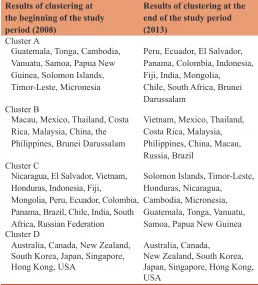
Table 1: The grouping of Asia-pacific countries by results
of a clustering in 2008 and 2013
Results of clustering at the beginning of the study period (2008)
Results of clustering at the end of the study period (2013)
Cluster А
Guatemala, Tonga, Cambodia, Vanuatu, Samoa, Papua New
Guinea, Solomon Islands, Timor-Leste, Micronesia
Peru, Ecuador, El Salvador, Panama, Colombia, Indonesia,
Fiji, India, Mongolia,
Chile, South Africa, Brunei
Darussalam
Cluster В
Macau, Mexico, Thailand, Costa Rica, Malaysia, China, the Philippines, Brunei Darussalam
Vietnam, Mexico, Thailand,
Costa Rica, Malaysia, Philippines, China, Macau,
Russia, Brazil
Cluster С
Nicaragua, El Salvador, Vietnam,
Honduras, Indonesia, Fiji,
Mongolia, Peru, Ecuador, Colombia, Panama, Brazil, Chile, India, South
Africa, Russian Federation
Solomon Islands, Timor-Leste,
Honduras, Nicaragua, Cambodia, Micronesia,
Guatemala, Tonga, Vanuatu,
Samoa, Papua New Guinea Cluster D
Australia, Canada, New Zealand,
South Korea, Japan, Singapore,
Hong Kong, USA
Australia, Canada,
New Zealand, South Korea, Japan, Singapore, Hong Kong,
USA
100 thousand population]), and also, the reduction was observed
in terms of publication activity.
According to the end of 2013, the cluster B included ten countries of Asia-pacific countries (24% of the total). The countries of this
group hold “middle” position comparing with the countries of other clusters. The countries of cluster B have ones of the highest
values of GDP per capita and on average it has 27843 in PPP in international dollars. In 2013 in countries of this group, there
was a high proportion of high-tech import, and it was on average
16.5% of the import of all goods (mainly due to the Philippines, Malaysia, and China). Herewith, and a high proportion of high-tech export was observed, and it was on average 24.5% of manufactured export, mainly due to the Philippines. As for indicators of human development, average life expectancy at the birth made 75 years,
for support of education and health care were allocated on average
on 4, 6 and 5, 7% of GDP, respectively. In cluster B, the average coverage of higher education was about 44%.
According to the end of 2013, the cluster C included 11 countries of Asia-pacific countries (26,8% of the total). The countries of this cluster are significantly different from all other clusters in the
level of innovation development, as well as human development indicators. In this group, the lowest indicators of innovative activity of the population are noted (the number of the submitted
patent applications was on average 0.747 on 100 thousand people of the population; the number of publications is in scientific
magazines was also at the lowest level in comparison with other clusters). This group has the lowest coverage of the population
by the higher education (on the average 13.7%), and the lowest
number of researchers and engineers in research and development
sector. In the countries of the cluster C, there is the highest unemployment rate (on the average - 10.5%) relative to other clusters as well as the lowest rate of GDP per capita - 4084.9 PPP
in international dollars. For the considered period the structure of a cluster increased. Two more countries could have joined
the cluster - Nicaragua and Honduras, that, compared with other
countries have failed to achieve the necessary to move to more prosperous cluster growth rates of certain parameters describing the level of innovation and the development of human potential.
In 2013, cluster D included eight countries of Asia-pacific countries (19.5% of the total). This cluster is formed by the
leading countriesin terms of innovative development and human development. In the countries of this group the indicator of average
GDP per capita amounted to 48,054.53 in PPP in international
dollars, and this indicates a relatively high level of socio-economic development of countries. Indicators of human development also
are in the countries of this cluster at the high level: Coverage of the
population with higher education on the average over the countries
of the group was 68%; on average on 100 thousand people of the population fall 819 and 4945.7 engineers and researchers
in research and development sector, respectively. A number of
publications in scientific journals at the end of 2013 amounted
to an average of 43,233.6. In the countries of this group, it was
on average 192 of 100 thousand people of the population of
the submitted patents. All this certainly shows the high rates of innovation activity in the countries that are included in this cluster, as well as high rates of human development. For the considered period the structure of this cluster didn’t change.
The results of a clustering show thegreat extent of differentiation
of Asia-pacific countries as on the level of innovative development,
and the level of human development. It is caused by a number of factors: Geographical position of the countries, climatic conditions, development of economy and labor market, demographic and social characteristics. In the context of innovations and opportunities of the person for therealization of the innovative ideas the USA, Japan, South Korea and other countries of a cluster of D are the most attractive.
Based on the above information, the regression model that describes the reciprocity of the factors that determines the innovative development in the context of human developmentwas constructed. As a result, the correlation analysis revealed the strongly correlated factors. The presence of a linear relationship between the independent factors in the regression model leads to one of the major obstacles to the effective application of multiple regression analysis - Multicollinearity. To eliminate multicollinearity effect and to reduce the dimension of the baseline the factorial analysis by method main a component in the program
SPSS was implemented in this study (Table 2).
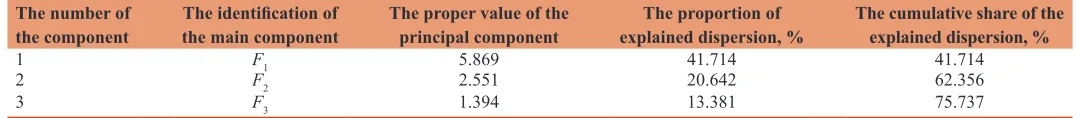
Table 2 shows that own values of the first three principal components exceed a value of one so that they are retained
for further analysis. Herewith, they explain 75.737% of the
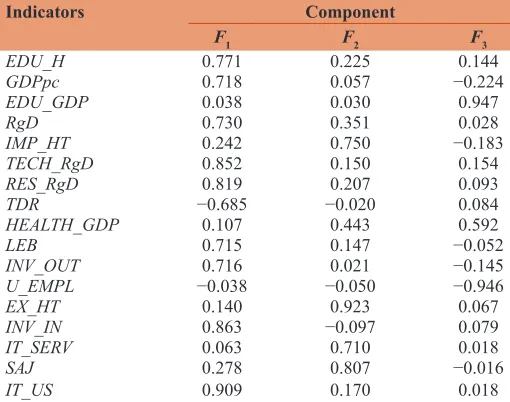
dispersion of initial signs. To determine the composition of the main components, and also to identify the correlation factors and principal components we construct a matrix of factor loadings. The sign of the factor loadings determines the direction of the connection (Table 3).
Table 3 shows that the first principal component includes indicators that reflect the level of human development: Gross indicator of coverage of the population the higher education; GDP per capita;
costs of research and development; engineers in research and development sector; researchers in research and development sector;
coefficient of demographic load of working-age population; the expected life expectancy at the birth; direct foreign investments (pure
outflow); direct foreign investments (pure inflow); Internet users.
Table 2: The value of the principal components and a share of the explained dispersion of signs
The number of
the component the main componentThe identification of The proper value of the principal component explained dispersion, %The proportion of The cumulative share of the explained dispersion, %
1 F1 5.869 41.714 41.714
2 F2 2.551 20.642 62.356
3 F3 1.394 13.381 75.737
Conventionally, the first component (F1) may be called a “human
factor:” GDP per capita reflects the level of material well-being,
the gross coverage with higher education - literacy level, life
expectancy at birth - the level of social well-being. Herewith,
it should also be noted that these figures are included in the
integral index - Human Development Index, according to the
UN methodology. The structure of this indicator also includes indicators characterizing the number of specialists in research
and development sector. The coefficient of demographic loading
reflects the level of aging of the population, and also apopulation
in working-age with the saved-up potential level. Direct foreign investments also play a special role in the formation of human opportunities because purposeful capital investments to various spheres and branches promote theimprovement of thewelfare of
the population. The vast majority of indicators related to the first
principal component of the direct correlation, i.e., at theincrease in values of these indicators, according to calculations, a component changes the value towards increase, except for coefficient of demographic loading that tells about thedecrease in value components with a growth of this indicator. The proportion of the
variation of the first principal component was 41.714%.
The composition of the second principal component (F2), the
proportion of the variation which was 20.642%, includes indicators
characterizing the innovative development of the country, so let’s call it “Innovation potential factor:” Import of high-tech goods; export of high-tech goods; information and communication services; the protected Internet servers in calculation on 1 million
people of the population; articles in scientific and technical
journals. Indicators included in the second principal component has a direct correlation, indicating the increase in F2 with thegrowth of the factors causing it.
The structure of the third principal component (F3) includes: Public
spending on education, total health expenditure, unemployment rate. The share of F3 variation was 13.381%. Indicators of the
third principal component, for the most part, can be described as factors that contribute to (obstructive) the development of
capacities (potency) of a person, which certainly have a positive
effect on the level of innovation development. Public expenditure
on education and health care costs have a positive correlation with the component; unemployment rate - negative. At the same time, measures to reduce unemployment and reduce tensions on the labor market, carried out by the state in a given country, of course, affect the rate of economic growth, which will lead to improving the level and quality of life in the country and, sure, will have favorable effect on the development of human capabilities and innovative thinking. All of the above will have
a significant impact on the long-term and the level of innovation
development of the country.
Thus, the study identified three common factors: The “human
factor,” which characterizes the well-being of people (population) and the realization of its potential; “factor of innovative potential,” which describes the results of innovation activity in the country; “factor of human capabilities realization” describes the potential
for personal fulfillment, as well as potential threats, hindering
prosperous human development. It should be noted that the largest proportion of variation goes to the factor of human potential that tells about a bigger contribution of this component in the generalvariation of signs. This once again proves the fact that only the human factor can provide long-term sustainable innovation and technological development of any country.
Furthermore, the designation of the relationship between the development of innovative and derived factorsis considered appropriate in this study (Table 4). As it was mentioned earlier, as a productive indicator was chosen the following indicator: The number of the submitted applications for patents from residents
and nonresidents calculated on 100 thousand population (Patent).
As it can be seen from the Table 4, the relationship between the resulting index and the factors is direct, and the factor of human potential has the greatest impact on a number of the submitted
applications for patents (the coefficient of correlation was 0.563).
The factors are not correlated among themselves.
We will construct a regression model of thedependence of a productive indicator from the allocated factors (Formula 2). The
regression model included the fictitious variables allowing to
consider country belonging to a certain cluster.
y=144.4+12.6F1+8.8F2+2.0F3−112.5Cl_A−111.8Cl_B−92.1Cl_C (2)
We will present confidential intervals of estimates of parameters
of the regression equation (Table 5).
Table 3: The matrix of factorial loadings main components
Indicators Component
F1 F2 F3
EDU_H 0.771 0.225 0.144
GDPpc 0.718 0.057 −0.224
EDU_GDP 0.038 0.030 0.947
RgD 0.730 0.351 0.028
IMP_HT 0.242 0.750 −0.183
TECH_RgD 0.852 0.150 0.154
RES_RgD 0.819 0.207 0.093
TDR −0.685 −0.020 0.084
HEALTH_GDP 0.107 0.443 0.592
LEB 0.715 0.147 −0.052
INV_OUT 0.716 0.021 −0.145
U_EMPL −0.038 −0.050 −0.946
EX_HT 0.140 0.923 0.067
INV_IN 0.863 −0.097 0.079
IT_SERV 0.063 0.710 0.018
SAJ 0.278 0.807 −0.016
IT_US 0.909 0.170 0.018
Source: Calculated by the authors
Table 4: Matrix of pair coefficients of correlation between
an integrated indicator of intensity and factors
Factors Patent F1 F2 F3
Patent 1.000 0.563 0.366 0.207
F1 0.563 1.000 0.000 0.000
F2 0.366 0.000 1.000 0.000
F3 0.207 0.000 0.000 1.000
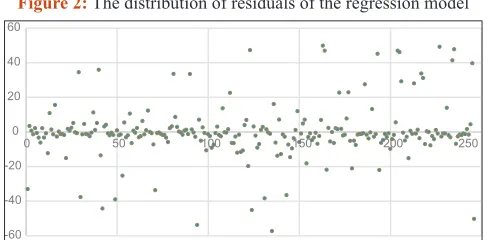
All parameters of the regression equation are significant at the 1% level of significance. Therefore, the model is adequate to the
original data. Fischer’s F-criterion also showed the statistical
importance of coefficient of determination (R2 = 0.716) at 1% level. The distribution of residuals indicates on the absence of heteroscedasticity in Figure 2.
In general, the regression model is considered to be an adequate
source data as the coefficient of determination took value is not <50%. Thus, in 71.6% of cases, the change of the considered factors leads to
achangeina number of patent applications in the country. All factors entered regression model with the signs which do not contradict
reality. The constant α = 144.4 gives the predicted value of a dependent
variable at the value of all factorial signs entering this model.
It should be noted that dependence of number of the submitted applications for patents from factors for the countries of each cluster will be described by the following equations:
For the countries of cluster A: y=144.4+12.6F1+8.8F2+2.0F3−1
12.5Cl_A
For the countries of cluster B: y=144.4+12.6F1+8.8F2+2.0F3−1
11.8Cl_B
For the countries of cluster C: y=144.4+12.6F1+8.8F2+2.0F3−9
2.1Cl_C
For the countries of cluster D: y=144.4+12.6F1+8.8F2+2.0F3
Further, we will give avisualization of results of research. In Figure 3 the empirical and simulated values of a number of the submitted applications for patents are given in the countries of a
cluster A according to the results of 2013.
From Figures 3-6 it is visible that the model is adequate to the initial data, and the main tendency doesn’t contradict reality. In addition, relative deviations of the simulated values of a productiveindicator from empirical data are presented on the graphs. The constructed model can be also used for the prediction of key indicators and
identification of the main tendency of a productiveindicator.
4. CONCLUSIONS
Thus, during research, the empirical model of theinterrelation of innovative development from various factors was constructed.
Table 5: Confidential intervals for estimates of parameters
of the regression equation
Variables Values of the
parameters Lower boundConfidence intervalUpper bound
Constant 144.4 129.1 169.7
F1 12.6 7.3 17.9
F2 8.8 4.2 13.4
F3 2.0 0.9 5.6
Cl_A −112.5 −142.9 −108.6
Cl_B −111.8 −140.1 −107.2
Cl_C −92.1 −120.4 −81.6 -60
-40 -20 0 20 40 60
0 50 100 150 200 250
Figure 2: The distribution of residuals of the regression model
Figure 3: Number of the submitted applications for patents in the
countries of a cluster A at the end of 2013
Figure 4: Number of the submitted applications for patents in the
countries of a cluster B at the end of 2013
Figure 6: Number of the submitted applications for patents in the
countries of a cluster D at the end of 2013
Figure 5: Number of the submitted applications for patents in the
Indicators, their qualitative characteristics, the direction of communication are described, the basic model of assessment is offered. For the accounting of a factor of differentiation of
the countries on a number of the indicators reflecting economic
and innovative development, the clustering of the countries is carried out, and homogeneous groups are formed. Ultimately, the authors built a regression model that allows assessing the
factors that influence innovation and technological development
of the country. To eliminate the effect of multicollinearity, as well as to reduce the dimension of the initial indicators he factorial analysis by method main a component is realized in this research. Furthermore, the three major components were distinguished and their structure determined. Thus, the real
research allowed to define quantitatively and qualitatively influence of a human factor in theinnovative development of the countries of the Asia-pacific region taking into account their specific features.
5. ACKNOWLEDGMENT
The results of this research were achieved within the frameworks of the governmental assignmentof Russian Ministryof Education and
Science in the sphere of scientific research during the researching assignment No. 26.1478.2014/K “The structural transformation
of Russian Economy through the integration installation in the
industrial markets of Asia-pacific Region.”
REFERENCES
Becker, G.S. (1962), Investment in human capital: A theoretical analysis.
Journal of Political Economy, 70(5), 9-49.
Ben-Porath, Y. (1967), The production of human capital and the life cycle of earnings. The Journal of Political Economy, 75(4), 352-365. Boag, H. (1916), Human capital and the cost of war. Royal Statistical
Society, 79, 7-17.
Bogart, E.L. (1919), Direct and Indirect Costs of the Great World War. New York: Oxford University Press.
Crammond, E. (1915), The Cost of War. J.Royal Statis. Soc., LXXVIII,
99-361.
Dolan, E.G., Lindsey, D.E. (1992), Microeconomics. Saint-Petersburg: Copyright Publishing.
Eminov, N.O. (2012), The innovative aspect of the economic growth of the Republic of Azerbaijan. Creative Economy, 4(64), 119-124. Fisher, I. (1897), Senses of capital. Economic Journal, VII, 199-213. Fisher, I. (1965), The Theory of Interest. New York: Augustus M. Kelley.
Guyot, I.M. (1914), The waste of war and the trade of tomorrow.
Nineteenth Century and After, LXXVI, 1193-1206.
Huebner, S.S. (1914), The Human Value in Business Compared with the Property Value. Proceeding Thirty-Fifth Ann. Convention Nat.
Assoc. Life Underwriters.
Macleod, H. D. (1881), The Elements of Economics. Vol. 11. New York: D. Appleton@Co.
Marshall, A. (1959), Principles of Economics. New York: Macmillan Co. McCullosh, J.R. (1870), The Principles of Political Economy. Alex
Murrey @ Son.
Senior, N.W. (1939), An Outline of the Science of Political Economy. New York: Farrar @ Rincart.
Shtertser, T.A. (2010), Determinants of innovative activity at the
regional level (empirical analysis). The Statistical Measurement and
Econometric Analysis. Available from: http://www.nsu.ru/exp/ref/ Media:4ef1a2788846c8c01300028210_Shterzher.pdf.
Shultz, D. (1979), Scientific Productivity. The Effectiveness of Research Groups in Six Countries. Cambridge: Cambridge University Press. Shultz, D. (1973), The Coming of Post-Industrial Society. New York:
Basic Books.
The International Monetary Fund (IMF). Available from: https://www.
imf.org.
The Official Site of Federal State Statistics Service of the Russian. Available from: http://www.gks.ru.
The Official Website of the World Bank. Available from: http://www.
worldbank.org.
The United Nations Statistics Division (UNSD). Available from: http:// www.comtrade.un.org/db/.
Thunen, Н.I. (1875), Der isolierte Stadt. Vol. 11. Part 11. Translated by Hoselitz, B.F. Chicago: Corporative Education Center, University of Chicago.