How do we Tweet? The
Comparative Analysis of
Twitter Usage by Message
Types, Devices, and
Sources
Youngsub Han, Beomseok Hong,
Hyeoncheol Lee, & Kwangmi Kim
Abstract
Facing the growing importance of social media in the mar-keting field, this study is intended to build a better under-standing of Twitter usage. A total of 73,192 tweets were examined by message types, devices and platforms used. Instead of relying on the audience’s response (e.g., survey or experiment) or traditional content analysis, this study used a data-mining approach and software that are widely used in the computer science field. Overall findings
indi-Youngsub Han and Beomseok Hong are Doctoral Candidates at the Department of Computer and Information Sciences, Towson University. Hyeoncheol Lee is with SEMES Co. Ltd. And Dr. Kwangmi Kim is a Professor at Towson University’s Department of Mass Communication and Communication Studies.
cate that individual users prefer mobile devices to desk-tops and use more official web pages or mobile applications provided by Twitter when they tweet, and their most popular message type was the Singleton, an undirected message with no specific recipient. However, we also found that tweets generated through business sources were dif-ferent from those through official sources in terms of mes-sage type, devices, and the nature. The implications of these findings were discussed.
I
n recent years, we have witnessed a phenomenalmessages by either ignoring or becoming attentive (Boyd & Ellison, 2007; Campbell, Pitt, Parent, & Berthon, 2011; Chu & Kim, 2011). However, technology and the Internet have revolutionized this traditional communication pat-tern and have transformed it into a more interactive proc-ess. Thus, consumers are more connected, informed, and empowered in this social media age.
Various industries, including the media and adver-tising industries, have made significant efforts to adapt to such swift changes and have paid attention to building competitive advantages using social media in the market-place. Social media have become an important marketing venue for marketers, allowing them to reach a wide range of target audiences efficiently. Therefore, it is typical to see icons of Facebook and Twitter on many businesses’ websites and advertising messages. Simultaneously, the same social media sites create serious challenges for the marketing world, since consumers are further fragmented by various media platforms and they can jeopardize brand equity and brand images by sharing their unpleasant or dissatisfied experiences with others through social media (Kaplan & Haenlein, 2010). Therefore, it became impera-tive for marketing and advertising professionals to better understand the complex behaviors and minds of consum-ers: Why do consumers choose to use Twitter, how do they use it, and what interactions do they have with other us-ers? This study is intended to address these topics to build a better understanding of Twitter usage.
un-derstanding of Twitter usage in order to detect any pat-terns that consumers might show.
The Audience’s Media Use in the Media Convergence and Social Media Era
The Concept of Active Audience and Uses and Gratifications
As an influential theory in media research, the uses and gratification (U&G) perspective assumes that differ-ent people can use the same medium for differdiffer-ent pur-poses. The theory holds that multiple forms of media com-pete for users’ attention and audiences select the medium that meets their needs, such as the desire for information, emotional connection, or status (Baran & Davis, 2011; Tan, 1985). At the core of this theory is the concept of an active audience, which assumes that the audience’s com-munication behavior is goal-oriented and purposeful in that people choose certain media based on their needs, wants, or expectations.
ar-gues that individuals use online media at three different stages/levels for their own needs: (1) consuming content for information, entertainment, and mood management needs; (2) participating through interacting with the con-tent, as well as with other users, for social connections; and (3) producing their own content for self-expression and self-actualization. In other words, online users have vary-ing degrees of engagement with social media, rangvary-ing from simple and passive (e.g., simply consuming the content by reading) to active (e.g., producing and posting the content).
What Shao (2009) indicates in his study has rele-vant implications for the analysis of the different message types that people tweet. The first level — consuming con-tent for information, entertainment, or mood management needs — indicates a simple, passive reading behavior of users. On the other hand, the second and the third levels involve more active roles of users from tweeting their own thoughts, emotions, and information to retweeting others’ messages and further to replying to certain messages for a higher level of engagement and social interactions. Based on this implication, one of this study’s objectives is to iden-tify dominant or popular types of tweets that people use.
Social Media and Marketing
commercials contest for the Super Bowl games. Doritos was able to engage the consumers and increase the con-sumer loyalties (Schultz, 2016). Due to the importance of social media in marketing, particularly in relationship marketing, consumers as well as marketers acknowledged that social media should be part of overall brand commu-nications. In 2009, 16% of the Fortune 500 companies had corporate blogs that link to a variety of social media chan-nels, including podcasts, RSS feeds, and Twitter (Barnes & Mattson, 2009). In 2013, 86% of marketers believe social media is an important channel for their marketing initia-tives (Stelzner, 2013). Also, about 93% of consumers indi-cated that a company should have a presence in social me-dia while 85% indicated that a company should seek active interactions with customers through these platforms (Cone Business, 2008). Such recognition of the importance of so-cial media as a marketing tool was reflected in their in-creased social media spend. Total spending on social media advertising has increased by 56.2% from $11.36 billion in 2013 to $17.74 billion in 2014 (eMarketer, 2015).
FGAs were referenced to the major features, such as the song used in the ads. Another study in a similar topic ex-amined the effects of FGC in social media and found that FGC not only enhance the transaction and relationship sides of customer-firm interactions but also play a role in increasing profitability (Kumar et al., 2016). These re-searchers also found that FGC became more effective when used simultaneously with other communication channels, such as TV and email. These studies guided an-other research question for this study and led us to exam-ine the sources of tweets, whether they were generated by individual personal consumers (similar to the concept of user-generated content or consumer-generated ads) or by commercial business-oriented sources (similar to the con-cept of firm-generated ads or content). As Twitter becomes a more vital marketing tool, many companies and websites have recently provided Twitter-based advertising services and business solutions. Those companies, such as Unfol-lowers, TweetDeck and TweetAdder, tend to generate tweets automatically to enhance certain brands’ perform-ances in the marketplace. Considering this growing trend in the Twitter industry, we also would like to see how strong these activities are.
Twitter are just posting their thoughts and emotions or actually interacting with other people. Desire to maintain social interaction has been identified as one of major moti-vations for media consumption (Joinson, 2008; Papacha-rissi & Rubin, 2000). At the same time, literature on Twit-ter use reports that the inTwit-teractivity among TwitTwit-ter users tend to be lower than expected (Wohn & Na, 2011). There-fore, the following research questions have been addressed in this study:
RQ1: What types of messages are mostly exchanged on Twitter? How engaged are people through Twit-ter conversation?
RQ2: How do Twitter users post tweets? What kinds of devices and platforms do they prefer us-ing?
RQ3: How pervasive are tweets from business/ profit-oriented sources in the Twitter world, com-pared to those from individual consumers? How dif-ferent are these tweets in terms of devices and mes-sage types?
Methods
Instead of using a traditional content analysis, this study used data-mining techniques to collect and compre-hend massive amounts of tweets exchanged, such as the frequency and amount of traffic generated, types of tweets, the devices used to post tweets, and the nature of tweets exchanged for a certain brand or commercial.
research-ers to handle a huge amount of data and discover knowl-edge and information from them (Byun, Lee, & Kim, 2012; King, Li, & Chan, 2009; Lee, Han, Kim, & Kim, 2014). As the amount of tweets exchanged in cyberspace is enor-mous, it is not possible to retrieve, filter, analyze, and visualize them without automated-tools and well-defined approaches. For this reason, all tweets exchanged in the study period and user profiles were collected through an automated Twitter data collecting tool, which was devel-oped from previous studies (Byun et al., 2012; Lee et al., 2014).
first attempt at converging social media and television broadcasting that successfully drew viewers’ interests. During the 2014 Super Bowl game, some marketers such as Pepsi, Samsung, and Oreo, formed a “mission control” center or a “war room” at their companies to monitor Twit-ter messages and to inTwit-teract with their audiences
(Learnonth, 2013). All of these suggest that the Super Bowl is a relevant venue to draw tweet messages for the analysis.
The study period was the three weeks surrounding the Super Bowl game in 2012, 2013, and 2014: one week before and two weeks after the Super Bowl (Jan. 29, 2012 to Feb. 19, 2012; Jan. 27, 2013 to Feb. 17, 2013; Jan. 26, 2014 to Feb. 16, 2014). This study period was chosen to include all tweets related to the topic since marketers re-leased their ads on social media sites like YouTube prior to the actual broadcast of the game in hopes of creating more buzz, and Twitter traffic is typically higher than average for a few weeks after the game, as the lingering impact of the advertising continues (Adobe Digital Index, 2014).
Light,” “Epic Night,” “Jeep,” “Restlessness,” “Hyundai,” “Sixth sense,” “H&M,” “David Beckham,” and “NFL” were used. The unit of analysis was every single tweet identi-fied by the aforementioned search terms within the study period. Overall, we retrieved 73,192 tweets (35,187 in 2012, 34,350 in 2013, and 3,655 in 2014) related to the Su-per Bowl commercials.
higher percentages of a Retweet or Singleton indicate a lower-level exchange.
Twitter provides the name of the platform which contains specific uniform resource locator (URL) informa-tion, showing how each tweet was posted. Three graduate students analyzed all URLs used to tweet and found that about 99.8% of all tweets were generated from 600 URLs. These identified 600 URLs were used for source analysis, and their examples are listed in Table 1.
To address the second research question, each tweet was coded by the medium used to post: mobile and desktop. Here, a tablet was included as mobile. Then, a mobile device is further classified into three categories since Twitter users have three options to tweet from their mobile devices: as Twitter official sources (Twitter mobile applications and Twitter official mobile web site), business sources (business and profit-oriented sources), and
miscel-laneous (other mobile applications, 3rd party web site, or
unknown sources). In the same way, the tweets posted through the desktop computer were further classified into three categories: as Twitter official sources (Twitter official Table 1
Example of URL sources and tweet counts
Source URL Tweet count
Twitter for iPhone http://twitter.com/download/iphone 569,018 Twitter for Android http://twitter.com/download/android 352,537 Twitter Official Web http://twitter.com 311,690 Twitter for
desktop web site), business sources (business and profit oriented sources), and miscellaneous (other mobile
applica-tions, 3rd party web site, or unknown sources). Table 2
summarizes the categories used to analyze the device and platform preference in posting tweets. Here, a business source means a website domain that is owned by private companies to provide Twitter-related advertising business or Twitter analysis services. These business sources are profit-oriented sites that support marketing efforts for various companies and organizations by contracts. Table 3 shows profiles of the Top 10 official and Top 10 business sources.
Results
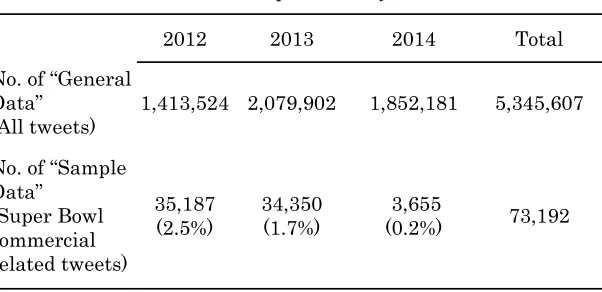
A total of 1,413,524 tweets in 2012, 2,079,902 tweets in 2013 and 1,852,181 in 2014 were retrieved dur-ing the study period. Out of these (“General Data” of 5,345,607 tweets), a total of 73,192 Super Bowl related tweets (called “Sample Data”) were analyzed (i.e., a total of
Table 2
Categories of Tweet Sources for Coding
Device Source Example
Mobile
Twitter Official - Twitter for iPhone, - Twitter for iPad - mobile.twitter.com Business - TwitRocker2
- Tweetro+ Miscellaneous - Instagram
Desktop
35,187 tweets in 2012, 34,350 in 2013, and 3,655 in 2014). Over these three years, the total number of Super Bowl related tweets was the lowest in 2014, and the portion of Super Bowl commercial related tweets out of total tweets significantly decreased to 0.2% in 2014, compared to 2.5% in 2012 and 1.7% in 2013. It seems that there were fewer messages and conversations on Twitter about Super Bowl commercials in 2014, compared to the two previous years (See Table 4).
The first research question asked what types of messages were mostly exchanged on Twitter. Over the past three years from 2012 to 2014, a Singleton is the most popular message type (accounting for 37-42%), but all three types show relatively similar portions. The year of 2014 had a lower portion of Reply (accounting for 17.8%), Table 3
Profiles of the Top 10 Official Sources
Name URL Type
Twitter for iPhone http://twitter.com/download/ Mobile Twitter for Android http://twitter.com/download/ Mobile Twitter Official Web http://twitter.com Company Twitter for BlackBerry http://blackberry.com/twitter Mobile Twitter for iPad http://twitter.com/#!/download/ Mobile Twitter for Android https://twitter.com/download/ Mobile Tweet Button http://twitter.com/tweetbutton Applica-tion Mobile Web (M2) https://mobile.twitter.com Mobile Twitter for Windows
Phone http://www.twitter.com Mobile
Table 5
Type of Messages by Year (2012-2014) in “General Data”
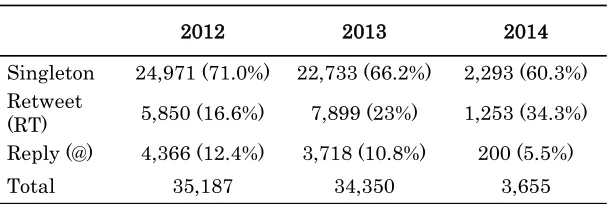
compared to the two previous years (32.2% in 2012 and 28.3% in 2013) (See Table 5). However, when we examined the tweets related to Super Bowl commercials, we see a much wider differences among the three different message types. Singleton messages accounted for a larger portion (about 60%-72%), followed by Retweet (17%- 35%), and Re-ply (6%-13%).
Even if each year showed a different portion of each message type, the overall pattern was consistent. The per-centages of Retweet consistently increased from 2012 to 2014, while the portion of Reply tweets has significantly Table 4
Data “General Data” and “Sample Data” by Year (2012-2014)
2012 2013 2014 Total
No. of “General Data”
(All tweets) 1,413,524 2,079,902 1,852,181 5,345,607 No. of “Sample
Data” (Super Bowl commercial related tweets)
35,187
(2.5%) 34,350 (1.7%) (0.2%) 3,655 73,192
2012 2013 2014
Singleton 534,990 (37.8%) 763,470 (36.7%) 778,726 (42%) Retweet
(RT) 423,138 (29.9%) 727,717 (35%) 743,926 (40.2%) Reply (@) 455,396 (32.2%) 588,715 (28.3%) 329,529 (17.8%)
decreased. In 2012 and 2013, Reply tweets accounted for 12.4% and 10.8% of all tweets, respectively (See Table 6). However, it was drastically decreased to 5.5% in 2014.
These differences were statistically significant (χ2=766.01,
df = 4, p <.0001). This finding suggests that people used three different types of messages almost evenly as they tweeted general messages, but when they tweeted about Super Bowl commercials, they mostly used a Singleton type by posting undirected messages without much inter-actions with other users.
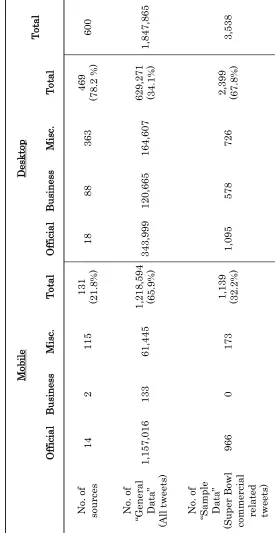
The second research question intended to find tweeting methods, how users post tweets and the device/ platform that they use. As Table 7 shows, Twitter users preferred mobile devices (1,218,594 tweets, 65.9%) to desk-top computers (629,160 tweets, 34.1%) as they tweeted general messages. Even if there are more sources for Twit-ter posting on desktop compuTwit-ters (469 sources, 78.2%) than in mobile devices (131 sources, 21.8%), two thirds of
all tweets weregenerated via mobile devices. This means
that the majority of people prefer the mobile device to post general tweets. When we examined the Super Bowl re-lated tweets (i.e., “Sample Data”), however, we found a
dif-2012 2013 2014
Singleton 24,971 (71.0%) 22,733 (66.2%) 2,293 (60.3%) Retweet
(RT) 5,850 (16.6%) 7,899 (23%) 1,253 (34.3%) Reply (@) 4,366 (12.4%) 3,718 (10.8%) 200 (5.5%)
Total 35,187 34,350 3,655
Table 6
ferent pattern. A desktop was used for posting 67.8% of Super Bowl related tweets (2,399 tweets) while a mobile device was for posting 32.2% of Super Bowl tweets (1,139 tweets). This was an unexpected finding, but as we exam-ined this data with the sources, this unexpected finding was understood. It might be due to the fact that 85% of tweets posted through mobile devices came from official sources (966 tweets out of 1,139 tweets), while none of tweets came from business sources. On the other hand, only 46% of tweets posted through desktop devices came from official sources (1,095 tweets out of 2,399 tweets) and the remaining portion of tweets through desktop devices (54%, 1,304 tweets out of 2,399) was from business profit-oriented sources or miscellaneous sources. Also, all Super Bowl related tweets generated from business sources were posted through desktop devices (all 578 tweets). In other words, all business profit-oriented sources pushed Super Bowl related tweets through desktop devices, which might have contributed to a higher number of desktop device data. This complicated data was further analyzed and dis-cussed in a later section.
plications or web pages where Twitter functionalities are integrated, the majority of people prefer to post tweets through the Twitter official sources.
Also, among all identified 90 business sources, 88 URLs and 99.9% of general tweets (120,665 tweet out of 120,798 tweets) came through desktop business sources, and only 133 tweets (0.1%) were generated through mobile business sources (see Table 7). This means that most of business and marketing promotional tweets were gener-ated through desktop devices.
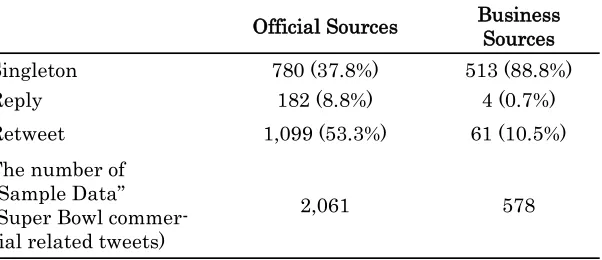
To examine whether the nature and message types of Super Bowl related tweets were different between offi-cial Twitter sources and business sources, the three mes-sage types were further examined by the sources that each message was produced from. Out of all 2,061 tweets gen-erated through Twitter official sources, more than half of these tweets were Retweet (53.3%) and Reply (8.8%), while 37.8% of them were Singleton. On the other hand, among 578 tweets generated through business sources, 88.8% of them were Singleton only with small portions of Retweet Official Sources Business Sources
Singleton 780 (37.8%) 513 (88.8%)
Reply 182 (8.8%) 4 (0.7%)
Retweet 1,099 (53.3%) 61 (10.5%)
The number of “Sample Data” (Super Bowl commer-cial related tweets)
2,061 578
Table 8
(10.5%) and Reply (0.7%) (See Table 8). This means that users who used official Twitter sources tend to have more interactions with other users by sending out more Ret-weets or Reply than Singleton, while users who used busi-ness sources tend to generate one-directional (e.g., Single-ton) tweets. Table 8 summarizes the message type of Su-per Bowl related tweets generated through Twitter official sources and business sources.
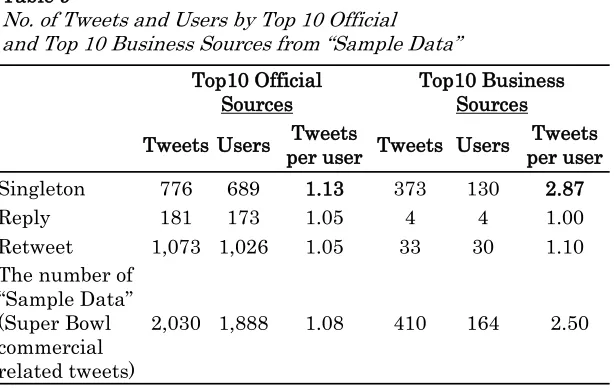
To find out whether there are differences in the amount of tweets generated by Twitter official sources and
Top10 Official
Sources Top10 Business Sources TweetsUsers per userTweets Tweets Users per userTweets
Singleton 776 689 1.13 373 130 2.87
Reply 181 173 1.05 4 4 1.00
Retweet 1,073 1,026 1.05 33 30 1.10
The number of “Sample Data” (Super Bowl commercial related tweets)
2,030 1,888 1.08 410 164 2.50
Table 9
No. of Tweets and Users by Top 10 Official and Top 10 Business Sources from “Sample Data”
Table 10
The number of Identical Tweets of the Top 10 brand names by Twitter Official and Business Sources from “Sample Data”
Source Tweet Count Identical tweets
Official Sources 1,338 150 (11.2 %)
by business sources, we examined how frequently a single user generated tweets from each source. In this analysis, we only chose top 10 sources from each section: top 10 offi-cial sources and top 10 business sources listed in Table 3 (see Table 3). As Table 9 shows, 689 users generated 776 Singleton messages through top 10 official sources (1.13
Table 11
Examples of Identical Tweets from Business Sources from “Sample Data”
Tweet Source
Chrysler stands behind 'America's Import' Super
Bowl ad featuring Bob Dylan http://t.co/a43obiRA6g dlvr.it Chrysler stands behind 'America's Import' Super
Bowl ad featuring Bob Dylan http://t.co/
kr9NoyX0EA dlvr.it
Learn more about the stories behind @Microsoft's #SuperBowl ad & get inspired for your own project!
http://t.co/37wgTzIb79 #technologyrocks Sprinklr Learn more about the stories behind @Microsoft's
#SuperBowl ad & get inspired for your own project!
http://t.co/jANyKD5w1F #technologyrocks Sprinklr Learn more about the stories behind @Microsoft's
#SuperBowl ad & get inspired for your own project!
http://t.co/KReMHazRNE #technologyrocks Sprinklr Our own @mpcmi caught up with Seattle musician
@SangoBeats to talk Super Bowl, great sports crowds & more: http://t.co/EU63FxrMd8
Tweet-Deck Our own @mpcmi caught up with Seattle musician
@SangoBeats to talk Super Bowl, great sports crowds & more: http://t.co/Np3vgTY9Mz
Tweet-Deck Our own @mpcmi caught up with Seattle musician
@SangoBeats to talk Super Bowl, great sports crowds & more: http://t.co/Or4kVFs3Cf
Tweet-Deck Bruno Mars Pepsi Super Bowl XLVIII Halftime
Show Announcement http://t.co/kQSEfk3jzl lOomph Socia-Bruno Mars Pepsi Super Bowl XLVIII Halftime
Socia-messages per user) while 130 users generated 373 Single-ton messages (2.87 messages per user) through top 10 business sources. This indicates that users who used busi-ness sources generated tweets more frequently than users who used Twitter official sources. This suggests that busi-ness sources were more active in generating Singleton tweets than in generating interacting (Retweet or Reply) tweets.
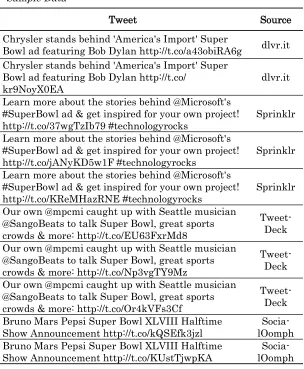
In this analysis, we were also interested in examin-ing whether there were any duplicated messages. Here, we found that business sources generated more identical tweets on top 10 brand names than Twitter official
sources. Sixty-nine percentage of all tweets from business sources were the same duplicated messages while only 11.2% of tweets from Twitter official sources were the same (see Table 10). It implies that those brand names mentioned through business sources were intentionally pushed by marketers to create social buzz on Twitter. Ta-ble 11 shows the examples of identical tweets generated through business sources. Two identical tweet messages, “Chrysler stands behind ‘America’s Import’ Super Bowl ad featuring Bob Dylan,” show two different URLs which were embedded in tweet messages, but they actually came from the same source, dlvr.it.
Discussion and Conclusion
handle the massive amount of data. A total of 5,355,607 tweets (“General Data”) and 73,192 Super Bowl commer-cial related tweets (“Sample Data”) were analyzed.
Several findings of this study deserve further dis-cussions. First, from 2012 to 2014, 2013 recorded the high-est number of tweets, followed by 2014. This can be ex-plained by the nature of the game as the 2013 Super Bowl was considered one of the most exciting games, yielding a final score of 34-31 with 7 touchdowns, 6 field goals, and one safety. The 2013 Super Bowl game kept the audience’s attention to the last minute, making the time between 10:30 p.m. and 10:45 p.m. the most watched part of the game (“CBS Claims,” 2013). In addition, the game yielded several NFL records, such as the touchdown by a 190-yard kick-return (4th touchdown), a touchdown by a quarter-back, and a 34-minute blackout due to a power outage, marked the dynamic nature of the game. Such a dynamic game might be a reason for the high number of tweets ex-changed in 2013. On the other hand, the 2014 Super Bowl game was recorded as the most watched Super Bowl and the most watched program in U.S. television history, reaching 112.2 million viewers (O’Connell, 2014;
big lead by the Seahawks. Such a one-sided game might make people engage in other conversations or other activi-ties rather than paying attention to a broadcasting game and commercials.
Second, the study yielded that the most popular message type for Super Bowl commercial related tweets was the Singleton. This finding implies that Twitter users are not “actively interactive” as marketers would hope to see. This confirms the previous studies that showed lack of interactivity among Twitter users even if one of the unique characteristics of Twitter as a social media platform is the interactivity (Muntinga et al., 2011; Shao, 2009). This has important implications for Twitter and other social media networking sites since advertisers are more likely to pay for user engagement rather than for user impressions. Marketers need to develop or add some features on social networking sites to encourage more engagement and inter-actions among users.
Third, the study found that individual users prefer mobile devices to desktops when they tweet, and prefer official web pages or the mobile applications provided by Twitter even though there are many diverse applications or web pages available. This can be interpreted as people feel using Twitter’s official sources safer and secure than third-party sources as well as easier to use. This finding suggests that mobile apps are good places to run any pro-motional messages to reach further target audiences, and Twitter’s official sites or apps would be more efficient ven-ues for marketers.
The tweets from business sources used more desktop de-vices, took a Singleton type, and provided more duplicated messages (69%) while tweets from official sources used more mobile devices and took a Retweet type with fewer duplicated (11.2%) messages. This was an interesting find-ing in understandfind-ing how Twitter is used differently be-tween individual users and business profit-oriented users.
This study is not without limitations. It did not pro-vide an in-depth analysis of the Twitter content at a micro-level. Accordingly, the motivations or reasons as to why people tweeted at certain moments are unknown. In addi-tion, this study does not provide an insight on the under-standing of how closely people are connected or who is a key player in the networked world. Adding these areas in a future analysis would provide a solid literature on social media uses, particularly on the Twitter usage by examin-ing their roles in the communication process.
in-terfaces through technologies, understanding consumers’ media uses and experiences with Twitter will be challeng-ing. We hope that this study had led us one step closer to facing such challenges.
References
Advertising Age. (2016). Marketing Fact Pack, Retrieved from http://adage.com/d/resources/resources/whitepaper/2016-edition-marketing-fact-pack
Adobe Digital Index. (2014, January 31). Digital & TV ‘double coverage’ key to marketing success at the Super Bowl social media is off the sidelines this year. Advertising Age, Retrieved from http://adage.com.proxy-
tu.researchport.umd.edu/article/adobe/adobe-digital-tv-key-marketing-success-super-bowl/291429/
Baran, S. J., & Davis, D. K. (2011). Mass communication theory: Foundations, ferment, and future. Wadsworth, Cengage Learning.
Barnes, N. G., & Mattson, E. (2009, November 12). The Fortune 500 and blogging: slow and steady and farther along than expected. Retrieved from http://www.umassd.edu-/ cmr/studiesresearch/fortune500.pdf
Boyd, D. M., & Ellison N. B. (2007). Social Network Sites: Defi-nition, history, and scholarship. Journal of Computer-Mediated Communication, 13(1), 210-230.
Byun, C., Lee, H., & Kim, Y. (2012). Automated Twitter data collecting tool for data mining in social network.
Proceedings of the 14th International Conference on Information Integration and Web-based Applications & Services, 196-204, doi: 10.1145/2401603.2401621
fig-ures do not include half hour during
black-out,” (February 04, 2013). Advertising Age. Retrieved from www.adage.com.
Chen, G. M. (2011). Tweet this: A uses and gratifications per-spective on how active Twitter use gratifies a need to connect with others. Computers in Human Behavior, 27
(2), 755-762. doi:10.1016/j.chb.2010.10.023
Chu, S., & Kim, Y. (2011). Determinants of consumer engage-ment in electronic word-of- mouth (eWOM) in social net-working sites. International Journal of Advertising, 30
(1), 47-75.
Cone Business. (2008). 2008 business in social media study. Re-trieved March 11, 2010, from http://www.coneinc.com/ news/request.php?id=1183
Duggan, M. (2015, August 19). The demographics of social me-dia users. Mobile Messaging and Social Media 2015, Re-trieved from http://www.pewinternet.org/2015/08/19/the-demographics-of-social-media-users/
Dumenco, S. (2011, December 14). And the No. 1 Social-TV Hit of the Year Is… (Hint: Not the Oscars or Super Bowl).
Advertising Age, Retrieved from http://adage.com/article/ trending-topics/1-social-tv-hit-year/231574/.
eMarketer. (2015, April). Social Network Ad Spending to Hit $23.68 Billion Worldwide in 2015. Retrieved from http://
www.emarketer.com/Article/Social-Network-Ad- Spending-Hit-2368-Billion-Worldwide-2015/1012357#sthash.lBpDFlob.dpuf.
Eversley, M. (2013, February 4). Super engagement record for Super Bowl. USA Today. Retrieved from http://
www.usatoday.com/story/money/business/2013/02/04/ super-engagement-social-media/1890351/
Ferguson, D.A., & Perse, M. (2000). The World Wide Web as a functional alternative to television. Journal of Broad-casting & Electronic Media, 44(2), 155-174.
disclosiveness. Computers in Human Behavior, 26(6), 1657-1666 doi:10.1016/j.chb.2010.06.014
Homburg, C., Ehm, L., & Artz, M. (2015). Measuring and Man-aging Consumer Sentiment in an Online Community Environment. Journal of Marketing Research,52, 629-641.
Joinson, A.N. (2008). ‘Looking at’, ‘Looking up’ or ‘Keeping up with’ people? Motives and Uses of Facebook. In Proceed-ings of the 26th Annual SIGCHI Conference on Human Factors in Computing Systems (Florence, Italy, April 05-10 2008), CHI ’08, ACM, New York, (pp. 05-1027- 05-1036). Kaplan, A. M., & Haenlein, M. (2010). Users of the world, unite!
The challenges and opportunities of social media. Busi-ness Horizons, 53, 59-68.
Kaye, B. K. (2007). Blog use motivations: An exploratory study. in Tremayne, M. (ed.) Blogging, Citizenship, and the Fu-ture of Media, New York, NY: Routledge, 127-148. King, I., Li, J., & Chan, K. T. (2009). A brief survey of
computa-tional approaches in social computing. Proceedings of the 2009 International Joint Conference onNeural Net-works. 2699-2706.
Ko, H., Cho, C., & Roberts, M. S. (2005). Internet uses and grati-fications: a structural equation model of interactive ad-vertising. Journal of Advertising, 24(2), 57-70.
Kumar, A., Bezawada, R., Rishika, R., Janakiraman, R., & Kan-nan, P.K. (2016). From social to sale: The effects of firm-generated content in social media on customer behavior.
Journal of Marketing, 80, 7-25. DOI: 10.1509/jm.14.0249 Kwak, H., Lee, C., Park, H., & Moon, S. (2010). What is Twitter,
a social network or a news media? Paper presented at the 19th International conference on WWW, Raleigh, NC, April 26-30.
Learnonth, M. (2013, February 25). When did Twitter grow up? Answer: Now. Marketing has become an in-the moment game, thanks to one company, Advertising Age, Re-trieved from http://adage.com/article/digital/twitter- grow/239992/
Lee, H., Han, Y., Kim, K. K., & Kim, Y. (2014). Sports and Social Media: Twitter Usage Patterns during the 2013 Super Bowl Broadcast. Proceedings of the 4th International Conference on Communication, Media, Technology and Design, 250-259
Lin, C.A. (2006). Technology fluidity and on-demand webcasting adoption. Telematics & Informatics, 25(2), 84-98.
Miller, R., & Washington, K. (2013). Consumer use of media & the Internet. Entertainment, Media & Advertising Mar-ket Research Handbook, 13, 21-28.
Muntinga, D. G., Moorman, M., & Smit E. G. (2011). Introducing COBRAs. International Journal of Advertising, 30(1), 13-46.
O’Connell, M. (2014, February 3). TV ratings: Super Bowl XLVIII is most watched in history with 112.2 million viewers. The Hollywood Reporter. Retrieved from http:// www.hollywoodreporter.com/live-feed/tv-ratings-super-bowl-xlviii- 676651
OMNICORE. (2017, January 24), Twitter by the Numbers: stats, demographics & fun facts. Retrieved from https:// www.omnicoreagency.com/twitter-statistics/
Papacharissi, Z., & Rubin, A. M. (2000). Predictors of Internet use. Journal of Broadcasting & Electronic Media, 44(2), 175-196.
Pehlivan, E., Sarican, F., & Berthon, P. (2011). Mining mes-sages: Exploring consumer response to consumer- vs. firm-generated ads. Journal of Consumer Behaviour, 10,
313-321, Published online in Wiley Online Library (wileyonlinelibrary.com) DOI: 10.1002/cb.379
878-886.
Schultz, E. J. (2016, January 4). See the ‘crash the Super Bowl’ finalists’ ads. Advertising Age, Retrieved from http:// adage.com/article/special-report-super-bowl/crash-super-bowl-finalist-ads/301978/.
Shao, G. (2009). Understanding the appeal of user-generated media: a uses and gratification perspective. Internet Re-search, 19(1), 7-25. doi:10.1108/10662240910927795. Stafford, T. F., Stafford, M. R., & Schkade, L. (2004).
Deter-mining uses and gratifications for the Internet. Deci-sion Sciences, 35(2), 259-288.
Steinberg, B. (2012, February 6). Super Bowl breaks its ratings record once again. Advertising Age, Retrieved from http://adage.com.proxy- tu.researchport.umd.edu/article/ special-report-super-bowl/super-bowl-breaks- ratings-record/232563/
Stelzner, M. (2013). The 2013 social media marketing industry report. Social Media Examiner. Retrieved from http:// www.socialmediaexaminer.com/
SocialMediaMarketingIndustryReport2013.pdf.
Tan, S. S. (1985). Mass communication: Theories and Research, New York, NY: Macmillan.
Twitter Inc. (n.d.). Twitter Usage / Company Facts Retrieved May 23, 2017 from https://about.twitter.com/company Warc. (2016, March 21). TV Tweeters have higher ad recall.
Warc.com. Retrieved from http://www.warc.com/ LatestNews/News/EmailNews.news?
ID=36426&Origin=WARCNewsEmail&CID=N36426&P UB=Warc_News&utm_source=WarcNews&utm_medium =email&utm_campaign=WarcNews20160321.
Wohn, D. Y., & Na, E. (2011). Tweeting about TV: Sharing tele-vision viewing experiences via Social media message streams. First Monday, 16(3), 1-14. Retrieved from