82
Students’ Mathematical Preparation:
Differences in Staff and Student Perceptions
Andrew P. Wandela, Clare Robinsonb, Shahab Abdullab, Tim Dalbyb, Anita Frederiksc and Linda Galligand
Corresponding author: [email protected]
a
School of Mechanical and Electrical Engineering, University of Southern Queensland, Toowoomba QLD 4350, Australia
b
Open Access College, University of Southern Queensland, Toowoomba QLD 4350, Australia
c
Learning and Teaching Support, University of Southern Queensland, Toowoomba QLD 4350, Australia
d
School of Agricultural, Computational and Environmental Sciences, University of Southern Queensland, Toowoomba QLD 4350, Australia
Keywords: mathematics preparation, first year university, perceptions, academic staff, students
International Journal of Innovation in Science and Mathematics Education, 23(1), 82-93, 2015.
Abstract
Surveys of staff and first year students from the Science, Nursing, and Engineering and Built Environment disciplines are compared to ascertain the differences between their perceptions regarding the students’ mathematical preparation for their first semester of university. The surveys were conducted after students had received their results from the first semester. Unsurprisingly, the perceived capabilities in the basic topics were generally higher than the advanced topics. In general, staff were pessimistic about the students’ capabilities, while students were optimistic. The pessimism of the staff appears to be linked to the diversity of the student cohort, where students who studied the higher levels of mathematics in Year 12 tended to perceive that they were well prepared, while students who studied the lower levels of mathematics (Year 10 and Mathematics A) were likely to perceive that they were inadequately prepared. This raises the possibility that the course content has been targeted below the capabilities of the higher levels of Year 12 mathematics: a prospect which should be further investigated because of its important implications. An important intervention that significantly improved the capabilities of students was the completion of tertiary pre-entry courses: these students had similar confidence to those who completed intermediate level mathematics (Mathematics B). Mandatory completion of such pre-entry courses for under-qualified students could arrest the tendency to reduce the difficulty of the mathematics in first-year university.
Introduction
83
It has been shown that a smooth transition to tertiary education improves student retention, increases progression rates and reduces stress and anxiety among the first year cohort (Barnard, 2003; Bowles, Dobson, Fisher, and McPhail, 2011; James, Krause, & Jennings 2010a; Marland, 2003). Indeed, even students’ perceptions about mathematics are important (Flegg, Mallet, & Lupton, 2012). In this context, it is crucial that students cope with mathematics and statistics wherever these disciplines appear in first-year courses, and in whatever form. Hence students’ perceptions of their preparation in mathematics and statistics are of particular interest. A dual concept is what lecturers believe about their students’ preparation. The current study looked at both these aspects within the same period of time. First year students and their lecturers were surveyed at University of Southern Queensland (USQ) to discover their perceptions of how well prepared students were for any mathematics or statistics encountered in their first year of study. These surveys even included courses that were not predominantly about mathematics. However, for this comparison of staff and student opinions, the analysis was restricted to responses from science or engineering courses, where the staff or student identified that there was a mathematical component based on the topics in the survey. In addition, lecturers were asked what requirements, in terms of topics and level of mathematics, are necessary for their course even though there may not be a formal prerequisite of a certain level of mathematics. Indeed, many programs at universities use terminology such as “assumed” knowledge or “recommended courses” and there is a concern that students are not given sufficient information to judge their readiness to commence university studies (First Year in Maths, 2014)
In many Australian universities there are several pathways that prospective students may take to enter first year. Each of these pathways has their own level and coverage of mathematical concepts. For example students may enter from school directly or via the Technical and Further Education (TAFE) system. The University also provides entry pathways which include the Tertiary Preparation Program (TPP), an enabling program for domestic students; and English for Academic Purposes (EAP), which is a suite of English language courses. Compounding the complexity of the situation is the fact that many students may also have a considerable time gap between finishing formal study and beginning university and some of these gain entry without a preparatory program, entering on their past experience often with very dated qualifications. So an aspect of the students’ survey was to find out what their pathway was and what their perceptions were about the suitability of the level of mathematics taught within that pathway.
Previous papers (Dalby, Robinson, Abdulla, Galligan, Frederiks, Pigozzo & Wandel, 2013; Galligan, Wandel, Pigozzo, Frederiks, Robinson, Abdulla, & Dalby, 2013) have separately looked at the results of the student and lecturer surveys. This paper will compare the results to see where there is agreement and disagreement between the two perspectives and investigate some of the reasons for the differences.
Methodology
Two surveys were performed after results from semester 1 were released. The timing after the end of semester was to improve survey return rate, and was based on the assumption that after completing a semester of study students could better reflect on whether they could consider themselves well prepared or not based on somewhat empirical evidence. An invitation was sent to lecturers for the students to complete a 3-point Likert survey; the staff placed the message on the Learning Management System. A different survey was distributed to academic staff by broadcasting an email to all academics in the various faculties.
84
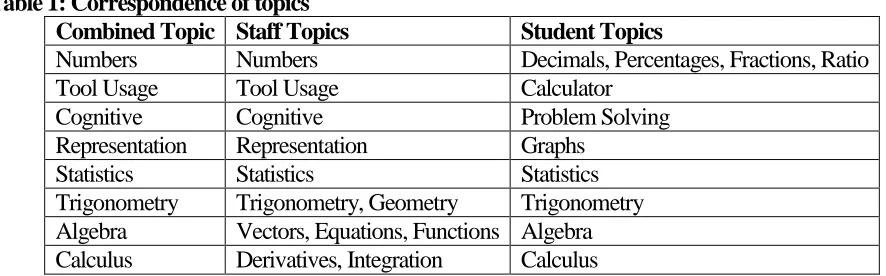
staff questions were categorised according to Table 1. To combine the analysis with the results from Dalby et al. (2013), the topics were categorised according to the Combined Topic in Table 1 to enable direct comparison.
Table 1: Correspondence of topics
Combined Topic Staff Topics Student Topics
Numbers Numbers Decimals, Percentages, Fractions, Ratio
Tool Usage Tool Usage Calculator
Cognitive Cognitive Problem Solving
Representation Representation Graphs
Statistics Statistics Statistics
Trigonometry Trigonometry, Geometry Trigonometry Algebra Vectors, Equations, Functions Algebra Calculus Derivatives, Integration Calculus
Results
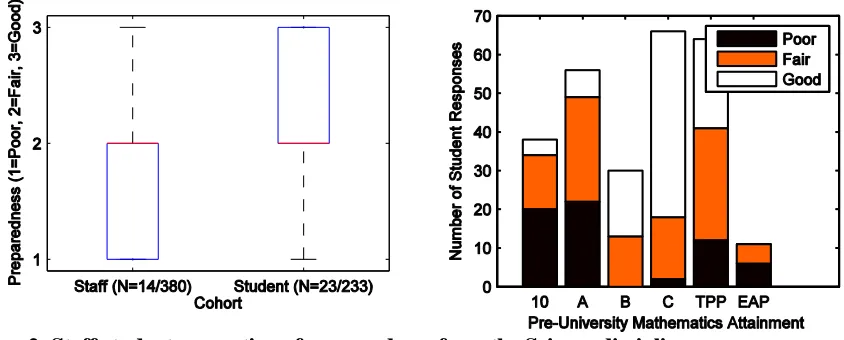
In this section we analyse results with respect to the faculties where the respondents were based. We also looked at the lecturer and student beliefs with regard to mathematical topics. Figures 1 to 12 are based on each individual response to a question about a mathematical topic used in the course. Note that “Not Applicable” responses were removed from the analysis prior to compiling the graphs. While they comprised 56% of all responses relevant to the current study, they were irrelevant to the current investigation and had the potential to overwhelm the relevant responses in the statistical analysis. These responses are discussed further in Galligan et al. (2013) and Dalby et al. (2013), where it must be noted that the previous papers included results from other faculties (Arts, Business and Education) where mathematical content is significantly lower than in Science and Engineering, so the rates of “Not Applicable” responses were correspondingly higher. The two counts of N for each cohort represent the total number of individuals and the total number of countable responses (listed in Table 2). In each box-plot the red line denotes the median and the extent of the box represents the 25th and 75th percentiles. To analyse further the influences on student responses, their self-reported pre-university mathematical attainment is also recorded in each graph. Year 12 Level A mathematics is the basic course, while Level B introduces calculus. Most science and engineering degrees assume their students have the latter level of mathematical knowledge. Level C covers more advanced topics. Those students who identified that they completed a TPP course and also recorded a high-school mathematics level of attainment are counted in both cohorts; the number of such responses is recorded in Table 3.
85
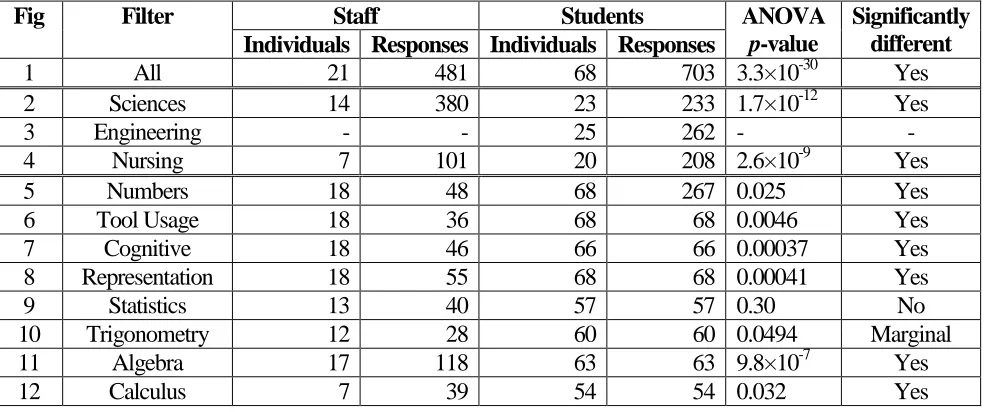
An ANOVA was performed to determine whether the null hypothesis that the means of the staff and student responses are identical was true. The standard criterion is that if the computed p-value is less than 0.05 then the null hypothesis is rejected and it may be concluded that the means are significantly different. Although the data is extremely discrete, the ANOVA test on the means is still a valid method to determine the statistical significance because the mean is a continuous variable. It can be seen that the staff tended to rate the students’ preparation as being unsatisfactory, while the students tended to rate their preparation as satisfactory: the median for both groups was Fair, with the 25th and 75th percentiles for staff containing either Poor or Fair responses, while the same percentiles for students contained Fair or Good responses.
Table 2: Count of responses for each graph. The ANOVA p-value is the likelihood that the Staff and Student Responses are the same within statistical significance (taken to be different if p < 0.05).
Fig Filter Staff Students ANOVA
p-value
Significantly different Individuals Responses Individuals Responses
1 All 21 481 68 703 3.3×10⁻³⁰ Yes
2 Sciences 14 380 23 233 1.7×10⁻¹² Yes
3 Engineering - - 25 262 - -
4 Nursing 7 101 20 208 2.6×10⁻⁹ Yes
5 Numbers 18 48 68 267 0.025 Yes
6 Tool Usage 18 36 68 68 0.0046 Yes
7 Cognitive 18 46 66 66 0.00037 Yes
8 Representation 18 55 68 68 0.00041 Yes
9 Statistics 13 40 57 57 0.30 No
10 Trigonometry 12 28 60 60 0.0494 Marginal
11 Algebra 17 118 63 63 9.8×10⁻⁷ Yes
12 Calculus 7 39 54 54 0.032 Yes
Table 3: Number of responses from students who identified as completing a TPP course based on stated high-school mathematics attainment.
Faculty
High School Attainment
Total 10 A B C Unstated
Sciences 11 20 0 11 22 64
Engineering 0 20 0 0 21 41
Nursing 0 20 0 0 0 20
Total 11 60 0 11 43 125
Comparison of perceptions according to Area of Study
86
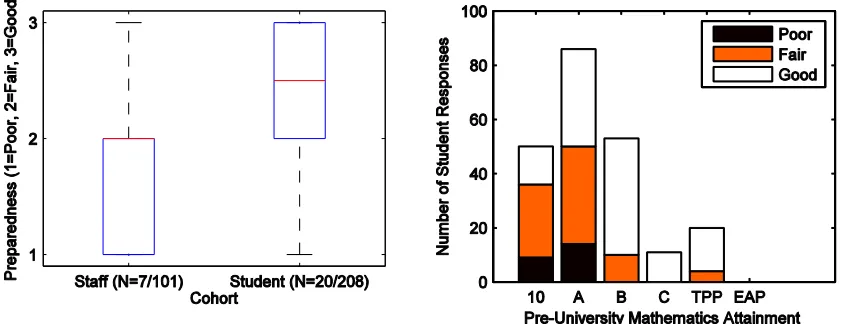
to study Science/Mathematics. Only studying the lower mathematics levels (Year 10 or Mathematics A) is clearly a disadvantage, with a large proportion of Poor responses, while studying Mathematics B or C essentially guarantees that students feel they are prepared for the target level of content from their lecturers. This result suggests that the lecturers may target their content below the capacities normally displayed by students who complete the higher levels of mathematics. This lowering of standards has been observed elsewhere (Jennings, 2009; Varsavsky, 2010). Undertaking the TPP courses improves the confidence of students, while EAP did not help the single student significantly.
Figure 1: Staff-student perception of preparedness from all respondents. (a) Comparison of staff and student submissions. The N for each cohort represents (number of individuals)/(number of responses that are counted). (b) Absolute frequency of responses based on entry mathematical qualifications.
Figure 2: Staff-student perception of preparedness from the Science disciplines.
87
few TPP responses of Poor), while the two TPP students who did not state a High School attainment predominantly responded Good (because otherwise only Maths A students undertook TPP). Of further interest is that there was some evidence of difficulty encountered by Engineering students who had completed Mathematics B, which might be attributed to the new Engineering Mathematics syllabus that was introduced in the same year, which increased the difficulty substantially from previous years. This would also have affected the Year 10 and Mathematics A students in the Associate Degree engineering mathematics course.
Figure 3: Student perception of preparedness from the Engineering and Built Environment disciplines.
Figure 4: Staff-student perception of preparedness from Nursing courses.
88
Comparison of perceptions according to Topic
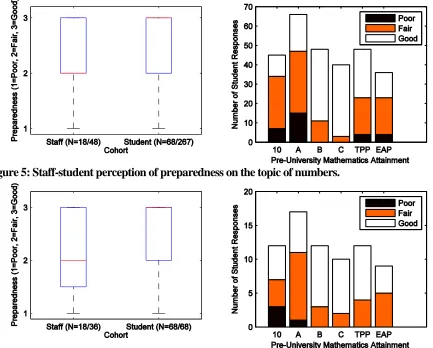
Figure 5 and Figure 6 compare student and lecturers perceptions for the topics “Numbers” and “Tool Usage” respectively. The topic of Numbers covers an understanding of decimals, percentages, fractions and ratios, whilst Tool Usage is the ability to confidently use a calculator. For these two topics, both staff and student perceptions are that student preparedness is Fair to Good with students perceiving they were well prepared (median is Good) compared to the staff opinion of Fair (the value of median and lower quartile). It is important to note that Poor is a rare response, and is restricted almost exclusively to students only completing Year 10 or Mathematics A. Given perception data and the nature of the Mathematics B and C courses, it is reasonable to assume that students who have completed these courses are competent in these basic skills, which need some reinforcement in the lower levels of mathematics. The completion of TPP or EAP has a similar effect to that identified for the overall results.
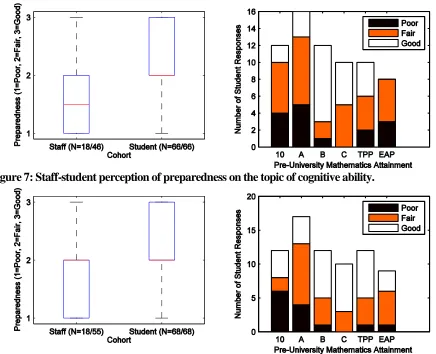
“Cognitive ability” was defined to students as their ability to problem-solve and “Representation” as their ability in utilising/interpreting graphs. The responses to these two topics are shown in Figure 7 and Figure 8, with both figures showing similar trends. Student perceptions are that their ability was Fair (median and lower quartile) to Good. Staff perceptions indicate that students’ preparation was Fair (median and upper quartile) to Poor. A large proportion of Year 10 and Mathematics A students felt unprepared for these topics, with some Mathematics B students also struggling. Importantly, a greater proportion of TPP students were confident, so that the results for Representation are equivalent to Mathematics B, suggesting that TPP is useful for the weaker students.
Figure 5: Staff-student perception of preparedness on the topic of numbers.
89
Figure 7: Staff-student perception of preparedness on the topic of cognitive ability.
Figure 8: Staff-student perception of preparedness on the topic of representation.
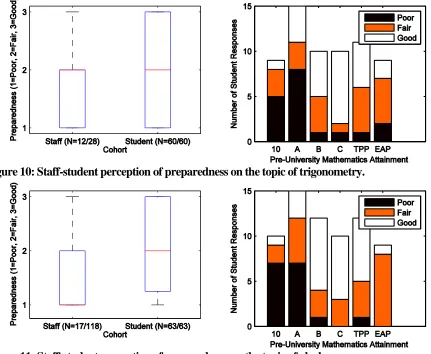
Responses to the topics of preparedness for Statistics and Trigonometry are shown in Figure 9 and Figure 10. Whilst the lecturers’ opinions are similar to the topics of Representation and Cognitive ability (Figure 7 and Figure 8), the student opinions here are widely varying with a large number perceiving that they were ill-prepared. As a consequence, these are the only topics where the staff and student responses were not significantly different (Table 2). An alarming proportion of Year 10 and Mathematics A students perceived that they were inadequately prepared. The TPP and EAP courses improved the capabilities of the students, although statistics remains as a topic which is perceived to be problematic, which is consistent with the findings of Griffith, Adams, Gu, Hart and Nichols-Whitehead (2012).
90
Figure 9: Staff-student perception of preparedness on the topic of statistics.
Figure 10: Staff-student perception of preparedness on the topic of trigonometry.
91
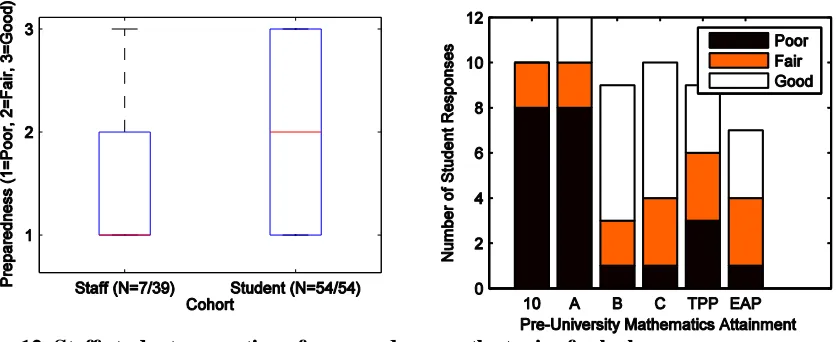
Figure 12: Staff-student perception of preparedness on the topic of calculus.
The perceived ability to perform calculus problems is shown in Figure 12 and indicates that lecturers’ opinions were generally negative with both lower quartile and median reflecting Poor preparation. Students’ opinions were fairly widespread across the entry levels, with almost no positive responses from the lower entry levels, which is unsurprising given that this is a topic that is only formally taught in Mathematics B and C. Those students with Year 10 or Mathematics A attainment who responded Fair or Good either studied university courses which had little calculus or had also completed a TPP course. Studying calculus at high school resulted in most of the students feeling confident in their first semester of university.
Discussion
In general, it was found that staff thought that their students were under-prepared for their courses, with students thinking that they were reasonably prepared. In almost every case considered here, the students considered that their preparation was better by a statistically significant margin than their lecturers perceived their preparation. The only exceptions to this were statistics and trigonometry. Furthermore, staff were of the opinion that students were under-prepared in the majority of cases. This is concerning because it implies that students over-estimated their abilities. However, it is possible that the lecturers’ responses are negatively biased because they attempted to give an holistic measure of the capabilities of the entire class, when there is enormous diversity in the entrance capabilities. It is possible that the staff, in answering the survey, were thinking of the worst students, which is a natural response: lecturers spend the most time helping the weakest students. Future research will seek to discriminate the responses from the lecturers to address this issue.
92
(Jennings, 2009; Varsavsky, 2010). This is an endeavour to make the content more accessible for the lower levels of attainment, thereby making the mathematical content revision for the students who have attained Mathematics B or C. An important remedial tool is the undertaking of pre-entry courses so that students can up-skill. These short courses are effective in improving students’ preparedness, although it does not fully match the two years of education received in Mathematics B.
Conclusion
Separate surveys of academic staff and students are compared to assess each group’s relative opinion on the students’ mathematical preparedness for their first semester of study. The surveys were conducted after students had received their results from semester 1. The levels of capabilities were perceived to be higher for Nursing than Engineering and the remaining Sciences. Also, the levels were quite high for the basic skills such as Tool Usage, with the confidence diminishing to the advanced skills such as Calculus. It was found that students were generally more optimistic about their capabilities compared to the academic staff. One possible explanation for this result was the diversity of student pre-university attainments (ranging from Year 10 to all three Year 12 Levels), where it is possible that the staff responses were negatively biased because they were considering the abilities of the Year 10 and Mathematics A students. The question remains as to where the true level of student preparation lies: probably somewhere in between where the staff and students have rated it. Future investigations will attempt to clarify this issue by changing the way staff respond to the survey so that they can attribute the capability in a topic to a proportion of the class.
It was also found that students at high risk of achieving poorly owing to their low level of high school mathematics attainment should undertake pre-entry courses to improve their skills in order to achieve satisfactory results. These students should be given unambiguous direction if they do not have mathematical “assumed” knowledge or studied the “recommended” courses often referred to in admission requirements. If this was performed across the board, then the difficulty of the mathematics in the first-year courses could be increased so that those students who completed higher levels of high school mathematics attainment are not delayed in learning new content that stretches their capabilities. There is potential to improve academic staff satisfaction by a separate provisioning of preparatory teaching because it would reduce the diversity in any given class, a challenge that was referred to in the introduction.
References
Barnard, D. (2003). The transition to mathematics at university: Students’ views. New Zealand Journal of Mathematics, 32, 1-8.
Bowles, Angela & Dobson, Alexandra & Fisher, Ron & McPhail, Ruth (2011). An Exploratory Investigation into First Year Student Transition to University. In Krause, K., Buckridge, M., Grimmer,C. and Purbrick-Illek, S. (Eds.) Research and Development in Higher Education: Reshaping Higher Education, 34 (pp. 61 – 71). Gold Coast, Australia, 4 – 7 July 2011.
Bradley, D. (2008). Review of Australian higher education: Final report: Department of Education, Employment and Workplace Relations.
93
Dalby, T., Robinson, C., Abdulla, S., Galligan, L., Frederiks, A., Pigozzo, R., & Wandel, A. (2013). Students' mathematical preparation Part B: students' perceptions. Paper presented at the Proceedings of the 9th Delta Conference of Teaching and Learning of Undergraduate Mathematics and Statistics 2013. First Year in Maths. (2014). Forum Communiqué: Assumed Knowledge in Maths: its broad impact on tertiary
STEM programs http://fyimaths.org.au/2014/08/26/national-forum-communique/
Flegg, J., Mallet, D., & Lupton, M. (2012). Students' perceptions of the relevance of mathematics in engineering.
International Journal of Mathematical Education in Science and Technology, 43(6), 717-732. Galligan, L., Wandel, A., Pigozzo, R., Frederiks, A., Robinson, C., Abdulla, S., & Dalby, T. (2013). Students'
mathematical preparation Part A: lecturers' perceptions. Paper presented at the Proceedings of the 9th Delta Conference of Teaching and Learning of Undergraduate Mathematics and Statistics 2013. Gordon, S., & Nicholas, J. (2013a). Prior decisions and experiences about mathematics of students in bridging
courses. International Journal of Mathematical Education in Science and Technology(ahead-of-print), 1-11.
Gordon, S., & Nicholas, J. (2013b). Students’ conceptions of mathematics bridging courses. Journal of Further and
Higher Education, 37(1), 109-125. doi: 10.1080/0309877X.2011.644779
Griffith, J., Adams, L., Gu, L., Hart, C., & Nichols-Whitehead, P. (2012). STUDENTS'ATTITUDES TOWARD STATISTICS ACROSS THE DISCIPLINES: A MIXED-METHODS APPROACH. Statistics Education Research Journal, 11(2).
James, R., Krause, K., & Jennings, C. (2010a). The first year experience in Australian universities: Canberra: DEEWR.
James, R., Krause, K., & Jennings, C. (2010b). The first year experience in Australian universities: Findings from 1994-2009. Melbourne: CSHE.
Jennings, M. (2009). Issues in bridging between senior secondary and first year university mathematics. Paper presented at the Proceedings of the 32nd Annual Conference of the Mathematics Education Research Group of Australasia. MERGA32.
Marland, M. (2003). The Transition from School to University Who prepares whom, when, and how? Arts and Humanities in Higher Education, 2(2), 201-211.
Rylands, L., & Coady, C. (2009). Performance of students with weak mathematics in first-year mathematics and science. International Journal of Mathematical Education in Science and Technology, 40(6), 741-753. Varsavsky, C. (2010). Chances of success in and engagement with mathematics for students who enter university
with a weak mathematics background. International Journal of Mathematical Education in Science and Technology, 41(8), 1037-1049.