Issues
ISSN: 2146-4138
available at http: www.econjournals.com
International Journal of Economics and Financial Issues, 2017, 7(6), 141-146.
The Relationship between Institutional Structure and Economic
Growth: A Comparative Analysis for Selected Countries
#1Ali Acaravci
1*, Sinan Erdogan
21Faculty of Economics and Administrative Sciences, Mustafa Kemal University, Hatay, Turkey, 2Faculty of Economics and
Administrative Sciences, Mustafa Kemal University, Hatay, Turkey. *Email: [email protected]
ABSTRACT
This study explores the long-run relationship between institutional structure and economic growth for selected countries for 1993–2012 period by
using dynamic panel data analysis. The results can be summarized as follows: (i) There exists a cross-sectional dependence for variables and models,
(ii) all variables are stationary at their first difference except for institutional indicator of second group, (iii) there exists a cointegration relationship between non-stationary variables, (iv) institutional structure has positive and statistically significant impact on economic growth in first group of countries, (v) there is no significant relationship between institutional structure and economic growth in second group of countries, (vi) gross capital
formation has positive impact on economic growth in both groups.
Keywords: Institutional Economics, Institutional Structure, Economic Growth, Panel Data Analysis, International Country Risk Guide
JEL Classifications: C33, D72, O50
# This paper depends on the results of Sinan ERDOGAN’s Master Thesis: “The Relationship between Institutional Structure and Economic Growth: A Comparative Analysis for Developed and Developing Countries.”
1. INTRODUCTION
Economic growth inequality is one of the toughest challenge in economics in modern era. What does create the inequality between Nogales Arizona and Nogales Sonora (Acemoglu and
Robinson, 2012)?. Why did Britain industrialize first? Why didn’t other prominent countries of age that industrialize first?
These questions have been prepossessing researchers’ mind for a
long time. Many researchers have made an effort in order to find
answers to these questions. This attempts have contributed to the
rise of development economics in 1950s.
Most of growth and development studies have been created on numeral basis after Keynesian revolution and most of them have a similar approach that is ruling out of societal and political conditions which can be called as institutional factors. This
paradigm has maintained until the late 1970s and researchers
have accepted politics and economics as separated working
fields. Political and sociological factors were not considered
appropriate for formal analysis and were excluded from it.
Besides, these factors have been considered as topics of other
social sciences and policy-making process was seen as a “black
box” (Sayer, 2000). This approach has begun to change at the beginning of the 1980s and has evolved to a “new approach.”
There are many reasons for this alteration, but it can be said that two things came forward that are creation of indexes which measure political and sociological institutions and rise of New Political Economics.
The new approach analyses the interaction of economic decisions with political institutions that can be summarized as follows; examining of how policy decisions are taken, what shapes the policy authorities’ motives and constraints on decision-making
process and how politic conflicts are resolved. Hence, it is accepted
that economics and politics are in a mutual interaction. According to Alt and Crystal (1983), economics and politics cannot be treated
because of their affects. In this regard, Lippi (1999) stated that
political institutions affect policy choices (Telatar, 2004).
This progress has contributed to emergence of new researches in
this field. Particularly, many efforts have been devoted to measure
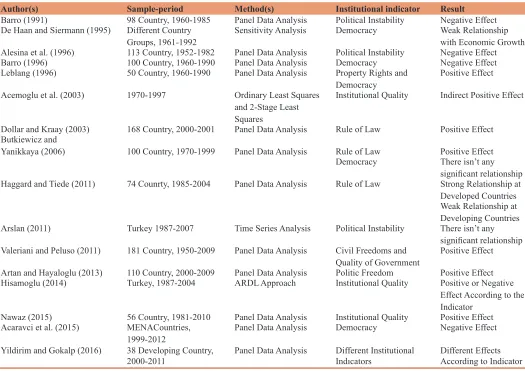
institutions that aim to clarify the interaction between political institutions and economics. The creation of various indices has allowed to empirical testing of political institutions and economic relations. Thus, empirical testing of relationship between political institutions and economics has become easier and the number of studies in this area have increased and relationships between institutions and economics have been analyzed versatile. Some of the prominent papers have been shown at literature table. If the literature table is summed up generally, it can be seen that institutional indicators and analysis methods vary which are used in practice. The reason of this challenge can be that impetus to understanding of growth inequalities between countries which have same investment and resource possibilities that remained as a black box for many years.
This study aims three key issues as follows; emphasizing the importance of political institutions on economic growth process, examining the effects of political institutions on economic growth in terms of selected countries and make a contribution
to the growing literature on this field. This study neither aims to proselytize no one nor find a “panacea” for growth inequalities.
Rest of the paper is organized as follows: Section 2 explains data and model that used in this paper. Section 3 reveals methodology
and empirical findings. Section 4 emphasizes concluding remarks
(Table 1).
2. MODEL AND DATA
This paper employs a logarithmic and linear model as below in order to test the relationship between political institutions and economic growth in terms of selected countries:
Ln gdpit = β0+β1(lninsit)+β2(lngcfit)+β3(lntoit) (1) i = 1,2...I and t = 1,2,…T.
Real GDP (Constant 2005 US$) (lngdp)has been obtained from
World Bank Online Data Base and has been used as an indicator of
economic activity. Political institutions indicator components have been obtained from International Country Risk Guide (ICRG). The ICRG’s political risk indicators consist of 12 subcomponents
(Political Risk Service, 2017). Primarily, these components have been first classified according to their importance for the countries
that included to analysis, then 7 of them have been chosen which are most important for these countries. These components have been re-weighted according to their importance level on political
Table 1: Literature table
Author(s) Sample-period Method(s) Institutional indicator Result
Barro (1991) 98 Country, 1960-1985 Panel Data Analysis Political Instability Negative Effect De Haan and Siermann (1995) Different Country
Groups, 1961-1992 Sensitivity Analysis Democracy Weak Relationship with Economic Growth Alesinaet al. (1996) 113 Country, 1952-1982 Panel Data Analysis Political Instability Negative Effect
Barro (1996) 100 Country, 1960-1990 Panel Data Analysis Democracy Negative Effect Leblang (1996) 50 Country, 1960-1990 Panel Data Analysis Property Rights and
Democracy Positive Effect Acemoglu et al. (2003) 1970-1997 Ordinary Least Squares
and 2-Stage Least Squares
Institutional Quality Indirect Positive Effect
Dollar and Kraay (2003) 168 Country, 2000-2001 Panel Data Analysis Rule of Law Positive Effect
Butkiewicz and
Yanikkaya (2006) 100 Country, 1970-1999 Panel Data Analysis Rule of Law Positive Effect Democracy There isn’t any
significant relationship Haggard and Tiede (2011) 74 Counrty, 1985-2004 Panel Data Analysis Rule of Law Strong Relationship at Developed Countries Weak Relationship at Developing Countries
Arslan (2011) Turkey 1987-2007 Time Series Analysis Political Instability There isn’t any
significant relationship Valeriani and Peluso (2011) 181 Country, 1950-2009 Panel Data Analysis Civil Freedoms and
Quality of Government Positive Effect
Artan and Hayaloglu (2013) 110 Country, 2000-2009 Panel Data Analysis Politic Freedom Positive Effect
Hisamoglu (2014) Turkey, 1987-2004 ARDL Approach Institutional Quality Positive or Negative Effect According to the Indicator
Nawaz (2015) 56 Country, 1981-2010 Panel Data Analysis Institutional Quality Positive Effect Acaravci et al. (2015) MENACountries,
1999-2012 Panel Data Analysis Democracy Negative Effect
Yildirim and Gokalp (2016) 38 Developing Country,
institutions which have shown at Table 2. Furthermore, Political institutions index (lnins) has been created through taking total of
re-weighted components that varies between 0 and 100.
Gross capital formation (Constant 2005 US$) (lngcf) variable
that is one of the important determinant of economic growth and trade openness (lnto) which used as a control variable have been
obtained from World Bank Online Data Base.
Within the scope of the analysis; two panels have been employed. First group consists of G-7 countries. Furthermore, Second group consists of 14 countries that have similar conditions in terms of institutional or economic aspects. Comparing these countries with the G-7 countries is important for a reason as follows; there is an effort to develop the economic and institutional structure in the related countries as G-7 countries. Therefore, the analysis of economic and institutional developments in these countries is important in terms of policy implementations and implications for
converging G-7. Both two groups are shown on Table 3. Data are
complete for all countries between 1993 and 2012 for both groups.
3. METHODOLOGY AND EMPIRICAL
RESULTS
3.1. Testing the Cross-sectional Dependency and Slope Homogeneity
This section firstly aims to examine whether the variables are
cross-sectionally dependence or independent using the approaches
developed by Breusch and Pagan (1980) and Pesaran et al. (2008). Breusch and Pagan propose following cross-section dependence
test which based on Lagrange multiplier:
LM T pij N N
j i N i N
X
= ∼ − = + = −∑
∑
( ) ( ) 2 1 2 1 1 12 (2)
Where (p )ij2 is the correlation coefficient of residuals. Lagrange
multiplier test has good properties for large T and small N. Pesaran
et al. (2008) propose following cross-section dependence test
which is adjusted form of Breusch-Pagan’s LM statics that is called as “Bias-Adjusted LM Test:”
LM
N N
T K p
u adj ij Tij Tij j i N i N = − − − = + =
∑
∑
2 1 2 1 1 1 ( ) ( )- µ
(3)
Bias-adjusted LM test has good properties when T>N or T<N. Besides, Possible biases are adjusted when N is larger than T. Both tests work under the null hypothesis of no cross-sectional
dependency. Furthermore, delta tests that proposed by Pesaran and
Yamagata (2008) have been applied to examine whether there is
slope homogeneity or not. Pesaran and Yamagata’s approach tests null hypothesis of slope homogeneity (H0:βi=β for all i) against
alternative hypothesis of slope heterogeneity (H1:βi≠βj). Delta
test is valid while N,T→∞ and when the error terms are normally
distributed. Two statistics are calculated in delta approach. While delta statistics (4) gives more accurate results for large samples, the small sample properties of delta statistics can be improved under normally distributed errors by using bias adjusted version (5):
∆ = − −
N N S k
k 1
2 (4)
∆adj iT
iT
N N S E z Var z = − −1 ( )
( ) (5)
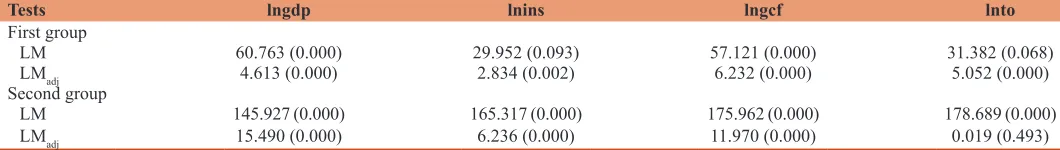
Cross-sectional dependency test results for variables and models are shown in Tables 4 and 5. The null hypothesis of no
cross-sectional dependence is rejected at different significance levels
for variables in both group. Furthermore, the null hypothesis of no cross-sectional dependency is strongly rejected for models in both group. These results suggest that economic cases in one country are affects other countries in each group as well.
Slope homogeneity test result are shown in Table 6. The null hypothesis of slope homogeneity is strongly rejected for each group.
3.2. Stationary Analysis
This paper employs Smith et al. (2004) test that allows
cross-sectional dependency in order to examine stationarity properties
of series. This approach is generally based on Im et al.’s (2003)
approach and computes 5 different statistics under null hypothesis of non-stationarity but this paper uses standard IPS test statistics. This method considers cross-sectional dependency through bootstrap approach and computes t-bar statistics as an average of
individual t-statistics from ADF specification as:
t*= i 0=1 N
t
−∑
1N
(6)t
N t-E(t )
Var (t ) s
i
i
=
{
}
(7)Where i = 1,2,...,N and t = 1,2,…T and the standardized statistics
is given as it is shown in equation (7). Smith et al. (2004) unit root
test results are shown in Tables 7 and 8 for both group. On one hand, the null hypothesis of non-stationary is strongly accepted
Table 2: Political institutions index components
Political risk components ICRG score New score
Law and order 6 20
Democratic accountability 6 20
Government stability 12 16 Military in politics 6 14 Socioeconomic conditions 12 12
Bureaucracy quality 4 10
Corruption 6 8
Total 52 100
Table 3: Countries
First group Second group
Canada Brazil Poland France China Portugal Germany Czech Republic Romania
Italy India Russia
for all variables in the models that includes constant or trend and
constant in the context of first group. Besides, all variables become stationary at their first differences. On the other hand, the null
hypothesis of non-stationarity is strongly accepted for all variables except for institutional variable in the models that includes constant
or trend and constant in the context of second group. Besides, these variables become stationary at their first differences. However, institutional indicator is non-stationary at 1% significance levels
in the model that includes trend and constant while stationary in the models that include constant.
3.3. Cointegration Analysis
The results of the analysis so far can be summarized as follows: i. The null hypothesis of no cross-sectional dependency has
been rejected for each group,
ii. The null hypothesis of slope homogeneity has been rejected, iii. In the context of second group; institutional indicator is
stationary in the model that comprises constant. Furthermore
institutional indicator is stationary at different significance
levels in the model that comprises constant and trend.
It is necessary to consider these conditions to apply the cointegration test. Therefore, Durbin-Hausman approach that
developed by Westerlund (2008) is applied in order to test whether
there is cointegration between variables or not. Durbin-Hausman method allows slope heterogeneity and cross-sectional dependency and test the null hypothesis of no cointegration for whole panel
against the hypothesis of cointegration for some i. Besides,
Durbin-Hausman test is feasible when some of independent variable is stationary. Two statistics are computed within the scope of cointegration that group statistics is computed under
slope heterogeneity and panel statistics is computed under slope
homogeneity. The heterogeneity of the slope coefficients makes
it necessary to use the group statistics in this paper and statistics
specification can be defined as:
DHg Si i i e
i=1 n
it
t=2 T
=
∑
(
−)
2∑
− 1 2(8)
Durbin-Hausman test results are shown in Table 9. The null
hypothesis of no cointegration is rejected at different significance
levels in each group. These results suggest that there is a long-run relationship between variables.
3.4. Estimation of Long-run Cointegration Coefficients
This paper employs Augmented Mean Group Estimator (AMG)
that developed by Eberthardt and Teal (Eberhardt and Bond, 2009; Eberhardt and Teal, 2010; Eberhardt and Teal, 2011) in order to compute long-run cointegration coefficients. AMG approach allows to estimate of coefficients of variables which
have different levels of stationarity under cross-sectional dependency. Furthermore, AMG approach allows to slope heterogeneity. The estimation method consists of two steps as follows:
∆yit b∆xit ct∆Dt eit ct t
t T
= ′ + + ≡ •
=
∑
^ ^µ2
(9)
yit i b xt it c ti di t eit bAMG N bi
i
=α + ′ + + µ^• + = −
∑
•, ^ 1 ^ (10)
Equation 9 is the first ordered standard least squares equation and
contains dummy variables at time T-1. µ^•t parameter that is
included in equation 10 represents linear trends and country-specific features of each cross-section. Including of µ^•t parameter
allows to compute βi or E(βi) coefficient. Long-run coefficient
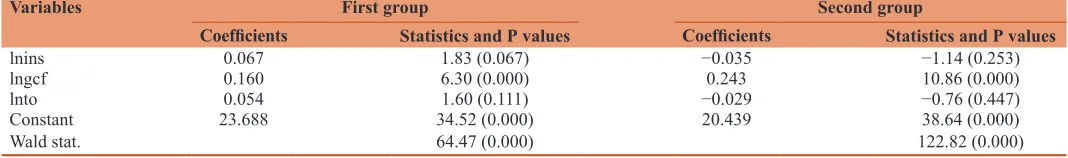
estimations are shown in Table 10 for each group.
Results can be summarized as follows: Institutional indicator is
positively and statistically significant at %10 significance level for first group while statistically insignificant for second group.
Gross-capital formation variable is positively and statistically
significant for each group. On the contrary, trade openness is statistically insignificant for both group.
4. CONCLUSION
This study explores the long-run relationship between institutional structure and economic growth for selected
Table 4: Cross-sectional dependency tests’ results for variables
Tests lngdp lnins lngcf lnto
First group
LM 60.763 (0.000) 29.952 (0.093) 57.121 (0.000) 31.382 (0.068)
LMadj 4.613 (0.000) 2.834 (0.002) 6.232 (0.000) 5.052 (0.000)
Second group
LM 145.927 (0.000) 165.317 (0.000) 175.962 (0.000) 178.689 (0.000)
LMadj 15.490 (0.000) 6.236 (0.000) 11.970 (0.000) 0.019 (0.493)
Probability values for cross-sectional dependency tests are in parenthesis
Table 5: Cross-sectional dependency tests’ results for model
Model ingdp=(lnins, lngcf,
lnto) Statistics and P values
Tests First group Second group
LM 75.599 (0.000) 174.301 (0.000)
LMadj 4.515 (0.000) 3.529 (0.000)
Table 6: Slope homogeneity test results
Tests Statistics and P values
First group
∆~ 8.306 (0.000)
∆~adj 9.516 (0.000)
Second group
∆~ 7.643 (0.000)
countries for 1993–2012 period by using dynamic panel data
analysis. The results can be summarized as follows: (i) There exists a cointegration relationship between non-stationary variables, (ii) institutional structure has positive and statistically
significant impact on economic growth in the first group of countries, (iii) there is no significant relationship between
institutional structure and economic growth in the second group of countries.
The positive effect of institutional structure on economic growth in G-7 countries can be explained by positive effects of institutional structure improvement for establishing an environment of trust for economic activities. Thus, policies that aims to encourage improvements in institutional quality in the G-7 countries contribute to the increase of economic prosperity.
Although there is no empirically significant relationship between
institutional structure and economic growth in terms of second group of countries, the positive contributions of improvements of institutional quality to both social and economic life cannot be ignored factors. It is certain that improvements in the institutional quality will encourage economic stability and a balanced economic growth in these countries in the long run.
REFERENCES
Acaravci, A., Bozkurt, C., Erdogan, S. (2015), Democracy and growth nexus in MENA countries. Journal of Business and Economics
Studies, 3(4), 119-129.
Acemoglu, D., Johnson, S., Robinson, J., Thaicharoen, Y. (2003),
Institutional causes, macroeconomic symptoms: Volatility, crises,
and growth, Journal of Monetary Economics, 50, 43-123.
Acemoglu, D., Robinson, J. (2012), Why Nations Fail? The Origins of Power Prosperity, and Poverty. New York: Crown Business.
Alesina, A., Ozler, S., Roubini, N., Swagel, P. (1996), Political instability and economic growth. Journal of Economic Growth, 1, 189-211.
Alt, J E., Chrystal, K.A. (1983), Political Economics. Berkeley, CA:
University of California Press.
Arslan, U. (2011), Political instability and economic performance: The case of turkey. Ege Academic Review, 11(1), 73-80.
Artan, S., Hayaloglu, P. (2013), The role of institutional structure
explaining the growth differences across countries panel data analysis. Journal of Eskisehir Osman Gazi University Faculty of Economic and Administrative Sciences, 8(13), 31-54.
Barro, R.J. (1991), Economic growth in a cross section of countries. The Quarterly Journal of Economics, 106(2), 407-443.
Barro, R.J. (1996), Democracy and growth. Journal of Economic Growth,
1, 1-27.
Table 7: Smithet al. bootstrap test results for first group
Model Level First difference
IPS statistics IPS statistics
Trend and constant Constant Trend and constant Constant
Variables
lngdp −1.124 (0.945) −2.203 (0.106) −3.750 (0.024) −3.298 (0.010)
lnins −2.384 (0.272) −1.918 (0.136) −2.913 (0.016) −3.001 (0.000)
lngcf −1.839 (0.716) −2.126 (0.108) −3.928 (0.009) −3.610 (0.002)
lnto −3.238 (0.050) −1.647 (0.390) −5.234 (0.000) −5.164 (0.000)
Maximum lag-length has been determined as k=1 and probability values have been obtained from 10,000 bootstrap replication and shown in parenthesis
Table 8: Smithet al. bootstrap test results for second group
Model Level First difference
IPS statistics IPS statistics
Variables Trend and constant Constant Trend and constant Constant
lngdp −1.678 (0.843) −0.650 (0.935) −3.402 (0.006) −3.167 (0.000)
lnins −2.819 (0.022) −2.675 (0.000) −4.270 (0.000) −4.048 (0.000)
lngcf −1.979 (0.679) −0.961 (0.900) −3.607 (0.001) −3.449 (0.000)
lnto −2.566 (0.088) −1.735 (0.230) −4.129 (0.000) −4.160 (0.000)
Maximum lag-length has been determined as k=1 and probability values have been obtained from 10,000 bootstrap replication and shown in parenthesis
Table 9: Durbin-Hausman cointegration test results
Test Statistics and P values
First group Second group
DHg −1.428 (0.077) −2.598 (0.005)
Table 10: Long-run coefficient estimation results
Variables First group Second group
Coefficients Statistics and P values Coefficients Statistics and P values
lnins 0.067 1.83 (0.067) −0.035 −1.14 (0.253)
lngcf 0.160 6.30 (0.000) 0.243 10.86 (0.000)
lnto 0.054 1.60 (0.111) −0.029 −0.76 (0.447)
Constant 23.688 34.52 (0.000) 20.439 38.64 (0.000)
Breusch, P.S., Pagan, A.R. (1980), The lagrange multiplier test and its applications to model specification in econometrics. Review of
Economic Studies, 11(7), 239-253.
Butkiewicz, J.L., Yanikkaya, H. (2006), Institutional quality and economic
growth: Meintenance of the rule of law of democratic institutions,
or both? Economic Modelling, 23, 648-661.
De Haan, J., Siermann, C.L.J. (1995), New evidence on the relationship between democracy and economic growth. Public Choice, 86, 175-198.
Dollar, D., Kraay, A. (2003), Institutions, trade and growth. Journal of Monetary Economics, 50, 133-162.
Eberhardt, M., Bond, S. (2009), Cross-Section Dependence in
Nonstationary Panel Models: A Novel Estimator, MPRA Paper No. 17692, University Library of Munich. Available from: http://
www.mpra.ub.unimuenchen.de/17692.pdf. [Last accessed on 2015
Dec 11].
Eberhardt, M., Teal, F. (2010), Productivity Analysis in Global
Manufacturing Production, Discussion Paper 515, Department of Economics, University of Oxford. Available from: http://www. economics.ox.ac.uk/research/WP/pdf/paper515.pdf. [Last accessed
on 2015 Dec 11].
Eberhardt, M., Teal, F. (2011), Econometrics for grumblers: A new look at
the literature on crosscountry growth empirics. Journal of Economic
Surveys, 25, 109-155.
Haggard, S., Tiede, L. (2011), The rule of law and economic growth: Where are we? World Development, 39(5), 673-685.
Hisamoglu, E. (2014), EU membership, institutions and growth: The case
of Turkey. Economic Modelling, 38, 211-219.
Im, K.S.O., Pesaran, M.H., Shin, Y. (2003), Testing for unit roots in
heterogenius panels. Journal of Econometrics, 115, 53-74. Leblang, D.A. (1996), Property rights, democracy and growth. Political
Research Quarterly, 49, 5-26.
Lippi, F. (1999), Central Bank Independence, Targets and Credibility.
Cheltenham: Edward Elgar.
Nawaz, S. (2015), Growth effects of institutions: A disaggregated analysis.
Economic Modelling, 45, 118-126.
Pesaran, M.H., Ullah, A., Yamagata, T. (2008), A bias-adjusted LM test
for error cross-section independence. Econometrics Journal, 11,
105-127.
Pesaran, M.H., Yamagata, T. (2008), Testing slope homogenity in large panels. Journal of Econometrics, 142, 50-98.
Political Risk Service. (2017), International Counrty Risk Guide (ICRG).
Available from:
http://www.prsgroup.com/about-us/our-two-methodologies/icrg. [Last accessed on 2017 Jul 07].
Sayer, S. (2000), Issues in new political economy: An overview. Journal
of Economic Surveys, 14(5), 513-526.
Smith, L.V., Leybourne, S., Kim, T.H., Newbold, P. (2004), More
powerful panel data unit root tests with an application to mean reversionin real exchange rates. Journal of Applied Econometrics,
19, 147-170.
Telatar, F. (2004), Political Economic Policy. Ankara: Image Press. Valeriani, E., Peluso, S. (2011), The impact of institutional quality on
economic growth and development: An empirical study. Journal of Knowledge Management, Economics and Information Technology, 6, 1-25.
Westerlund, J. (2008), Panel cointegration tests of the fisher effects.
Journal of Applied Econometrics, 23, 193-233.
World Bank. (2017), World Development Indicators. Available from: http://www.databank.worldbank. [Last accessed on 2017 Jul 07]. Yildirim, A., Gokalp, M.F. (2016), Institutions and economic performance: