1
The Use of Simulations in Correcting
Electricity Misconceptions of Grade 10
South African Physical Sciences Learners
Umesh Ramnaraina & Sumayya Moosaa
Corresponding author: Umesh Ramnarain ([email protected])
aUniversity of Johannesburg
Keywords: cognitive tool; computer simulations; electric circuits; misconceptions; three-tier test
International Journal of Innovation in Science and Mathematics Education, 25(5), 1–20, 2017.
Abstract
This study investigated the use of interactive computer simulations in addressing misconceptions held by Grade 10 South African learners on electric circuits. The sample comprised 130 learners from three under-performing schools in a socio-economically disadvantaged township. The misconceptions were identified by means of a three-tier diagnostic test. The first three-tier consisted of conceptual questions; the second three-tier asked for reasons for the choice made on the first-tier item; and the third tier addressed the confidence level of the respondents. A statistical analysis of the data collected revealed a significant difference in the performance of learners on the pre-test and post-test, with learners performing better on the post-test. This suggested that the use of simulations in the science classroom did, to a certain extent, reduce the number of misconceptions previously held by learners. The results from this study support the findings of studies conducted in other countries, and suggest that simulations may be a viable cognitive learning tool in enabling learners to investigate their pre-conceptions and thereby effect conceptual change.
Introduction
2
means of enhancing teaching and learning has led to South Africa’s failing to close the ‘digital divide’. The use of ICT in schools could help overcome some of the challenges of improving the efficiency and productivity of both learning and teaching in South African schools (Mdlongwa, 2012). Furthermore, Czerniewicz and Brown (2014) found that access to success in higher education is about on-going and continuing access to various forms of capital such as ICT.
Researchers have called for an extensive examination of the use of technology learning resources such as simulations in particular learning contexts in order to understand the widespread use of its integration in learning (Cheng & Tsai, 2013; Song, 2014). According to Krajcik and Mun (2014, p. 356) the functionality of simulations can enable learners to “interact virtually with phenomena too dangerous to do in real time, and solve complex problems”. Recent research emphasizes the use of technology such as simulations in learning environments where learners develop knowledge and skills in inquiry-based learning (Chang, Quintana, & Krajcik, 2010; Kang, Kim, & Lee, 2011; Quintana, 2012). However, there is a relative paucity of research globally on its effectiveness in eliminating misconceptions and thereby supporting conceptual understanding in science.
Research data collected over more than three decades has shown that the majority of learners come to the science classroom with pre-instructional knowledge and beliefs about phenomena and concepts that will be taught (Duit & Treagust, 2003). Posner, Strike, Hewson and Gertzog (1982) state that children formulate their own concepts or explanations about how the world around them works. Children also construct these perceived regularities or patterns when asking family members or acquaintances about how and why things happen (Kibuka-Sebitosi, 2007; Pfundt & Duit, 2006). These concepts or ideas are commonly referred to as pre-conceptions. Pfundt and Duit (2006) argue that these pre-conceptions affect learning as they become integrated into learners’ cognitive structures. Many of these experientially and socially constructed conceptions are different to the scientific concepts that are taught in the science classroom. These learner pre-conceptions which do not match the concepts accepted by the mainstream scientific community are referred to as misconceptions. Since these pre-conceptions ‘work’ in the context of the learners’ observations, learners “cling rigidly to their current beliefs” (Pine, Messer & St. John, 2001, p. 83) and are hesitant to accept scientific concepts. As a result, learners experience difficulty in integrating any new information within their cognitive structures, resulting in an inappropriate understanding of new concepts.
A major aspect of science teaching concerns the perceived role and value of learner ideas that teachers hold. Larkin (2012) metaphorically cast misconceptions as either obstacles or
resources in the teaching of science. According to Larkin “When student misconceptions are
cast as obstacles, their presence implies a barrier to student learning and suggests that their absence would lead students more directly to intended learning goals” (p. 932). This perspective suggests that misconceptions need to be dismantled and replaced in order for meaningful learning to take place (Hammer, 1996). The view of misconceptions as resources
3
incorrect conceptions (Chang, Chen, Lin, & Sung, 2008; Chen, Pan, Sung, & Chang, 2013; de Jong & Van Joolingen, 1998).
In responding to this call, the research reported in this article investigated the effect of teachers using computer simulations in addressing misconceptions of electric circuits held by Grade 10 Physical Sciences learners at under-performing Dinaledi schools in the township of Soweto. A
review of research by Smetana and Bell (2012) on the effectiveness of computer simulations
for supporting science teaching and learning during the past four decades revealed that simulations can facilitate conceptual change, and therefore help eliminate misconceptions. A study by Crooks, Sharma and Wilson (2015) provides further evidence that simulations are beneficial in the teaching of Physics. They argue that simulations provide greater opportunities for learners to experience physics phenomena and perform experiments individually. This has resulted in higher levels of comprehension, retention and engagement as well as a positive impact on learner attainment in physics. However, despite this extensive research on
simulations, Smetana and Bell (2012) remark that there are “a limited number of studies
involving low-achieving students and English-language learners (ELL)” (p. 1362). This gap in the research is addressed in this study that was undertaken at South African schools where learners are performing poorly in science, and where English is the second language of such
learners. The topic ‘electric circuits’ was chosen as studies have revealed common and
extensive learner misconceptions related to this topic (Kucukozer & Kocakula h, 2007; Pesman & Eryilmaz, 2010). The common misconception types will be discussed later. There has also been a dearth of research on the effectiveness of simulations in addressing school learner misconceptions in electricity, with the review by Smetana and Bell (2012) showing only one study by Baser (2006) on pre-service teachers having been conducted.
In South Africa, the term ‘township’ usually refers to underdeveloped urban areas that historically were created for ‘non-whites’ during the apartheid era. Communities living in townships in most cases have a low socio-economic status. Dinaledi Schools are specialist Mathematics and Physical Sciences public schools (Department of Education, 2007). They were established in 2001 and there are currently approximately 500 schools nationally. International assessments such as Trends in International Mathematics and Science Studies (TIMSS) repeated over the years from 1990 to 2003 show that the performance of South African learners in mathematics and science, especially Black learners from impoverished communities such as townships is alarmingly poor compared to other developing countries (Martin, Mullis, & Chrostowski, 2004). More recently, the World Economic Forum report for 2015/16 painted a dismal picture, with South Africa placed at 138 out of 140 countries. Dineledi Schools were an initiative by the South African Department of Education to uplift learner participation and performance in Mathematics and Physical Sciences. These schools are provided with additional resources and support to improve teaching and learning.
It is against this background that the following research question was pursued:
To what extent, if any, can the use of simulations correct misconceptions held by Grade 10 Physical Sciences learners at under-performing Dinaledi Schools?
Cognitive Tools Framework
4
source or resource presenting focused information specifically tailored for particular learning goals on a particular topic of interest for learning by a particular target audience” (p.476). The framework guides the investigation in three areas: examine audience and knowledge; create learning activities; and examining learning performance. Each of these facets is now discussed.
Examine Audience and Knowledge
This aspect of the investigation refers to a clear definition of the target audience (age, abilities, prior knowledge, and beliefs) as well as learning goals (science content, scientific reasoning, beliefs/attitudes about science). Within the context of this study, the research focussed on misconceptions of electric circuits held by Grade 10 Physical Sciences learners, and the extent to which these misconceptions could be eliminated through the use of simulations.
A review of the literature on misconceptions in physics shows that electricity is a content area that is strewn with misconceptions. Table 1 summarises the different types of misconceptions in electricity.
Table 1: Misconception types in electricity
Misconception type Description
M1: Sink or Unipolar Model For current to flow, only a single wire should connect the power supply to a device (Sencar & Eryilmaz, 2004; Peşman & Eryilmaz, 2010).
M2: Attenuation Model The current decreases as it travels around the circuit (Shipstone, 1988; McDermott & Shaffer, 1992).
M3: Sharing Current Model The current is shared equally by all devices in a circuit (Shipstone, 1988; Sencar & Eryilmaz, 2004).
M4: Clashing Current Model Positive and negative electricity meet at the electrical device and clash there, causing the electrical device to work (Engelhardt & Beichner, 2004; Peşman & Eryilmaz, 2010).
M5: Empirical Rule Model The further the light bulb is from the power source (battery), the dimmer the light bulb (Borges & Gilbert, 1999)
M6: Short Circuit Model The light bulb will glow regardless of the short circuit that is created by the presence of the conducting wire (Heller & Finley, 1992). M7: Power Supply as a Constant
Current Source Model
5
M8: Parallel Circuit Misconception The more resistors that are added in parallel, the greater the total resistance Heller & Finley, 1992 Borges & Gilbert, 1999). M9: Sequential Reasoning Any change taking place in a circuit is
carried forward in the direction of the current, but not backwards (McDermott & Shaffer, 1992; Chambers & Andre, 1997). M10: Local Reasoning The changes in circuits have only local
effects rather than effects on the whole (Cohen et al., 983; Heller & Finley, 1992). M11: Current Flow as Water Flow Electric current flows within the conducting
wire much like water flows through a pipe (Sencar & Eryilmaz, 2004; Peşman & Eryilmaz, 2010)
Create Learning Activities
6
Extensive research has been conducted on the use of simulations in the science classroom, and some of the advantages are quite compelling. Firstly, they can reduce instructional costs and provide immediate and high quality feedback responses to the science learners (Finkelstein et al., 2005).Therefore, the need to purchase expensive circuit boards and other electrical devices is eliminated, as is the possibility of a failed experiment due to faulty equipment.
Secondly, simulations allow learners to play a more active role in the learning process, thus allowing them to construct their own knowledge. This constructivist approach to teaching and learning is essential for conceptual change and the weakening and elimination of misconceptions (Jaakkola, Nurmi, & Veermans, 2011).
Thirdly, when teaching the topic on electric circuits, the use of simulations permits the learners to visualise more than one circuit at a given time, thus allowing them to compare circuits (González & Reitman, 2001). Simulations of electric circuits also ensure that potential differences and current can be measured quickly and effortlessly, by simply inserting the relevant meter into the circuit (Baser, 2006).
Fourthly, simulations also create opportunities for learners to reflect and modify their concepts while providing them with numerous occasions to receive feedback (Zacharia & Olympiou, 2011). In so doing, learners are also able to formulate and test hypotheses and reconcile any discrepancy between their ideas and the observations in the simulated world (Bliss & Ogborne, 1989).
Lastly, simulations have the ability to foster peer interaction. Research conducted by Bilan (1992) found that learners would often seek out peers to share their experiences and discuss problems. The research also reported that the simulations were able to keep learners with varying abilities interested in interacting with the simulations (Bilan, 1992). This finding was supported by the work of Vogel and colleagues (2006) who found that the use of simulations assisted in improving learner motivation and attitude towards science.
Examining Learning Performance
Learning performance refers to the specific products that are generated by the student as a result of interactions with digital learning activities. Learner performance in this study entailed the understanding of concepts on electric circuits. In order to diagnose learner misconceptions, the research used an instrument that comprised of twenty three-tier multiple-choice questions on the electric circuit.
7
Methodology
This study adopted a quasi-experimental research design where the purpose is “to determine the cause and effect – and there is an intervention controlled by the experimenters” (McMillan & Schumacher, 2010, p. 22). This quasi experimental design uses a pre-test/post-test design. This design involves studying the same participants before and after the experimental manipulation or intervention. The reason pre-test/post-test designs are considered quasi-experimental is because the majority of researchers will manipulate the entire sample. This ensures a larger sample size in order to test the effectiveness of the manipulation (McMillan & Schumacher, 2010).
Context of the Study
This study was conducted at three under-performing Dinaledi schools in Soweto. These Dinaledi schools are classified as under-performing because their matric pass rates were below 60% for two consecutive years. The three schools are situated in fairly close proximity to each other. All three Dinaledi schools selected for this study are Quintile 3 schools. All schools in South Africa are categorised into five categories called quintiles. Quintile 1, 2 and 3 schools are located in poverty-stricken areas and are, therefore, known as ‘no-fee schools’. Quintile 4 and 5 schools are located in more affluent communities, and are fee-paying schools. However, due to their Dinaledi status, the schools in this study are well resourced. Each of these schools receives additional resources such as textbooks, calculators, digital projectors, laptops, and digital software programs.
Data Collection and Analysis
In order to fully address the research question, items from two validated tests were sourced. Twelve items from an instrument developed by Pesman and Eryilmaz (2010) and eight items from a test by Millar and Hames (2002) were selected. This resulted in a test that consisted of 20 three-tier multiple-choice test items. The first five items of the test are presented in Appendix A. The first tier of each item consists of a content question having two to five choices. An example is presented below.
1.1 Will the light bulb in Figure 1 light up?
8
The second tier of each item contains a set of four possible reasons for the answer given in the first tier. The reasons consist of the designated correct answer, together with common learner misconceptions identified from the literature. An example is presented below.
1.2. Which one of the following is the reason for your answer to question 1.1 above? a) The battery and the light bulb are connected by the wire.
b) An extra wire must be connected from the negative terminal to the battery to the screw base of the light bulb so that the positive and negative charges meet in the light bulb.
c) An extra wire must be connected from the negative terminal of the battery to the screw base of the bulb so that the electric current passes through the bulb.
The third tier asks about the confidence level of the respondent in responding to the first two tiers. An example is presented below.
1.3 How confident are you that your answers to 1.1 and 1.2 are correct? a) Very confident
b) Fairly confident c) Not confident d) Just guessing
If a learner gives the correct responses to the first and second tier and answers ‘very confident’ for the last tier, then the response is regarded as a correct answer (Eryilmaz & Sürmeli, 2002). So in the above example, the learners would have had to provide an answer to 1.1 as (b) and 1.2 as (c) and 1.3 as (a) in order for the question to be considered correct. Research studies conducted by Tamir (1989) found that the use of three-tier multiple choice diagnostic instruments to be an effective way of assessing meaningful learning among learners. Tamir revealed that to some extent the three-tier multiple choice questions addressed the limitations of traditional multiple choice questions, as it requires learners not only to justify their choice of answer, by giving a reason, but also to indicate how confident they were about their choice of answer. Furthermore, Connelly (2004), Mann and Treagust (2000) and Williams (2006) found that the three-tier multiple choice instruments makes it easier to test learners’ higher level thinking, more so than conventional multiple choice questions.
9
eliminating the identified misconceptions. A dependent t-test (also called the paired t-test or paired-samples t-test) was used to compare the means of the same sample of learners for the pre- and post-test to establish whether there was a statistically significant difference between these means. The results were tabulated and also represented graphically.
The Intervention
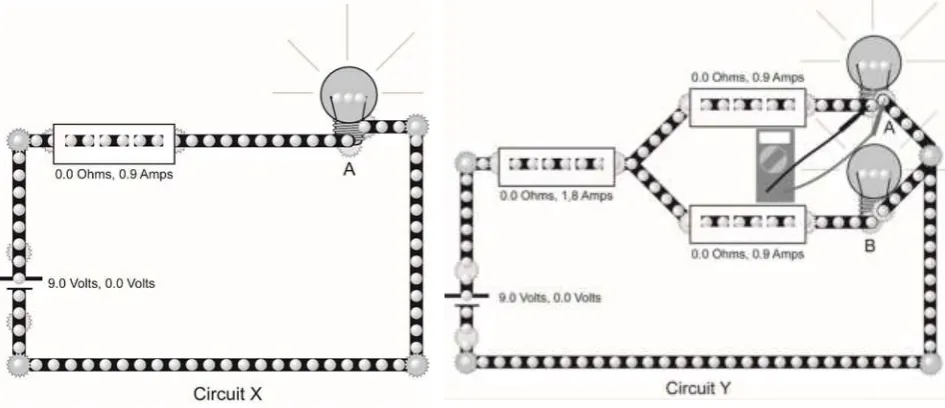
Once the misconceptions were identified by analysing the results of the pre-test, an appropriate simulation was selected. Each of the teachers from the three schools was issued with a CD containing the PhET simulations as well as instructions to be followed. A workshop was organised to orientate the teachers towards using the simulations and how to incorporate them into their lesson preparation. A practice run was conducted to address any difficulties they might have, and to ensure that there would be no unforeseen mishaps. An example of one of the simulations is presented in Figure 1 below.
Figure 1: Screen shot of one of the simulations used
The above simulation was used by teachers in addressing a misconception identified from the pre-test. This simulation is well documented in the literature and referred to as a ‘parallel circuit misconception’ (Cohen, Eylon & Ganiel, 1983; McDermott & Shaffer, 1992; Chambers & Andre, 1997). Here learners conceive that as more light bulbs are added in parallel, the brightness decreases due to an increase in resistance. In addressing this misconception, the teacher supported learners in using the appropriate PhET simulation in order effect conceptual change towards a scientific understanding of the phenomenon. The teachers firstly showed the learners how to construct circuit X and circuit Y on the simulation, and how to place them alongside each other. Thereafter, the teacher allowed the learners to run the simulation in order to observe the brightness of the light bulbs as more light bulbs were added in parallel. The learners also took note of the voltmeter reading.
Results
10
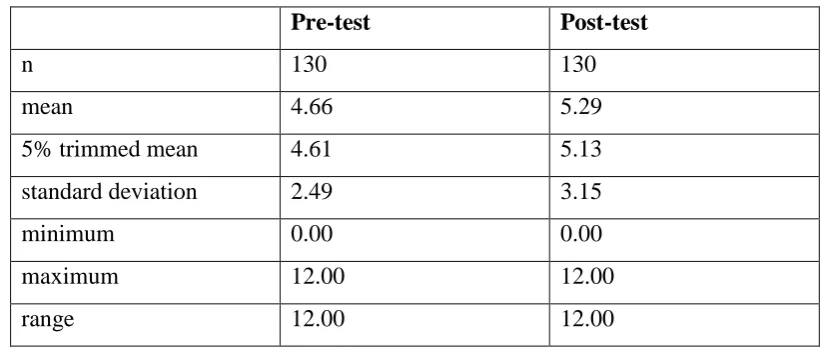
Table 2: Descriptive statistics for pre-test and post-test
Pre-test Post-test
n 130 130
mean 4.66 5.29
5% trimmed mean 4.61 5.13
standard deviation 2.49 3.15
minimum 0.00 0.00
maximum 12.00 12.00
range 12.00 12.00
The mean score for the pre-test was calculated to be 4.66, while for the post-test it was 5.29. Therefore, the mean for the post-test score is higher than the mean score for the pre-test. This would suggest that the learners did better on the post-test than on the pre-test. The 5% trimmed mean is obtained by removing the top and bottom 5% of the population, and then the mean is recalculated (Pallant, 2013). This was done to establish whether the extreme scores had a strong influence on the mean. From Table 2, it is seen there is very little difference between the original mean and the 5% trimmed mean for both the pre- and post-test. Therefore, the outliers had no significant influence on the mean.
The paired sample t-test reflected a significant difference in scores for the pre-test and post-test (t (129) = -2.16, p = 0.03 (two-tailed)), with learners performing significantly better on the post-test than on the pre-test. It can, therefore, be concluded that the use of simulations resulted in learners performing significantly better on the diagnostic test on electric circuits.
11
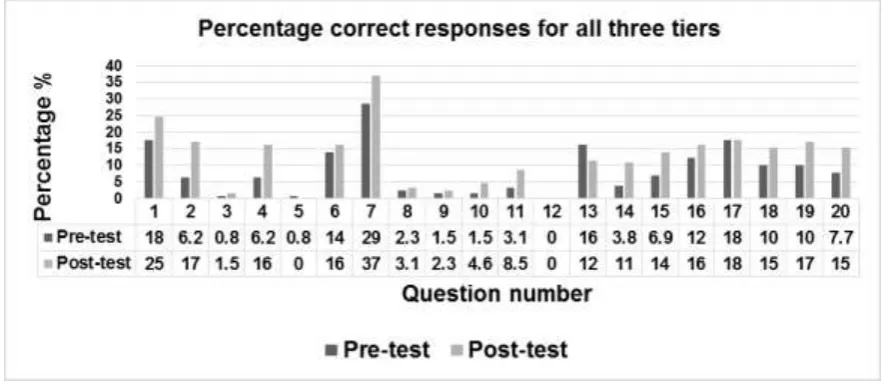
Figure 2: Percentage of learners having correct responses for the pre-test and post-test items
The results indicate that there was an increase in the percentage of correct responses from the pre-test to the post-test for items 1, 2, 3, 4, 6, 7, 8, 9, 10, 11, 14, 15, 16, 18, 19 and 20. Thus, there was an increase in learner performance in 80% of the questions. For items 5 and 13 there was a decrease in the percentage of correct responses; and for questions 12 and 17 the results of the pre-test and post-test remained unchanged. From these results, it can be concluded that the use of simulations as a vehicle to bring about conceptual change, resulted in a decrease in misconceptions, as more learners chose the correct responses.
A detailed analysis now follows on the types of misconceptions that were identified and the effectiveness of the simulation intervention in eradicating such misconceptions. From the results of the pre-test, eleven common misconceptions were identified. These identified misconceptions corresponded to the misconceptions
12
Figure 3: The percentage of misconceptions types revealed the pre- and post-test
From Figure 3 it can be deduced that from the pre- to the post-test there was a decrease in the percentage of misconceptions for misconceptions M3, M4, M5, M6, M10 and M11. It can therefore be concluded from the results that there was a decrease in the prevalence of six of the 11 misconceptions. It should also be noted that some misconceptions persist even after instruction. These results support the findings (Jaakkola & Nurmi, 2008; Ronen & Eliahu, 2000; Treagust & Duit, 2008) that misconceptions are highly resistant and therefore very difficult to eliminate, even when interventions that are specially designed to eliminate them are used.
McNemar’s test is a matched-pair test used to determine whether there is a statistically significant change in nominal data in a pre-test/post-test experimental design. The McNemar’s test was performed for each of the 11 misconceptions. However, only the Shared Current Model misconception (M3) produced a statistically significant result (p < 0.05). It can conclude that for the Sharing Current Model misconception (M3), the use of simulations as an intervention in reducing the misconceptions was effective.
Discussion
This examination on the use of simulation was guided by the cognitive tools framework. The research findings do add credibility to the framework as it enabled the researchers to clearly and coherently plan the study with respect to the target audience and the envisaged learning goals; as well as the learning activities to achieve such goals and the corresponding measurement of performance on these goals.
13
the data collected revealed that there was a significant difference in the performance of learners on the pre-test and post-test, with learners performing better on the post-test. This suggested that the use of simulations in the science classroom did, to a certain extent, reduce the number of misconceptions that were previously held by learners. The results therefore supported the findings of studies conducted by Pesman and Eryilmaz (2010), Engelhardt and Beichner (2004), Taşlidere (2013), and Kapartzianis and Kriek (2014).These studies all found the use of simulations to be effective in addressing learner misconceptions of electric circuits.
South Africa like other countries has a high stakes assessment system that influences teachers in ‘teaching to the test’ (Ramnarain, 2013; Ramnarain, 2016). Further to this, the pressure to cover topics in a content-laden curriculum means that there is insufficient time to support learners in eliminating science misconceptions (Ramnarain & Hobden, 2015) The pedagogical approach of using simulations in addressing misconceptions is a feasible means by which teachers under these prevailing constraints can address learner misconceptions, and support learners in eliminating them.
However, it should be noted that some misconceptions are robust and resistant to change, and that there is no single intervention that can prove successful in eliminating all learner misconceptions (Taşlidere, 2013). Possible reasons for this could be the effects of age, gender and language (Sencar & Eryilmaz, 2004; Rollnick, 2000). It is recommended that a follow-up study be conducted to test the effects of age, gender and language on learner performance. It is further recommended that the use of simulations be investigated not only for electric circuits, but also for other physics and chemistry topics in Grade 10.
The findings of this research add support for the integration of technology in the teaching and learning of science, especially at schools where performance in science is poor, and in contexts such as in South African where ICT integration is developing. Despite the widespread use of technology in many aspects of our work and personal lives, ICT has been under-utilised in the science classroom (Songer, 2007). A study by Wilson-Strydom and Thomson (2005) revealed that teachers at disadvantaged schools are just starting to explore the possibilities of integration of ICTs in their lessons, and that they need to be supported in this regard. A possible reason for this is that teachers lack the pedagogical knowledge and technological knowledge required to achieve this integration. This research has shown that if teachers are provided with the necessary support, this integration can take place to good effect. The cognitive tools framework can be applied in guiding the redesign of existing digital resources into a cognitive tool that may contribute to the achievement of science learning outcomes.
References
Baser, M. (2006). Effects of conceptual change and traditional confirmatory simulations on pre-service teachers’ understanding of direct current circuits. Journal of Science Education and Technology, 15, 367–381. Bilan, B. (1992). Computer simulations: An Integrated tool. SAGE/6th Canadian Symposium, The University of
Calgary.
Bliss, J., & Ogborn, J. (1989). Tools for exploratory learning: A research programme. Journal of Computer Assisted Learning, 5(1), 37–50.
Borges, A.T., & Gilbert, J.K. (1999). Mental models of electricity. International Journal of Science Education, 21, 95–117.
Burden, K., & Kearney, M. (2016). Future scenarios for mobile science learning. Research in Science Education,46(2), 287–308.
14
Chang, K.E., Chen, Y.L., Lin, H.Y., & Sung, Y.T. (2008). Effects of learning support in simulation-based physics learning. Computers & Education, 51(4), 1486–1498
Chang, H., Quintana, C., & Krajcik, J.S. (2010). The impact of designing and evaluating molecular animations on how well middle school students understand the particulate nature of matter. Science Education, 94(1), 73–94.
Chen, Y.L., Pan, P.R., Sung, Y.T., & Chang, K.E. (2013). Correcting Misconceptions on Electronics: Effects of a simulation-based learning environment backed by a conceptual change model. Educational Technology & Society, 16(2), 212–227.
Cheng, K.H., & Tsai, C.C. (2013). Affordances of augmented reality in science learning: Suggestions for future research. Journal of Science Education and Technology,22(4), 449–462.
Cochrane, T., & Antonczak, L. (2014). Implementing a mobile social media framework for designing creative pedagogies. Social Sciences,3(3), 359–377.
Cohen, R., Eylon, B., & Ganiel, U. (1983). Potential difference and current in simple electric circuits: A study of student’s concepts. American Journal of Physics, 51, 407–412.
Cohen, D., Raudenbush, S., & Ball, D. (2000). Resources, instruction, and research. Seattle, WA: University of Washington, Center for the Study of Teaching and Policy.
Connelly, L.B. (2004). Assertion-reason assessment in formative and summative tests: Results from two graduate case studies. In R. Ottewill, E. Borredon, L. Falque, B. Macfarlane & A. Wall (Eds). Educational innovation in economics and business VIII: pedagogy, technology and innovation (pp. 359–378).
Dordrecht: Kluwer Academic Publishers.
Crook, S.J., Sharma, M.D., & Wilson, R. (2015). An evaluation of the impact of 1:1 laptops on student attainment in senior high school sciences. International Journal of Science Education, 37(2), 272–293. Czerniewicz, L. & Brown, C. (2014). The habitus and technological practices of rural students:
A case study. South African Journal of Education. 34(1), 1–14.
De Jong, T., & Van Joolingen, W.R. (1998). Scientific discovery learning with computer simulations of conceptual domains. Review of Educational Research, 68(2), 179–201
Department of Education (2004). White Paper on e-Learning. Government Printer: Pretoria. Department of Education (2007). Report on Dinaledi Schools. Government Printer: Pretoria.
Duit, R., & Treagust, D.F. (2003). Conceptual change: A powerful framework for improving science teaching and learning. International Journal of Science Education, 25(6), 671–688.
Engelhardt, P., & Beichner, R.J. (2004). Students’ understanding of direct current resistive electrical circuits.
American Journal of Physics, 72(1), 98–115.
Eryilmaz, A., & Sürmeli, E. (2002). Assessment of students’ misconceptions about heat and temperature by means of three-tier questions. Paper presented at the 5th National Conference on Science and Mathematics Education.
Finkelstein, N.D., Adams, W.K., Keller, C.J., Kohl, P.B., Perkins, K.K., Podolefsky, N.S., Reid, S., & LeMaster, R. (2005). When learning about the real world is better done virtually: A study of substituting computer simulations for laboratory equipment. Physical Review Special Topics-Physics Education Research, 1(1), 010103.
Hammer, D. (1996). More than misconceptions: Multiple perspectives on student knowledge and reasoning, and an appropriate role for education research. American Journal of Physics, 64, 1316–1325.
Heller, P.M., & Finley, F.N. (1992). Variable uses of alternative conceptions: A case study in current electricity
Journal of Research in Science Teaching, 29(3), 259–275.
Jaakkola, T., & Nurmi, S. (2008). Fostering elementary school students’ understanding of simple electricity by combining simulation and laboratory activities. Journal of Computer Assisted Learning, 24(4), 271–283. Jaakkola, T., Nurmi, S., & Veermans, K. (2011). A comparison of students' conceptual understanding of electric
circuits in simulation only and simulation-laboratory contexts. Journal of Research in Science Teaching, 48(1), 71–93.
Kang, M., Kim, H.S., & Lee, J. (2011). The effects of flow and cognitive presence on learning outcomes in a middle school science class using Web-based simulation. Journal of Educational Information and Media,
17(1), 39–61.
Kapartzianis, A., & Kriek, J. (2014). Conceptual change activities alleviating misconceptions about electric circuits. Journal of Baltic Science Education, 13(3), 298–315.
Khan, S. (2011). New pedagogies on teaching science with computer simulations. Journal of Science Education and Technology, 20(3), 215–232.
Kibuka-Sebitosi, E. (2007). Understanding genetics and inheritance in rural schools. Journal of Biological Education, 41(2), 56–61.
15
Küçüközer, H., & Kocakülah, S. (2007). Secondary school students’ misconceptions about simple electric circuits. Journal of Turkish Science Education4(1), 101–115.
Larkin, D. (2012). Misconceptions about misconceptions: Pre-service secondary science teachers' views on the value and role of student ideas. Science Education, 96(5), 927–959.
Linn, M.C., Eylon, B., & Davis, E.A. (2004). The knowledge integration perspective on learning. In M.C. Linn, E.A. Davis, & P. Bell (Eds), Internet environments for science education (pp. 29–64) Mahwah, NJ: Lawrence Erlbaum Associates.
Mann, M., & Treagust, D. (2000). An instrument to diagnose students’ conceptions of breathing, gas exchange and respiration. Proceedings of the Annual Meeting of the National Association for Research in Science Teaching, New Orleans, April.
McDermott, L.C., & Shaffer, P.S. (1992). Research as a guide for curriculum development: An example from introductory electricity. Part I: Investigation of student understanding. American Journal of Physics. 60(11), 994–1003.
McMillan, J.H., & Schumacher, S. (2014). Research in education: Evidence-based inquiry. Boston: Pearson Higher Education.
Mdlongwa, T. (2012). Information and communication technology (ICT) as a means of enhancing education in schools in South Africa: Challenges, benefits and recommendations. Policy Brief, 80, Africa Institute of South Africa, 1–7.
Millar, R., & Hames, V. (2002). EPSE Project 1: Using diagnostic assessment to improve science teaching and learning. School Science Review, 84(307), 21–24.
Martin, M.O., Mullis, I.V.S., & Chrostowski, S.J. (2004). TIMSS 2003 technical report. Chestnut Hill, MA: TIMSS & PIRLS International Study Center, Lynch School of Education, Boston College.
Osborne, J., & Hennessy, S. (2003). Literature review in science education and the role of ICT: Promise, problems and future directions. Bristol: Nesta: Futurelab Series.
Pallant, J. (2013). SPSS survival manual: A step by step guide to data analysis using IBM SPSS. Maidenhead: Open University Press.
Perkins, K.K., Adams, W.K., Dubson, M., Finkelstein, N.D. Reid, S., Wieman, C., & LeMaster, R. (2006). PhET: Interactive simulations for teaching and learning physics. The Physics Teacher, 44, 18–23. Peşman, H., & Eryılmaz, A. (2010). Development of a three-tier test to assess misconceptions about simple
electric circuits. The Journal of Educational Research, 103, 208–222.
Pfundt, H., & Duit, R. (2006). Bibliography: Students’ and teachers’ conceptions and science education. Kiel: IPN.
Pine, K., Messer, D. & St. John, K. (2001). Children's misconceptions in primary science: A survey of teachers' views. Research in Science & Technological Education, 19(1), 79–96.
Posner, G.J., Strike, K.A., Hewson, P.W., & Gertzog, W.A. (1982). Accommodation of a scientific conception: Toward a theory of conceptual change. Science Education, 66(2), 211–227.
Quintana, C. (2012). Pervasive science: Using mobile devices and the cloud to support science education anytime, anyplace. Interactions, 19(4) 76–80.
Ramnarain, U. (2013). The achievement goal orientation of disadvantaged Physical Sciences students from South Africa. Journal of Baltic Science Education, 12(2), 139–151.
Ramnarain, U., & Hobden, P. (2015). Shifting South African learners towards greater autonomy in scientific investigations. Journal of Curriculum Studies, 47(1), 94–121.
Ramnarain, U. (2016). Understanding the influence of intrinsic and extrinsic factors on inquiry-based science education at township schools in South Africa. Journal of Research in Science Teaching, 53(4), 598–619. Rollnick, M. (2000). Current issues and perspectives on second language learning of science. Studies in Science
Education, 35, 93–122
Ronen, M., & Eliahu, M. (2000). Simulation - A bridge between theory and reality: The case of electric circuits.
Journal of Computer Assisted Learning, 16, 14–26.
Sencar, S., & Eryilmaz, A. (2004). Factors mediating the effect of gender on ninth‐grade Turkish students’ misconceptions concerning electric circuits. Journal of Research in Science Teaching, 41, 603–616. Shipstone, D.M. (1988). Pupils understanding of simple electrical circuits. Some implications for instruction.
Physics education, 23, 92–96.
Shipstone, D.M., Jung, W., & Dupin, J.J. (1988). A study of students’ understanding of electricity in five European countries. International Journal of Science Education, 10(3), 303–316.
Smetana, L. K., & Bell, R. L. (2012). Computer simulations to support science instruction and learning: A critical review of the literature, International Journal of Science Education,34(9), 1337–1370.
16
Songer, N.B. (2007). Digital resources versus cognitive tools. A discussion of learning science with technology. In S.K. Abel & N.G. Lederman (Eds), Handbook of research on science education (pp. 471–491). New York: Routledge.
Tamir, P. (1989). Some issues related to the use of justifications to multiple-choice answers. Journal of Biological Education, 23(4), 285–292.
Taşlıdere, E. (2013). Effect of conceptual change oriented instruction on students’ conceptual understanding and decreasing their misconceptions in DC electric circuits. Creative Education, 4,273–282.
Treagust, D.F., & Duit, R. (2008). Conceptual change: A discussion of theoretical, methodological and practical challenges for science education. Cultural Studies of Science Education, 3(2), 297–328.
Vogel, J.J., Vogel, D.S., Cannon-Bowers, J., Bowers, C.A., Muse, K., & Wright, M. (2006). Computer gaming and interactive simulations for learning: A meta-analysis. Journal of Educational Computing Research,
34(3), 229–243.
Vosniadou, S. (2002). On the nature of naive physics. In M. Limon & L. Mason (Eds.), Reconsidering conceptual change: Issues in theory and practice (pp. 61-76). Dordrecht: Kluwer.
Wieman, C.E., Perkins, K.K., & Adams, W.K. (2008). Oersted Medal Lecture 2007. Interactive simulations for teaching physics: What works, what doesn’t, and why? American Journal of Physics, 76 (4 /5), 393–399. Williams, J.B. (2006). Assertion‐reason multiple‐choice testing as a tool for deep learning: A qualitative
analysis. Assessment & Evaluation in Higher Education, 31(3), 287–301.
Wilson-Strydom, M., & Thomson, J. (200)5. Understanding ICT integration in South African classrooms.
SchoolNet SA Research and Evaluation.
Zacharia ZC & Olympiou G 2011. Physical versus virtual manipulative experimentation in physics learning.
17
Appendix A
Diagnostic test for misconceptions on electric circuits 1.2 Will the light bulb in Figure 1 light up?
c) Yes, it will. d) No, it will not.
1.2. Which one of the following is the reason for your answer to question 1.1 above? d) The battery and the light bulb are connected by the wire.
e) An extra wire must be connected from the negative terminal to the battery to the screw base of the light bulb so that the positive and negative charges meet in the light bulb.
f) An extra wire must be connected from the negative terminal of the battery to the screw base of the bulb so that the electric current passes through the bulb.
1.3 How confident are you that your answers to 1.1 and 1.2 are correct? e) Very confident
f) Fairly confident g) Not confident h) Just guessing
2.1 Consider the Figure 2, the circuit diagram below.
18 a) i1 = 0,6AI2 = 0,3A andi3 = 0,3A b) i1 = 0,4AI2 = 0,4A andi3 = 0,4A
2.2 Which one of the following is a possible reason for your answer to question 2.1 above? a) After the current is divided evenly on the first junction, it is again divided evenly
on the second junction.
b) Because the identical light bulbs are in parallel, currents with the same magnitude pass through the light bulbs.
2.3 How confident are you that your answers to question 2.1 and 2.2 are correct? a) Very confident
b) Fairly confident c) Not confident d) Just guessing
3. Study the two circuit diagrams, Figure 3 and Figure 4 below and then proceed to answer questions 3 and 4.
3.1 Compare the size of the current at Point 1 in Figure 3 with the current at Point 1 in
Figure 4.
a) More current inFigure 3
b) More current in Figure 4
c) Equal current in both Figure 3 and Figure 4.
3.2 Which one of the following statements best explains your answer to question 3.1 above? a) The currents, which come from the batteries with the same magnitude, have not
been consumed yet in both Figure 3 and Figure 4.
b) The potential difference supplied by the batteries, are the same in both Figure 3 and
Figure 4, but the total resistance in Figure 4 is bigger.
19
3.3 How confident are you that your answers to question 3.1 and 3.2 are correct? a) Very confident
b) Fairly confident c) Not confident d) Just guessing
4. Study Figure 4 below and answer the questions that follow.
4.1 In Figure 4 compare the magnitude (size) of the current at Point 1 and Point 2 and
Point 3, as well as compare the brightness of the light bulb A and light bulb B.
i1 represents the current at Point 1 i2 represents the current at Point 2 i3 represents the current at Point 3
Current Brightness of light bulbs
a i1 = i2= i3 Light bulb A and light bulb B have the same brightness b i3> i2>i1 Light bulb B is brighter
c i1> i2>i3 Light bulb A is brighter
d i1> i2>i3 Light bulb A and light bulb B have the same brightness
4.2 Which one of the following statements best explains your answer to question 4.1 above? a) The closer the light bulb is to the battery, the brighter the light bulb will glow. b) In series circuits, the magnitude (size) of the current is the same at all points in the
circuit.
c) The current is consumed by the light bulb and it causes the light bulb to become less bright.
4.3 How confident are you that your answers to question 4.1 and 4.2 are correct? a) Very confident
b) Fairly confident c) Not confident d) Just guessing
20
5.1 Compare the amount of current at Point 1 in Figure 5 with the amount of current at
Point 1 in Figure 6.
a) There is more current at Point 1 in Figure 5
b) There is more current at Point 1 in Figure 6
c) There is the same amount of current at Point 1 in Figure 5 and in Point 1 in
Figure 6.
5.2 Which one of the following statements best explains your answer to question 5.1? a) Because there are two bulbs in Figure 6, the total resistance is more.
b) In Figure 6, the current coming from the battery is divided into two branches. c) While the battery supplies one light bulb with current in Figure 5, it supplies
two light bulbs in Figure 6.
d) The total resistance is smaller in Figure 6.
e) The currents have not been divided into branches in both Figure 5 and Figure 6.
5.3 How confident are you that your answers to question 5.1 and 5.2 are correct? a) Very confident