Patron: Her Majesty The Queen Rothamsted Research Harpenden, Herts, AL5 2JQ Telephone: +44 (0)1582 763133 Web: http://www.rothamsted.ac.uk/
Rothamsted Research is a Company Limited by Guarantee Registered Office: as above. Registered in England No. 2393175. Registered Charity No. 802038. VAT No. 197 4201 51.
Rothamsted Repository Download
A - Papers appearing in refereed journals
Al-Barrak, M., Loxdale, H. D., Brookes, C. P., Dawah, H. A., Biron, D. G.
and Alsagair, O. 2004. Molecular evidence using enzyme and RAPD
markers for sympatric evolution in British species of Tetramesa
(Hymenoptera: Eurytomidae). Biological Journal of the Linnean Society.
83, pp. 509-525.
The publisher's version can be accessed at:
•
https://dx.doi.org/10.1111/j.1095-8312.2004.00408.x
The output can be accessed at:
https://repository.rothamsted.ac.uk/item/8945y/molecular-evidence-using-enzyme-and-
rapd-markers-for-sympatric-evolution-in-british-species-of-tetramesa-hymenoptera-eurytomidae
.
© Please contact library@rothamsted.ac.uk for copyright queries.
Biological Journal of the Linnean Society, 2004, 83, 509–525. With 4 figures
Blackwell Science, LtdOxford, UKBIJBiological Journal of the Linnean Society0024-4066The Lin-nean Society of London, 2004? 2004
834 509525 Original Article
MOLECULAR EVIDENCE FOR SYMPATRIC EVOLUTION IN BRITISH
TETRAMESA
M. AL-BARRAK
ET AL.
*Corresponding author. E-mail: hugh.loxdale@bbsrc.ac.uk
Molecular evidence using enzyme and RAPD markers for
sympatric evolution in British species of
Tetramesa
(Hymenoptera: Eurytomidae)
M. AL-BARRAK
1, H. D. LOXDALE
FLS2
*, C. P. BROOKES
2, H. A. DAWAH
3, D. G. BIRON
4and
O. ALSAGAIR
51
School of Biosciences, Cardiff University, PO Box 915, Cardiff CF10 3XF, UK
2
Plant and Invertebrate Ecology Division, Rothamsted Research, Harpenden, Herts AL5 2JQ, UK
3
King Khalid University, College of Science, Biology Department, PO Box 9004, Abha, Saudi Arabia
4
CEPM, IRD, 911 Avenue Agropolis BP 64501, 34394 Montpellier Cedex5, France
5
King Saud University, College of Science Bureidah, Al-Qassim, Saudi Arabia
Received 21 July 2003; accepted for publication 2 April 2004
Some species of the insect genus Tetramesa (Hymenoptera: Eurytomidae), which has a world-wide distribution, are
morphologically very similar, both in the adult and larval stages. In the British Isles, there are 37 recorded species, all of which feed on grasses as larvae and are largely host specific. Some form galls on their hosts; others do not. We used a range of enzyme and random amplified polymorphic DNA (RAPD) markers to investigate a complex of five cryptic species occurring sympatrically in the UK, collected from seven sites in mainland England and Wales: T. calamagrostidis (von Schlechtendal), T. longicornis (Walker) and T. petiolata (Walker) infesting different grass
hosts, and T. hyalipennis (Walker) s.l. comprising two-host adapted forms (labelled 1 and 2) reared from the grasses
Elymus repens and E. farctus, respectively. Nine soluble enzyme systems (some known to be polymorphic in other insects) and 37 RAPD primers allowed taxonomic separation of the species. However, whilst RAPD markers were
able to discriminate between the two host-adapted forms of T. hyalipennis, enzyme markers (producing phenotypic
profiles in the absence of genetic crosses) could not. Upon calculating genetic distances for the RAPD data from which a cladogram of Euclidean distances (relatedness) was produced along with multivariate analysis of the data, T. longicornis was shown to be the most ‘basal’ species, and most related to T. hyalipennis s.l.; T. calamagrostidis and T. petiolata were found to be more distantly related to these species but most closely related to each other. The two
forms of T. hyalipennis s.l. appear to be the most closely related of any of the species investigated, probably diverging
the most recently. From this data, and since the populations examined were all sympatric without obvious physical barriers to reproduction, it can be concluded that some degree of sympatric evolution has occurred, most obviously
in the case of the host-adapted forms of T. hyalipennis. If so, this complex of species could be another rare example
of sympatric speciation in insects. Further research using more sophisticated molecular markers such as microsat-ellites, amplified fragment length polymorphic markers (AFLPs) and DNA sequencing (e.g. of mtDNA and ribosomal DNA regions), in conjunction with behavioural studies, are required to further elucidate this interesting species
group. © 2004 The Linnean Society of London, Biological Journal of the Linnean Society, 2004, 83, 509–525.
ADDITIONAL KEYWORDS:
cladogram – enzymes – jointworms – multivariate analysis – RAPDs – sympatricspeciation.
INTRODUCTION
Insects of the genus Tetramesa Walker (=Isosoma
Walker; =Harmolita Motsch.) (Hymenoptera:
Euryto-midae) are small (~2–3 mm in length), winged,
gener-ally black in colour, and feed on nectar as adult wasps. In the larval stage, they are phytophagous on cereals and grasses (Poaceae), the eggs being laid on the stems of their hosts (Claridge & Dawah, 1994). They are pri-marily a north temperate genus, comprising around 205 species world-wide (Holarctic, Afro-tropical; Burks, 1971, 1979). There are 63 species recorded from
510
M. AL-BARRAK ET AL.America, north of Mexico (Peck, 1963), and they are similarly abundant in the Palaearctic region with 61 species recorded from the former Soviet Union (Zerova, 1976, 1978) and 37 species from the British Isles (Fit-ton et al., 1978; see also Claridge, 1961; Claridge & Dawah, 1994). Some species form distinct galls on the
stem of their hosts [e.g. T. calamagrostidis (von
Schlechtendal)] or flowering parts [e.g. T. hyalipennis
(Walker)], whilst others live singly in or above the
nodes of flowering stems [e.g. T. longicornis (Walker)],
with no real evidence of a galling habit (Claridge, 1961). Moreover, in some species the galls include a
single chamber occupied by one larva [e.g. T.
brevicor-nis (Walker)], whereas in others they include a
sequence of several chambers each occupied by a single
larva (e.g. T. calamagrostidis). Tetramesa are
extremely host-specific and previous studies have shown that they normally attack plant hosts of only one genus (Phillips, 1936; Claridge, 1961), although
Dawah (1987) found T. eximia (Giraud) to attack hosts
of two closely related genera, Calamagrostis epigejos
(L.) Roth. and Ammophila arenaria (L.) Link.
Because some gall-making Tetramesa spp., such as T.
tritici (Fitch), reduce the productivity of the flowering head and seed weight (Claridge, 1961; Spears, 1978), they are sporadic serious pests of cereals and grasses in various countries around the world, especially North America, where they are known as jointworms or strawworms (Phillips, 1927; Spears, 1978; Spears and Barr, 1985). They are not however, considered especially important in the UK (Claridge, 1961; see also http://www.nhm.ac.uk/entomology/chalcidoids/ eurytomidae.html). Even so, and because of their gen-eral economic importance globally, they have been intensively studied in terms of their biology, ecology and taxonomy. Taxonomic difficulties as mentioned by Henneicke, Dawah & Jervis (1992), based on the extremely uniform morphology of adult wasps, has stimulated taxonomists to look for other discriminat-ing criteria. These include host plant preference, mate choice and mode of larval life as well electrophoretic banding profiles to assess the status of very closely related species (Dawah, 1987; Claridge & Dawah, 1994). An example of the problems encountered within the
genus Tetramesa is well illustrated by T. hyalipennis.
Hedicke (1920) morphologically separated T.
hya-lipennis emerging from Elymus (=Agropyron) repens (L.) Gould, Madrono and that emerging from E. farctus (Viv.) Runemark ex Melderis (which he
mis-identified as A. arenaria), on the grounds of an
appar-ent differappar-ent host-plant preference, and gave them subspecific status. Bailey (1967) supported Hedicke’s subspecific separation of the two populations based on experiments on their host-plant specificity, differences in shape, size, egg production and sex ratios. Even so, Dawah (1987) found no differences between
T. hyalipennis reared from E. repens and those reared
from E. farctus using enzyme electrophoresis, host
preferences and mate choice experiments. He
sug-gested that T. hyalipennis reared from E. repens and
E. farctus should be considered a single oligophagous species. Clearly, there are contradictory views on the
taxonomic status of Tetramesa reared from E. repens
and E. farctus.
The aim of this study was to explore further the tax-onomic affinities of closely related, morphologically
similar Tetramesa species living sympatrically in
Britain using electrophoretic approaches: protein (allozyme markers) and DNA [random amplified poly-morphic DNA markers amplified using the polymerase chain reaction (RAPD-PCR markers)]. The insects studied included the species
com-plex T. calamagrostidis, T. longicornis, T. petiolata
(Walker) and T. hyalipennis s.l. found on different
grass hosts [e.g. T. calamagrostidis reared from
C. epigejos, T. longicornis from Phalaris arundinacea L., T. petiolata from Deschampsia caespitosa (L.)
Beauv. and T. hyalipennis from two closely related
grass species, E. repens and E. farctus]. By so doing, it
was hoped to demonstrate that even species that may in effect be cryptic sibling species, differentiable only as a result of larval host-feeding preferences, could be taxonomically discriminated using genetic markers. We also considered that these forms could have arisen originally by a process of sympatric speciation.
MATERIAL AND METHODS
GRASSES
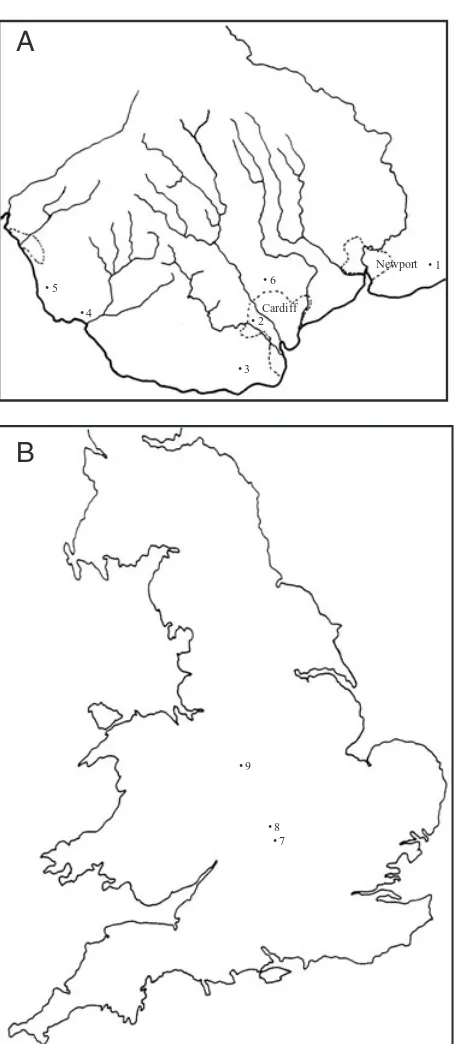
Grasses were collected in the autumns and late win-ters of 1997–2000 from localities in South Wales and England (Fig. 1). Sites were identified according to their county (Local Government Act 1972) and National Grid Reference (NGR). (See Al-Barrack, 2001, for a description of each site, including floral composition): 1. Magor (Monmouth County Borough Council; NGR: ST 425 865); 2. Fairwater (City and County of Cardiff; NGR: ST 133 788); 3. Cosmeston lakes country park (Vale of Glamorgan; NGR: ST 174 613); 4. Merthyr Mawr sand dunes (Bridgend
County Borough Council; NGR: SS 860 770); 5.
Kenfig Dunes (Bridgend County Borough Council; NGR: ST 794 816); 6. Caerphilly (Caerphilly County Borough Council; NGR: ST 156 852); 7. Hell Coppice
(Oxfordshire; NGR: SP 608 104); 8. Oddington
(Oxfordshire; NGR: SP 555 145); 9. Wren’s Nest Hill (Dudley, West Midlands; SO 938 919).
INSECTS
For both enzyme and RAPD-PCR studies, about 30 female individuals of each species were tested
MOLECULAR EVIDENCE FOR SYMPATRIC EVOLUTION IN BRITISH TETRAMESA
511
phoretically. Tetramesa sp. were dissected as larvae
from their respective grass hosts and reared as described in detail by Graham & Claridge (1965). All adults were kept outdoors for 10 days to ensure the complete hardening of the cuticle and attainment of
adult colour and then stored at -80 ∞C prior to
elec-trophoretic testing. Due to time constraints, no genetic crosses were performed in this study to verify the enzyme and RAPD bands observed.
CHEMICALS/BIOCHEMICALS
Chemicals and other reagents used were of high purity grades and purchased from BDH and Sigma
(Poole, Dorset) with the exception of Taq polymerase
and preprepared PCR reaction buffer and MgCl2
solu-tions, bought from Bioline (Humber Road, London). All solutions were made up in de-ionized water, the pH being adjusted as necessary using HCl or NaOH.
ENZYMEELECTROPHORESIS
i) Sample preparation
Specimens were homogenized individually in 50 mL
ice-cold homogenizing buffer (Loxdale, Castañera &
Brookes, 1983): 15% (w/v) sucrose, 50 mM Tris-HCl,
pH 7.1 in 0.5% (v/v), Triton X-100). For electrophore-sis, we used the cellulose acetate electrophoresis sys-tem, including horizontal tank, applicator, applicator base plate and cellulose acetate plates, supplied by Helena Laboratories, Beaumont, Texas, USA (see Wynne, Loxdale & Brookes, 1992 for details, including the many advantages of using this particular system for enzyme electrophoresis). All practical work was performed at Rothamsted Research, Harpenden, UK. Multiple aliquots of cryogenically preserved homoge-nates suitable for enzyme electrophoresis were
pre-pared and stored long-term in liquid N2 as described
by Wynne & Brookes (1992). For enzymes with high activity, such as phosphoglucose isomerase (PGI) (EC
5.3.1.9), only one application (0.25 mL) was required;
with other enzymes, several applications were needed to achieve reasonable staining. Electrophoresis was performed at a constant voltage (200 V) for 30 min. Due to the invariance of the enzymes tested from T. hyalipennis reared from E. farctus (see Results), specimens of this species were always run on lanes 9 and 10 as mobility reference standards.
ii) Running and staining
The recipes used for the 19 enzymes tested (see below and Al-Barrak, 2001 for other details) were taken mainly from Richardson, Baverstock & Adams (1986), Wynne et al. (1992), whilst in the case of esterases, we
used 20 mg Fast Blue RR salt, 2 mL 0.5 M Tris/HCl,
pH 7.1, 8 mL H20; filter and to 2 mL of this, add
Figure 1. A, collecting sites for Tetramesa in South Wales.
1 = Magor; 2 = Fairwater; 3 = Cosmeston lakes country
park; 4 = Merthyr Mawr dunes; 5 = Kenfig Dunes; 6 =
Cae-rphilly. B, Collecting sites for Tetramesa in England. 7 =
Hell Coppice (Oxfordshire); 8 = Oddington (Oxfordshire);
9 = Wren’s Nest Hill, Dudley, West Midlands.
• 1 Newport
• 2
• 3 • 4
• 5 • 6
Cardiff
• 7 • 8 • 9
A
B
200 mL 1% (w/v) a- or b-naphthyl acetate dissolved in 50% (v/v) methanol-water. Plates were run using two
electrophoretic running buffers: (1) ‘TC buffer’, 50 mM
Tris-citrate, pH 7.8, or (2) ‘TG buffer’, 25 mM
Tris-gly-cine, pH 8.5. Usually the TC buffer was used, but occa-sionally both buffers were employed in different runs, as specified in the text and figures.
The enzymes tested were soluble proteins known to show good staining and resolution and often polymor-phisms (electromorph mobility) in studies of other small insects: aconitate hydratase (ACON, EC 4.2.1.3); acid phosphatase (ACP, EC 3.1.3.2); aldolase (ALD, EC 4.1.2.13); aldehyde oxidase (AO, EC 1.2.3.1);
a-esterase (a-EST, EC 3.1.1); b-esterase (b-EST, EC
3.1.1); glucose-6-phosphate dehydrogenase (G-6-PD,
EC 1.1.1.49); glycerol-3-phosphate dehydrogenase (a
-GPD, EC 1.1.1.8); b-hydroxybutyrate dehydrogenase
(HBDH, EC 1.1.1.30); hexokinase (HK, EC 2.7.1.1); isocitrate dehydrogenase (IDH, EC 1.1.1.42); lactic dehydrogenase (LDH, EC1.1.1.27); malate dehydroge-nase (MDH, EC 1.1.1.37); malic enzyme (ME, EC 1.1.1.4); mannose-phosphate isomerase (MPI, EC 5.3.1.8); PGI; 6-phosphogluconate dehydrogenase (6PGD, EC 1.1.1.44); phosphoglucomutase (PGM, EC 2.7.5.1); and L-sorbitol dehydrogenase (SORDH, EC 1.1.1.14).
Staining was performed as described in Wynne et al. (1992): 2 mL staining reaction mixture and 2 mL hot
agar solution at ~60 ∞C were mixed and then poured
immediately onto the gel in a single action. The cellu-lose acetate plate was quickly tilted to produce a uni-form thin covering of the mixture. This was then left to set for a few minutes, after which the plates were left in the dark [stains containing phenazine methosul-phate (PMS) and methyl-thiozyl blue (MTT) only], until the bands appeared (usually within a few min-utes, but with esterase, half an hour). Following the appearance of bands, plates were fixed using 7% (v/v) glacial acetic acid. The stain buffer in all recipes was
0.1 M Tris-HCl, pH 8.0. The concentrations of stock
solutions were as follows: NADP/NAD = 20 mg/mL;
1.0 M MgCl2= 95 mg/mL; 0.2 M MgCl2= 19 mg/mL;
PMS = 2 mg/mL; MTT = 6 mg/mL.
iii) Interpretation of enzyme electrophoretic data The criteria we used for assessing variation between Tetramesa species were: (1) number, (2) position and (3) density of bands on the gel. These provided an approximate estimate of the relative amount of pro-tein in each sample along with the comparative enzyme mobilities for each species on a number of gels. There are two methods of analysing phenotypic and genotypic electrophoretic data. The phenotypic method was used, i.e. we compared gross phenotype profiles rather than scoring allele and genotype
fre-quencies directly following gel running. This method involved measuring the relative mobility (Rm) of the bands in millimetres from the sample origin. Consid-ering the objective of this study, that is, the investiga-tion of taxonomic differences between Tetramesa species, the phenotypic approach was found to be suf-ficient to answer the questions raised from the objec-tives (see also Statistical analysis).
RAPD-PCR
i) DNA extraction and purification
Adult wasps only were used for DNA extraction. Sam-ples were kept on ice in 0.5 mL-Eppendorf tubes
con-taining 297 mL TNES buffer (50 mM Tris-HCl, pH 7.5;
100 mM NaCl; 2 mM EDTA; 1 mM sodium
orthovana-date; 1% (v/v) ‘Nonidet P40’). Proteinase K (3.0 mL)
was than added to each sample followed by homoge-nization using a Miscraft drill for a few seconds. The tubes were incubated in a thermocycler (Hybaid) for
3–18 h or overnight at 37 ∞C. 85 mL 5.0 M NaCl was
added and shaken using a vortex machine (Auto vor-tex, SAS Stuart Scientific). Samples were then centri-fuged for 5 min at 14 000 r.p.m. The supernatant was decanted into a 1.5-mL clean Eppendorf tube using a micropipette, care being taken to prevent the tip of the micropipette from touching the pellet. The pellet was suspended in absolute alcohol previously cooled to
-20 ∞C for 1 h. The mixture was then shaken for 2 min
and the tubes left to warm to room temperature. They were centrifuged for 20 min at 14 000 r.p.m. to detect the presence of DNA in the tube. The supernatant and DNA were carefully separated, and the DNA was
resuspended in 70% ethanol at -20 ∞C and centrifuged
for a further 10 min at 14 000 r.p.m. The ethanol was then removed with a micropipette, and a tissue wick was used to carefully absorb the remainder. Tubes were left to dry completely as the ethanol evaporated.
Lastly, the DNA was resuspended with 20–50 mL
water followed by a short centrifugation, whereafter
the tubes were put in the fridge at ~4 ∞C overnight.
They were shaken vigorously before use. To check the DNA concentration, three 0.5-mL Eppendorf tubes of
different serial DNA concentrations (¥ 10, ¥ 100
and ¥ 1000 dilution) were prepared and the optimal
DNA concentration was selected in terms of product intensity at a wavelength of 260 nm (see http:// www.mcrc.com/quantifyingDNA.htm).
ii) Preparation of the agarose gel and gel loading
We added 2 g agarose to 200 mL 0.5 ¥ TBE (45 mM
Tris-borate: 1 mM EDTA buffer, pH 8.0) in an
Erlen-mayer flask, and heated it in a microwave oven for 3 min until it was completely dissolved and clear. It
MOLECULAR EVIDENCE FOR SYMPATRIC EVOLUTION IN BRITISH TETRAMESA
513
was then left to cool to 60 ∞C. 2 mL ethidium
bro-mide was then added, the mixture shaken and the gel slowly poured into the electrophoresis tank. The open side of the tank was closed using sticky tape, care being taken to remove the bubbles in the gel mixture. Toothed sample combs were inserted at a distance of 1 cm from the edge and in the middle of the gel, which was then left for 1–2 h to set. The combs were then removed and the gel tray with gel placed in the electrophoresis tank and submerged in
0.5 ¥ TBE buffer (4–5 mm). 2 mL ethidium bromide
was included in the buffer at the anodal end of the tank.
For sample preparation, samples (10 mL PCR
prod-uct) were mixed with 2 mL gel loading buffer (0.25%
(w/v) bromophenol blue, 0.25% xylene cyanol FF, 30% glycerol in water) using a micropipette (one tip per sample) in slight depressions made in Parafilm placed over an ELISA plate. Samples were then loaded in each gel well using the same micropipette tip previ-ously used for mixing.
iii) Primers and PCR reaction mix
Arbitrary RAPD primers (10-mers) were purchased from Operon Technologies, Inc. (Alameda, CA 94501, USA). On arrival, they were resuspended in water
according to the product instructions (50 ng mL-1). The
PCR reaction buffer for one reaction contained:
19.375 mL H2O; 2.5 mL 10 ¥ NH4 reaction buffer;
0.75 mL MgCl2 (50 mM); 1.00 mL primer (50 ng mL-1);
0.25 mL dNTP mix (20 mM); 0.125 mL Taq polymerase
(500 U pack); 1.00 mL template DNA = 25 mL total per
tube. For each sample, the DNA concentration was cal-culated. On addition of the primer and Taq to the tube, it was thoroughly shaken. Samples were always kept on ice.
A drop of mineral oil was layered over each sample to prevent evaporation. All samples were then trans-ferred to the thermal cycler and the appropriate pro-gramme selected. PCR cycle conditions used were as
follows: 32 cycles at 92, 35 and 72 ∞C each of 1 min
duration, except for the first denaturing step of the first cycle which was 2 min and the extension step of the last cycle which was 5 min. At the end of the pro-gram, samples were run on a gel or transferred to a refrigerator to be tested later. A 123-bp DNA ladder was used in all electrophoretic runs as a molecular size marker (Gibcorbal, USA, lot no. KK9706). The
ladder was diluted as follows: 25 mL ladder, 175 mL
H2O and 50 mL gel loading buffer. Gels were run at a
constant voltage of 80–100 V, for 3–3.5 h, whereafter the gel tray was removed and the gel visualized and then photographed on a UV trans-illuminator. Fifty-five primers were screened in total (Appendix; see below) and the banding patterns evaluated according
to Puterka et al. (1993). The dominant RAPD bands produced (Loxdale & Lushai, 1998) were arbitrarily ascribed to particular loci and the presence or absence of amplification products recorded in a matrix of 1 s or 0 s.
STATISTICALANALYSIS
Enzyme banding patterns (‘phenograms’) were com-pared visually. ANOVA was performed on the Rms for each ‘useful’ enzyme band identified per species, although a cladogram of genetic distances was not produced because of the difficulty in ascribing enzyme bands of complex phenotypes to particular genetic loci.
For RAPD analysis, primer sequences and number of bands scored and their respective degree of poly-morphism are listed in the Appendix. Only primers that gave scorable bands (diagnostic or shared) were analysed. Evaluation of the primers was based not only on the degree of separation or amplification of bands, but also on differences in molecular sizes (bp) of the amplification products from the Tetramesa species studied. The greater the observed differences in band size, the more polymorphism was seen to be diagnostic between species.
The RAPD fingerprints generated for the Tetramesa species were analysed by RAPDPLOT 2.4 (Black, 1996) to generate Euclidean genetic distances. This is probably the most commonly chosen type of distance. It is simply the geometric distance in multidimensional space and is computed as:
distance(x,y) = (SI (xi- yi)2)1/2. Thereafter cluster and
multivariate analyses – multidimensional scaling (MDS) and factor analysis – were performed to verify that the interpretation of the data did not depend on the type of analysis used. The analysis was performed using the Statistica 4.0 program from Statsoft Inc., USA and run in an IBM ‘Windows 95’ environment. MDS analysis, which can be considered as an alterna-tive to factor (discriminant) analysis, uses a function minimization algorithm that evaluates different con-figurations with the goal of maximizing the goodness-of-fit. A coefficient called ‘Stress’ is used to determine the reliability of the MDS plot (Kruskal, 1964a, b). The most common measure that is used to evaluate how well (or poorly) a particular configuration reproduces the observed distance matrix is the Stress measure. Thus, the smaller the Stress value, the better the fit of the reproduced distance matrix to the observed dis-tance matrix. Finally, we used factor analysis as a classification method, performed using the RAPD data (presence/absence) with the following conditions: Rotation: unrotated; Extraction: principal components.
RESULTS
Of the 19 enzyme systems tested, only nine showed distinct, well-resolved and repeatable
elec-trophoretic banding patterns: a-EST, b-EST,
G-6-PDH, HK, IDH, ME, MDH, PGI and PGM. A summary of the electrophoretic results is shown in Table 1, whilst the electrophoretic banding pat-terns for two enzymes, IDH and PGI are shown in Figure 2. The ANOVA of the relative mobili-ties for each of the enzymes tested (not shown) revealed that all the chosen enzymes studied dis-played significant differences between species, with
the exception of MDH, which was monomorphic (see below).
ENZYMES
Below are descriptions of phenotypic profiles for spe-cies enzyme bands tested [band relative mobility val-ues (mm) are given in parentheses].
EST
No heterozygotes were observed in any of the samples analysed. Two distinctive bands with different
mobil-ities were always revealed. Analysis of a- and b
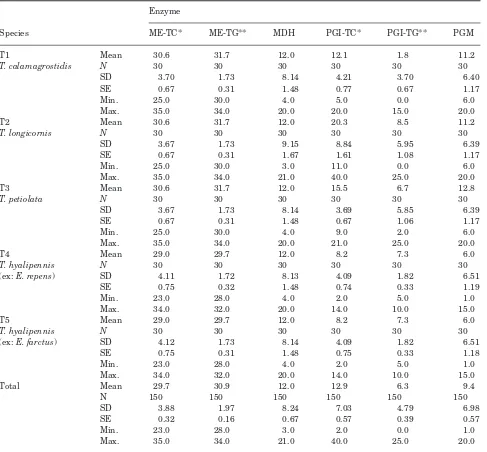
-Table 1. Summary of enzyme electrophoretic results for Tetramesa sp. (mean distances travelled in mm). *TC, Tris-citrate
pH 7.8; **TG, Tris-glycine pH 8.5; N, sample size; SD, standard deviation of mean; SE, standard error of mean
Species
Enzyme
a-EST b-EST G-6-PD HK IDH-TC* IDH-TG**
T1 Mean 30.5 36.5 8.7 15.8 18.7 9.8
T. calamagrostidis N 30 30 30 30 30 30
SD 4.57 5.59 2.17 3.64 4.43 6.59
SE 0.84 1.00 0.40 0.66 0.81 1.21
Min. 26.0 31.0 6.0 8.0 13.0 4.0
Max. 35.0 42.0 12.0 19.0 25.0 28.0
T2 Mean 25.5 32.5 8.70 22.5 24.7 17.5
T. longicornis N 30 30 30 30 30 30
SD 5.59 4.58 2.17 3.62 4.91 7.07
SE 1.02 0.84 0.40 0.66 0.89 1.29
Min. 20.0 28.0 6.0 15.0 18.0 10.0
Max. 31.0 37.0 12.0 26.0 32.0 34.0
T3 Mean 31.0 40.0 8.70 23.8 17.8 13.5
T. petiolata N 30 30 30 30 30 30
SD 6.10 5.08 2.17 1.23 5.10 4.89
SE 1.11 0.93 0.40 0.22 0.93 0.89
Min. 25.0 35.0 6.0 22.0 8.0 9.0
Max. 37.0 45.0 12.0 26.0 25.0 25.0
T4 Mean 19.5 36.0 3.3 7.0 18.7 13.9
T. hyalipennis N 30 30 30 30 30 30
(ex: E. repens) SD 3.56 2.03 1.40 0.83 5.11 3.22
SE 0.65 0.37 0.25 0.15 0.94 0.59
Min. 16.0 34.0 2.0 6.0 9.0 10.0
Max. 23.0 38.0 6.0 8.0 26.5 22.0
T5 Mean 25.0 38.0 3.30 7.0 18.7 13.9
T. hyalipennis N 30 30 30 30 30 30
(ex: E. farctus) SD 9.15 4.07 1.40 0.83 5.11 3.22
SE 1.67 0.74 0.25 0.15 0.93 0.59
Min. 16.0 34.0 2.0 6.0 9.0 10.0
Max. 34.0 42.0 6.0 8.0 26.5 22.0
Total Mean 26.3 36.6 6.5 15.2 19.7 13.7
N 150 150 150 150 150 150
SD 7.35 5.04 3.22 7.65 5.50 5.73
SE 0.60 0.41 0.26 0.62 0.45 0.47
Min. 16.0 28.0 2.0 6.0 8.0 4.0
Max. 37.0 45.0 12.0 26.0 32.0 34.0
MOLECULAR EVIDENCE FOR SYMPATRIC EVOLUTION IN BRITISH TETRAMESA
515
esterases from each species studied allowed differen-tiation of the populations studied.
a-EST
The highest Rm was found in T. petiolata (31) followed by T. calamagrostidis (30). The lowest value was found in T. hyalipennis (ex: E. repens) (19.5) (Table 1). Note
that T. hyalipennis (ex: E. farctus) always showed a
higher level of enzyme activity than did T. hyalipennis (ex: E. repens).
b-EST
The highest Rm was found in T. petiolata (40) followed by T. hyalipennis (ex: E. farctus) (38),
T. calamagrostidis and T. hyalipennis (ex: E. repens) (36), and the lowest value in T. longicornis (32.5)
(Table 1). As with a-EST, T. hyalipennis (ex:
E. farctus) always showed higher levels of enzyme
activity than did T. hyalipennis (ex: E. repens) (not
shown).
G-6-PDH
G-6-PDH occurred as a single invariant (monomor-phic) band in each of the species studied, as found earlier by Dawah (1987). T. calamagrostidis, T. longicornis and T. petiolata had the same Rm of 8.7,
while both T. hyalipennis (ex: E. repens and ex:
E. farctus) had the same Rm of ~3.0.
Species
Enzyme
ME-TC* ME-TG** MDH PGI-TC* PGI-TG** PGM
T1 Mean 30.6 31.7 12.0 12.1 1.8 11.2
T. calamagrostidis N 30 30 30 30 30 30
SD 3.70 1.73 8.14 4.21 3.70 6.40
SE 0.67 0.31 1.48 0.77 0.67 1.17
Min. 25.0 30.0 4.0 5.0 0.0 6.0
Max. 35.0 34.0 20.0 20.0 15.0 20.0
T2 Mean 30.6 31.7 12.0 20.3 8.5 11.2
T. longicornis N 30 30 30 30 30 30
SD 3.67 1.73 9.15 8.84 5.95 6.39
SE 0.67 0.31 1.67 1.61 1.08 1.17
Min. 25.0 30.0 3.0 11.0 0.0 6.0
Max. 35.0 34.0 21.0 40.0 25.0 20.0
T3 Mean 30.6 31.7 12.0 15.5 6.7 12.8
T. petiolata N 30 30 30 30 30 30
SD 3.67 1.73 8.14 3.69 5.85 6.39
SE 0.67 0.31 1.48 0.67 1.06 1.17
Min. 25.0 30.0 4.0 9.0 2.0 6.0
Max. 35.0 34.0 20.0 21.0 25.0 20.0
T4 Mean 29.0 29.7 12.0 8.2 7.3 6.0
T. hyalipennis N 30 30 30 30 30 30
(ex: E. repens) SD 4.11 1.72 8.13 4.09 1.82 6.51
SE 0.75 0.32 1.48 0.74 0.33 1.19
Min. 23.0 28.0 4.0 2.0 5.0 1.0
Max. 34.0 32.0 20.0 14.0 10.0 15.0
T5 Mean 29.0 29.7 12.0 8.2 7.3 6.0
T. hyalipennis N 30 30 30 30 30 30
(ex: E. farctus) SD 4.12 1.73 8.14 4.09 1.82 6.51
SE 0.75 0.31 1.48 0.75 0.33 1.18
Min. 23.0 28.0 4.0 2.0 5.0 1.0
Max. 34.0 32.0 20.0 14.0 10.0 15.0
Total Mean 29.7 30.9 12.0 12.9 6.3 9.4
N 150 150 150 150 150 150
SD 3.88 1.97 8.24 7.03 4.79 6.98
SE 0.32 0.16 0.67 0.57 0.39 0.57
Min. 23.0 28.0 3.0 2.0 0.0 1.0
Max. 35.0 34.0 21.0 40.0 25.0 20.0
Table 1. Continued
HK
The hexokinase pattern was polymorphic in the Tet-ramesa species studied. In T. hyalipennis (ex: E. repens and ex: E. farctus), a band with the same Rm value of 7.0 was resolved, which differed from the
bands of T. calamagrostidis, T. longicornis and
T. petiolata (15.8, 22.5 and 23.8, respectively). Dou-blets were seen in lanes 3, 4, 7 and 8, which could have been monomeric heterozygotes (Richardson et al., 1986).
IDH (Fig. 2A)
IDH produced a single monomorphic band in each of the species studied, as found earlier by Dawah (1987). For this enzyme, two buffers were used – TC and TG. The highest Rm value was found in T. longicornis (24.7 TC) and (17.5 TG) followed by T. hyalipennis (ex: E. repens and ex: E. farctus) (18.7 TC and 13.9 TG, respectively) and T. calamagrostidis (18.7 TC, 9.8 TG),
with T. petiolata having the lowest value (17.8 TC,
13.5 TG).
ME (NADP+ specific) (Richardson et al., 1986)
ME showed as a single monomorphic band in all the species tested. T. calamagrostidis, T. longicornis and T. petiolata each had the same Rm with buffers TC and TG, of 30.6 and 31.7, respectively. T. hyalipennis ex: E. repens and ex: E. farctus had the same value with each buffer of 29.0 and 29.7, respectively.
MDH (NAD+ specific) (Richardson et al., 1986).
One invariant band was found between the species tested.
PGI (Fig. 2B)
For this enzyme, both TC and TG buffers were used. T. calamagrostidis and T. petiolata had Rms of 12.1 (TC) and 15.5 (TG), respectively. T. hyalipennis (ex: E. repens and ex: E. farctus) had one band, but its mobility was in the opposite direction of migration, i.e. cathodally. In contrast, T. longicornis had three bands, which differed radically from the banding profiles of other species and were possibly dimeric heterozygotes (Richardson et al., 1986).
PGM
PGM was monomorphic in all the species studied. T. petiolata showed the highest Rm (12.8) followed by T. calamagrostidis and T. longicornis (11.2), with T. hyalipennis (ex: E. repens and ex: E. farctus) having the same value of 6.0.
In summary, nine enzymes stained well and pro-vided diagnostic bands and differences in their
rela-tive mobilities (Table 1), allowing separation of
T. calamagrostidis, T. longicornis, T. petiolata and T. hyalipennis (ex: E. repens and ex: E. farctus) com-bined. No electrophoretic mobility differences were found between the two forms of T. hyalipennis,
although staining intensity differences in a- and b
-EST were noted. Adaptation to environmental differ-ences could be responsible for these differdiffer-ences. Thus the taxonomic status of T. hyalipennis remained unclear using enzyme markers alone, as previously noted by Dawah (1987).
RAPDS
The amplified products of Tetramesa species T. calamagrostidis, T. longicornis, T. petiolata and T. hyalipennis (ex: E. repens and ex: E. farctus), obtained using a range of arbitrary 10-mer primers, were screened electophoretically. The appendix shows the different RAPD-PCR profiles obtained with each primer.
Of the 55 primers screened, 18 failed to give any products for reliable interpretation, whilst 37 primers gave clear and consistent differences between
Figure 2. Electrophoretic banding patterns for (A) isoci-trate dehydrogenase, IDH, and (B) phosphoglucose
isomerase, PGI. Lanes 1,2, T. calamagrostidis; 3,4,
T. longicornis; 5,6, T. petiolata; 7,8, T. hyalipennis from E. repens; 9,10, T. hyalipennis from E. farctus; 11, control. The arrowhead shows the starting point. – indicates the
cathode and + the anode.
A
1 2 3 4 5 6 7 8 9 10 11
B
1 2 3 4 5 6 7 8 9 10 11
_
+
_
+
MOLECULAR EVIDENCE FOR SYMPATRIC EVOLUTION IN BRITISH TETRAMESA
517
T. calamagrostidis, T. longicornis, T. petiolata and T. hyalipennis in terms of number of polymorphic bands. However, of these 37 only eight (OPA5, UB2, OPG19, OPF3, OPF4, OPF7, OPM1, OPM15) gave variable and inconsistent products for the host-asso-ciated population of T. hyalipennis (ex: E. repens and ex E. farctus). Therefore, the differences between the two forms of T. hyalipennis were not diagnostic using these particular primers. Even so, the statistical anal-ysis of host-associated populations of T. hyalipennis
(ex: E. repens and ex: E. farctus) showed slight
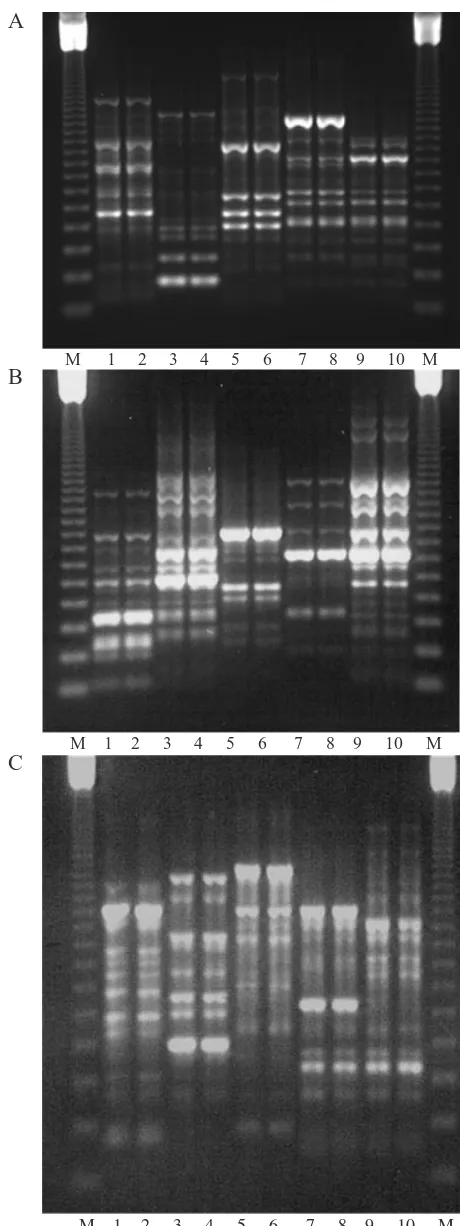
sepa-ration (see below) and primers OPA5 (not shown) and OPG19 (Fig. 3A) were the most suitable generally for use in taxonomic discrimination of Tetramesa species. Examination of intraspecific variation revealed that out of eight of the primers tested (OPA2, OPA5, UB1, OPG19, OPF4, OPM7, OPM15, OPM19), only two showed sufficient variation for useful diagnostic bands: OPG19 and OPF4. The remainder gave mono-morphic RAPD banding profiles per species. OPG19 showed variation within T. longicornis (8 bands/14 individuals) and T. hyalipennis (ex: E. repens and ex: E. farctus) 3 bands/18 individuals). With OPF4, intraspecific variation was found in individuals of T. calamagrostidis (1 band/20 individuals), T. petiolata (2 bands/20 individuals) and T. hya-lipennis (ex: E. repens and ex: E. farctus; both with 3 bands/20 individuals), yet the primer was broadly diagnostic (Fig. 3B). With primer OPM15, all the spe-cies could be distinguished, including the two host-adapted forms of T. hyalipennis (Fig. 3C), albeit not always consistently, as mentioned above. OPA2 could discriminate between the four main species investi-gated, but not the host-adapted forms of T. hyalipennis. Within species, it revealed no intraspe-cific differences.
Table 2 shows the genetic distances calculated
between ‘species’ pairs from the RAPD data obtained, whilst Figure 4 represents a cladogram for the Tet-ramesa species studied along with two multivariate representations – MDS of Euclidean distances and factor analysis. Both the cladogram and MDS plot were constructed using the genetic distance data (see also Al-Barrak, 2001). Clearly, the cladogram shows T. longicornis to be the species most basal and most related to T. hyalipennis s.l., whilst T. calamagrostidis and T. petiolata are more distantly related to these two species, yet at the same time most closely related to each other. The positioning of the node shows the
M 1 2 3 4 5 6 7 8 9 10 M
M 1 2 3 4 5 6 7 8 9 10 M
M 1 2 3 4 5 6 7 8 9 10 M
A
C
B
Figure 3. Electrophoretic banding patterns produced by primers OPG19 (A), OPF4 (B) and OPM15 (C). Lanes 1,2, T. calamagrostidis; 3,4, T. longicornis; 5,6, T. petiolata; 7,8,
T. hyalipennis (ex: E. repens); 9,10, T. hyalipennis (ex:
E. farctus); M, 123-bp molecular size ladder. The anode is
at the bottom of the gel.
two forms of T. hyalipennis s.l. to be most closely related of any of the samples investigated, and as such, these may have diverged genetically the most recently. MDS of Euclidean distances and factor anal-ysis broadly confirmed these trends, especially the lat-ter analysis (Fig. 4C).
DISCUSSION
For this study, enzyme electrophoresis was first used, followed by analysis of the same species using RAPD-PCR markers. RAPDs are particularly suitable for studies of small to minute organisms such as insects, from which only nanogram quantities of DNA can be extracted (Black et al., 1992; Black, 1993). They also often show enhanced sensitivity in taxonomic discrim-inations compared with enzymes. Because of the advantages and sensitivity of the RAPD-PCR tech-nique, it appeared to be the best marker system for our investigation, especially to clarify the status of T. hyalipennis (ex: E. repens and E. farctus) in relation to the other species tested. Both kinds of marker have already proved to be very useful in the recognition of very closely related species populations (see Loxdale, 1994 and Loxdale & Lushai, 1998, 2001 for over-views), including species belonging to the order Hymenoptera (e.g. Halliday, 1981; Hung, 1982; Castañera, Loxdale & Nowak, 1983; Pungerl, 1986; Dawah, 1987; Hung and Schaefer, 1990; Walton, Loxdale & Allen-Williams, 1990; Vanlerberghe-Masutti, 1994), especially species complexes and species boundaries, of which the group has many examples.
In addition to taxonomic discrimination, another important aspect of this kind of study performed in the absence of clear morphological criteria is what defines a ‘true species’ in terms of molecular genetic differ-ences (see for example, Kunz, 2002), along with con-sideration of the ecological forces at work allowing divergence of electrophoretically distinguishable forms (Claridge, Dawah & Wilson, 1997a). By reveal-ing such forms, rangreveal-ing along a scale from ethospecies
Table 2. Genetic distances between Tetramesa species (used for the cladogram and multidimensional scaling plot; Fig. 4A, B)
T. calamagrostidis T. longicornis T. petiolata T. hyalipennis 1 T. hyalipennis 2
T. calamagrostidis 0 17.46 16.40 18.44 16.82
T. longicornis – 0 18.87 19.88 17.78
T. petiolata – – 0 19.62 18.06
T. hyalipennis 1 – – – 0 10.34
T. hyalipennis 2 – – – – 0
T. hyalipennis 1 - T. hyalipennis (ex: E. repens). T. hyalipennis 2 - T. hyalipennis (ex: E. farctus).
Figure 4. A, cladogram for five species of the genus
Tet-ramesa. Distance measure: Euclidean; Linkage rule: Single
(nearest neighbours). B, multidimensional scaling of
Euclidean distances (stress = 0.000). C, factor analysis of
RAPD data (Rotation: Unrotated; Extraction: Principal components).
Linkage distance
9 10 11 12 13 14 15 16 17 18
9 10 11 12 13 14 15 16 17 18
T. longicornis T. hyalipennis2 T. hyalipennis1 T. petiolata T. calamagrostidis
Dimension 1
Dimension 2
T. calamagrostidis
T. longicornis T. petiolata
T. hyalipennis1 T. hyalipennis2
-1.4 -1 -0.6 -0.2 0.2 0.6 1 1.4
-1 -0.6 -0.2 0.2 0.6 1.4
Factor 1
Factor 2
T. calamasgrostidis T. longicornis
T. petiolata
T. hyalipennis2
-0.8 -0.6 -0.4 -0.2 0 0.2 0.4 0.6 0.8 1
-0.6 -0.4 -0.2 0 0.2 0.4 0.6 0.8 1.2
T. hyalipennis1
1 1
A
B
C
MOLECULAR EVIDENCE FOR SYMPATRIC EVOLUTION IN BRITISH TETRAMESA
519
to ecotypes, biotypes, races, and cryptic and sibling species, ideas of biodiversity within given ecosystems may need to be revised (see, for example, Eastop, 1973; Avise, 1977; White, 1978; Claridge, Dawah & Wilson, 1997a,b; Thomas & Singer, 1998 for definitions and discussion of these evolved forms). Clearly, in the case of sympatric populations, it is pertinent to determine what barriers exist – ecological, morphological, behav-ioural and genetic – that cause populations to diverge and ultimately, to differentiate and remain differenti-ated. Whilst much debate continues to surround the topic of sympatric speciation, for insects very few doc-umented examples exist, including tephritid fruit
flies, Rhagoletis pomonella (Walsh) (Feder, Berlocher
& Opp, 1998), pea aphids, Acyrthosiphon pisum (Har-ris) (Via, Bouck & Skillman, 2000), hymenopterous
parasitic wasps, Aphidius ervi s.l. (Atanassova et al.,
1998) and tortricid larch budworm moths, Zeiraphera diniana Guenée (Emelianov, Mallet & Baltenweiler, 1995), and even their existence is controversial (see Via, 2001; Berlocher & Feder, 2002). We pose the ques-tion: do Tetramesa sp. offer further examples of sym-patric speciation in insects, specifically the cryptic, host-associated forms of T. hyalipennis? Before dis-cussing this, we briefly mention certain technical aspects relating to the electrophoretic discrimination of parasitic Hymenoptera.
It is often quite difficult to decide whether the enzyme banding patterns observed for parasitic Hymenoptera represent different alleles at one locus or different loci, a situation which cannot be resolved without formal crossing experiments. Additional com-plications in interpreting banding profiles may arise due to such factors as post-transitional modification of the enzymes concerned (Cameron, Powell & Loxdale, 1984). Since the insects used here were not crossed genetically, the banding patterns were recorded and utilized in a purely diagnostic way.
Electrophoresis does not allow discrimination of all variables. Electromorphs of an enzyme gene may, as a result of mutation, have a different amino acid sequence leading to a difference in size and hence elec-trophoretic mobility even though they have the same or similar charge. Alternatively, electromorphs may have a different shape due to an amino acid difference leading to a shape (protein folding) alteration that affects net charge and mobility, even though molecular weight is not significantly changed (see Richardson et al., 1986 for details). Another difficulty with enzyme electrophoresis is that only structural genes coding for soluble proteins can be scored; regulatory genes or those coding for non-soluble proteins may behave dif-ferently and cannot be detected (Loxdale, 1994; Loxdale & Lushai, 1998). The lack of detectable elec-trophoretic differences between the two host forms of T. hyalipennis, as found here and also by Dawah
(1987), could be due to the number of enzymes tested being too few. For example, Singh & Rhomberg (1987) showed that in closely related Drosophila species (D. melanogaster Meigen and D. simulans Sturte-vant), some genetic species discriminations were
pos-sible using < 30 enzyme loci. However, results on a
larger sample of loci from the same species revealed that complete divergence was possible even at a small number of diagnostic enzyme loci (7%) once these had been identified (Singh, 1989). Therefore, more enzyme loci undoubtedly need to be identified and examined before any definite conclusions can be drawn on the status of T. hyalipennis using enzymes.
The use of RAPDs provided a clearer picture of the
taxonomic relationships existing between the
Tet-ramesa species studied. The results were broadly con-sistent with similar inter- and intraspecific variations found in other insects using RAPDs in which differen-tiation of very closely related species or even geo-graphical populations have been clarified, for example: Lepidoptera – Indian meal moth, Plodia interpunctella (Hübner) (Dowdy & McGaughey, 1996), European corn borer, Ostrinia nubilalis (Hübner) (Pornkulwat et al., 1998), gypsy moth, Lymantria dis-par (L.) (Garner & Slavicek, 1996), Hymenoptera – Trichogramma spp. and Anaphes spp. (Landry, Dex-traze & Boivin, 1993; Vanlerberghe-Masutti, 1994); Diptera – Anopheles spp. (Wilkerson et al., 1993; Favia, Dimopoulos & Louis, 1994), sand fly, Lutzomyia migonei Franca (Adamson et al., 1993); Homoptera –
whitefly, Bemisia tabaci (Gennadius) (Gawel &
Bar-tlett, 1993), Russian wheat aphid, Diuraphis noxia (Mordvilko) (Puterka et al., 1993), and the cotton-melon aphid, Aphis gossypii Glover (Hemiptera: Aphi-didae) (Vanlerberghe-Masutti & Chavigny, 1998).
RAPD-PCR successfully discriminated the closely related sibling species of T. calamagrostidis, T. longicornis and T. petiolata (Fig. 4). The within and between species diversity observed may perhaps have occurred during the arrhenotokous parthenogenetic phase of the life cycle of each species (i.e. the produc-tion by unmated female wasps of unfertilized haploid males), as a result of the increased reproductive rate and the potentially enhanced host association in this phase, i.e. selection for host-adapted genotypes (see below). Probably, then, we are witnessing sympatric speciation at a local geographical level (Mopper & Strauss, 1998), which presumably would tend to break down during sexual recombination of the adults, since some species [T. hyalipennes in this study and T. eximia (Dawah, 1987)], do not appear to show behavioural barriers to inbreeding and males mate with females from their own host population as well as with those from the other host population tested (i.e. ex: E. repens or ex: E. farctus and vice versa in the case of T. hyalipennes). In these previous trials, mating
combinations were confirmed as being successful by the presence of sperm in the female spermatheca fol-lowing dissection (see Dawah, 1987 for details). Nev-ertheless, our RAPD results do not provide strong evidence for the specific rank status of ‘sibling species’ for the two T. hyalipennis populations from different hosts. Thus there is no significant discontinuous genetic variation between these populations, neither of which is clearly reproductively isolated in space and time (Fig. 4A). This being so, the results do not over-turn the earlier notion that the two forms represent the same species (s.l., at any rate), as earlier proposed by Claridge (1961) and Dawah (1987). Yet there is clearly some degree of genetic divergence between the forms to the point where discrimination is possible between them.
As mentioned above in reference to the main Tet-ramesa species studied, an explanation for the observed genetic divergence between the two forms of T. hyalipennis is that they represent a single oligoph-agous population, but that the observed differences are the result of differential selection on the two hosts (M. F. Claridge, pers. comm.). However, again, being panmictic, it is then difficult to imagine how evolved host preferences could be maintained. Preference for natal host plant odours and assortative mating due to host-specific sex pheromones may well drive host spe-cialization (Linn et al., 2003; Thomas et al., 2003), but the usual arguments arise as to how this is main-tained in the face of reciprocal gene flow, as with the much studied Rhagoletis pomonella complex. In R. pomonella, according to Feder and coworkers, ‘it is the interaction of host phenology, local ambient tem-perature conditions, and fly development that is responsible for this postzygotic selection’, i.e. host spe-cialization by apple and hawthorn-feeding forms (see Feder et al., 1998 and Berlocher & Feder, 2002 for fur-ther details and arguments concerning R. pomonella, and Thomas et al., 2003 for the mechanisms of
sym-patric speciation in O. nubilalis). In R. pomonella,
recent evidence suggests that chromosomal inversion polymorphisms are involved in the maintenance of sympatric forms on their respective plant host, such that ‘genes affecting diapause traits [that are] involved in host race formation reside within large complexes of rearranged genes’ (Feder et al., 2003a). Feder et al. (2003b) also discuss evidence that allopat-ric speciation events, and involving inversion polymor-phisms affecting key diapause traits and aiding North American flies to adapt to a variety of plants with dif-ferent fruiting times, may have been initially involved in providing the ‘important raw genetic material’ facil-itating adaptive radiation and hosts shifts in this fly. Ortiz-Barrientos et al. (2002), in a recent review, like-wise discuss the genetic mechanisms, including chro-mosomal rearrangements, that may cause speciation
in Drosophila in the face of reciprocal gene flow between natural populations.
Perhaps the chromosomal haplo-diploidy of Hymenoptera in which the male is haploid and bears a single gene at any locus under consideration not only often drives species populations towards homozygosity (because any negative selective trait is more greatly exposed to selection in the haploid condition; Menken, 1991), but it may also reinforce host preference by selection against ‘incompatible’ gene arrangements, for example, those that have not been the product of an adaptive chromosomal inversion to a particular plant host. If this were so, it would be broadly analo-gous to ‘Haldane’s Law’ in which the heterogametic sex is selected against during hybridization of differ-ent species (Stebbins, 1958).
Opponents of the sympatric model of speciation, notably Mayr (1963), insist that species require a high degree of spatial isolation and of host or habitat choice (see Via, 2001). The implications of the existence of sibling species in many taxa currently assigned to nominal species name are enormous (Claridge et al., 1997a). At present, because of the increasing global threat posed by human activity to habitats and asso-ciated wildlife, attempts are underway to map the total biodiversity of the planet (Gaston, 2000; Purvis & Hector, 2000; Dolphin & Quicke, 2001). The inclu-sion of sibling species would greatly increase the num-ber of recognized species by many thousands or even millions (e.g. Lawton et al., 1998). Investigations into cryptic species are vital for pest management strate-gies (integrated pest management, IPM) and conser-vation policies alike. The ability to recognize and identify biological species (Claridge, 2003) with a unique genetic heritage is a fundamental necessity (Lawton et al., 1998; Basset, 2001).
These results emphasize that the application of molecular diagnostic approaches may well lead to a better understanding and greater reliability in evalu-ating the taxonomic status of closely related species of Hymenoptera. This advance would be particularly important for those species (e.g. parasitoids) used as biocontrol agents in IPM programmes to control insect pests. In addition, by confirming empirically, using genetic markers, the existence of some degree of host divergence occurring below the species level, as earlier noted for R. pomonella and aphids of various species (Via, 1999, 2001; Haack et al., 2000; Via et al., 2000; Lushai, Markovitch & Loxdale, 2002), our results fur-ther emphasize the fact that ‘apparent’ species popu-lations occurring in the same geographical area are not necessarily homogeneous genetic entities. Rather, they may consist of numerous levels of evolutionary divergence ranging from geographical populations to truly genetically distinct species (Avise, 1977, 1994, 2000). The morphologically similar, host-adapted
MOLECULAR EVIDENCE FOR SYMPATRIC EVOLUTION IN BRITISH TETRAMESA
521
forms of Tetramesa, especially T. hyalipennis s.l., may indeed be a further example of sympatric speciation ‘in action’ (certainly to the level of host-adapted races or biotypes) and they may represent a suitable group of organisms to rival the aforementioned examples in studies of sympatric speciation in insects. If T. hyalipennis really is undergoing sympatric diver-gence, then it begs the question: what are the mecha-nisms – ecological and genetic – that are reinforcing, maintaining or extending this? Further morphometric and genetic studies using more sophisticated molecu-lar markers such as mitochondrial DNA markers, mic-rosatellites, amplified fragment length polymorphic markers (AFLPs) (e.g. Emelianov, Marec & Mallet, 2004 in the case of the sympatric host races of Z. diniana) and, ultimately, DNA sequencing of mito-chondrial and ribosomal DNA regions, in association with chromosomal and behavioural investigations (e.g. host plant preference, mate-choice experiments, phenological studies, pheromone differentiation and acoustic signals; Claridge, 1991), will doubtless, as with Rhagoletis, further advance our understanding of the ecological and evolutionary processes involved.
ACKNOWLEDGEMENTS
M. Al-Barrak was funded by the Saudi Government. H. D. Loxdale and C. P. Brookes thank the Depart-ment of the EnvironDepart-ment, Food and Rural Affairs (DEFRA), UK, for financial support. We thank Drs Ian Wynne and Kate Llewellyn for technical advice, Prof. Mike Bruford for advice on genetic analysis, Rosy Allcott for originally typing the manuscript, and Prof. Mike Claridge and Dr Ian Denholm for their helpful comments on the manuscript. Rothamsted Research receives grant-aided support from the BBSRC.
REFERENCES
Adamson RE, Ward RD, Feliciangeli MD, Maingon R. 1993. The application of random amplified polymorphic DNA
for sandfly species identification. Medical and Veterinary
Entomology7: 203–207.
Al-Barrak MS. 2001. Morphological and molecular studies on
some species of Tetramesa (Hymenoptera: Eurytomidae)
with a key to the genus Tetramesa and its parasitoids. PhD
Thesis, Cardiff University, UK.
Atanassova P, Brookes CP, Loxdale HD, Powell W. 1998. Electrophoretic study of five aphid parasitoid species of the
genus Aphidius (Hymenoptera: Braconidae), including
evi-dence for reproductively isolated sympatric populations and a cryptic species. Bulletin of Entomological Research88: 3– 13.
Avise JC. 1977. Genetic differentiation during speciation. In:
Ayala FJ, ed. Molecular evolution. Sunderland,
Massachu-setts, USA: Sinauer Associates Inc., 106–122.
Avise JC. 1994. Molecular markers, natural history and
evo-lution. New York: Chapman & Hall.
Avise JC. 2000. Phylogeography: the history and formation of
species. Cambridge, Massachusetts, USA: Harvard
Univer-sity Press.
Bailey R. 1967. Sibling species in the genus Tetramesa Walker
(Hym., Eurytomidae). Entomologist’s Monthly Magazine
103: 45–52.
Basset Y. 2001. Invertebrates in the canopy of tropical rain
forests – How much do we really know? Plant Ecology153:
87–107.
Berlocher SH, Feder JL. 2002. Sympatric speciation in
phy-tophagous insects: Moving beyond controversy? Annual
Review of Entomology47: 773–815.
Black WC(IV), DuTeau NM, Puterka GJ, Nechols JR, Pet-torini JM. 1992. Use of the random amplified polymorphic DNA polymerase chain reaction RAPD-PCR to detect DNA
polymorphisms in aphids (Homoptera: Aphididae). Bulletin
of Entomological Research82: 151–159.
Black WC (IV). 1993. PCR with arbitrary primers: approach with care. Insect Molecular Biology2: 1–6.
Black WC (IV). 1996. RAPDPLOT 2.4. Fort Collins, CO, USA: Department of Microbiology, Colorado State University. Burks BD. 1971. A synopsis of the genera of the family
Eury-tomidae (Hymenoptera, Chalcidoidea). Transactions of the
American Entomological Society97: 1–89.
Burks BD. 1979. Family Eurytomidae. In: Krombein K, Hurd
P, Smith D, Burks B, eds. Catalogue of Hymenoptera in
America north of Mexico, Vol. 1. Washington, D.C., USA:
Smithsonian Institute Press, 835–860.
Cameron PJ, Powell W, Loxdale HD. 1984. Reservoirs for
Aphidius ervi Haliday (Hymenoptera: Aphidiidae), a
polyph-agous parasitoid of cereal aphids (Hemiptera: Aphididae).
Bulletin of Entomological Research74: 647–656.
Castañera P, Loxdale HD, Nowak K. 1983. Electrophoretic study of enzymes from cereal aphid populations: Use of electrophoresis for identifying aphidiid parasitoids
(Hymenoptera) of Sitobion avenae (F.) (Hemiptera:
Aphid-idae). Bulletin of Entomological Research73: 659–665. Claridge MF. 1961. A contribution to the biology and
taxon-omy of some Palaearctic species of Tetramesa Walker =
Isosoma Walker; Harmolita Motsch (Hymenoptera:
Euryto-midae) with particular reference to the British fauna.
Trans-actions of the Royal Entomological Society of London 113:
175–216.
Claridge MF. 1991. Genetic and biological diversity of insect pests and their natural enemies. In: Hawksworth DL, ed. The biodiversity of microorganisms and invertebrates: its role
in sustainable agriculture. Wallingford, UK: CAB
Interna-tional, 183–194.
Claridge MF. 2003. Species acoustic signals and an insect ‘coelacanth.’ Presidential Address to the Royal
Entomologi-cal Society, 12th June 2002. Antenna (Bulletin of the Royal
Entomological Society)27: 304–309.
Claridge MF, Dawah HA. 1994. Assemblages of herbivorous chalcid wasps and their parasitoids associated with grasses – problems of species and specificity. In: Williams MAJ, ed.
Plant galls: organisms, interactions, populations.
ics Association Special Volume no. 49. Oxford, UK: Claren-don Press, 313–329.
Claridge MF, Dawah HA, Wilson MR, eds. 1997a. Species: the units of biodiversity. Systematics Association Special Vol-ume no. 54. London: Chapman & Hall.
Claridge MF, Dawah HA, Wilson MR. 1997b. Species in insect herbivores and parasitoids – sibling species, host races and biotypes. In: Claridge MF, Dawah HA, Wilson MR, eds.
Species: the units of biodiversity. Systematics Association
Special Volume no. 54. London: Chapman & Hall, 247–272. Dawah HA. 1987. Biological species problems in some
Tet-ramesa (Hymenoptera: Eurytomidae). Biological Journal of
the Linnean Society32: 237–245.
Dolphin K, Quicke DLJ. 2001. Estimating the global species richness of an incompletely described taxon: an example
using parasitoid wasps (Hymenoptera: Braconidae).
Biolog-ical Journal of the Linnean Society73: 279–286.
Dowdy AK, McGaughey WH. 1996. Using random amplified polymorphic DNA to differentiate strains of the Indian meal
moth (Lepidoptera: Pyralidae). Population Ecology25: 396–
400.
Eastop VF. 1973. Biotypes of aphids. In: Lowe AD, ed.
Per-spectives in aphid biology, Bulletin no. 2. New Zealand: The
Entomological Society of New Zealand (Inc.), 40–51. Emelianov I, Mallet J, Baltenweiler W. 1995. Genetic
dif-ferentiation in Zeiraphera diniana (Lepidoptera: Tortricidae) the larch budworm – polymorphism, host races or sibling species. Heredity75: 416–424.
Emelianov I, Marec F, Mallet J. 2004. Genomic evidence for divergence with gene flow in host races of the larch budmoth.
Proceedings of the Royal Society of London B271: 97–105.
Favia G, Dimopoulos G, Louis C. 1994. Analysis of the
Anopheles gambiae genome using RAPD markers. Insect
Molecular Biology3: 149–157.
Feder JL, Berlocher SH, Opp SB. 1998. Sympatric
host-race formation and speciation in Rhagoletis (Diptera:
Tephritidae): A tale of two species for Charles D. In: Mopper S, Strauss SY, eds. Genetic structure and local adaptation in
natural insect populations. New York: Chapman & Hall,
408–441.
Feder JL, Berlocher SH, Roethele JB, Dambroski H, Smith JJ, Perry WL, Gavrilovic V, Filchak KE, Rull J, Aluja M. 2003b. Allopatric genetic origins for sympatric host-plant shifts and race formation in Rhagoletis.
Proceed-ings of the National Academy of Sciences, USA100: 10314–
10319.
Feder JL, Roethele FB, Filchak K, Niedbalski J, Romero-Severson J. 2003a. Evidence for inversion polymorphism related to sympatric host race formation in the apple maggot fly, Rhagoletis pomonella. Genetics163: 939–953.
Fitton MG, de Graham MWRV, Bou ek ZRJ, Ferguson NDM, Huddleston T, Quinlan J, Richards OW. 1978. Kloet and Hincks: a check list of British insects, 2nd edn. Part 4: Hymenoptera. Handbook for the identification of British
insects 11: (I–ix). London, UK: Royal Entomological Society,
1–159.
Garner KJ, Slavicek JM. 1996. Identification and character-ization of RAPD-PCR marker for distinguishing Asian and
cˇ
North American gypsy moths. Insect Molecular Biology 5:
81–91.
Gaston KJ. 2000. Global patterns in biodiversity. Nature405: 220–227.
Gawel NJ, Bartlett AC. 1993. Characterization of differences
between whiteflies using RAPD-PCR. Insect Molecular
Biol-ogy2: 33–38.
Graham MWR, Claridge MF. 1965. Studies on the
Stenom-alina-group of Pteromalidae (Hymenoptera: Chalcidoidea).
Transactions of the Royal Entomological Society of London 117: 263–311.
Haack L, Simon J-C, Gautheir J-P, Plantegenest M, Dedryver C-A. 2000. Evidence for predominant clones in a cyclically parthenogenetic organism provided by combined
demographic and genetic analyses. Molecular Ecology 9:
2055–2066.
Halliday RB. 1981. Heterozygosity and genetic distance in
sibling species of meat ants, Iridomyrmex purpureus group.
Evolution35: 234–242.
Hedicke H. 1920. Beitrage zu einer Monographie der
palaark-tischen Isosminen (Hymenoptera: Chalcidoidea). Archiv für
Naturgeschichte86: 1–165.
Henneicke K, Dawah H, Jervis M. 1992. Taxonomy and biology of final instar larvae of some Eurytomidae (Hymenoptera: Chalcidoidea) associated with grasses in the
UK. Journal of Natural History26: 1047–1087.
Hung ACF. 1982. Chromosome and isozyme studies in
Trichogramma (Hymenoptera: Trichogrammatidae).
Pro-ceedings of the Entomological Society of Washington7: 791–
796.
Hung ACF, Schaefer PW. 1990. Isozyme analysis in six
pop-ulations of Pediobius foveolatus (Crawford) (Hymenoptera:
Eulophidae). Proceedings of the Entomological Society of
Washington92: 160–165.
Kruskal JB. 1964a. Multidimensional scaling by optimising goodness-of-fit to a non metric hypothesis. Psychometrika29: 1–27.
Kruskal JB. 1964b. Non-metric dimensional scaling: a
numerical method. Psychometrika29: 115–129.
Kunz W. 2002. When is a parasite species a species? Trends in
Parasitology18: 121–124.
Landry BS, Dextraze L, Boivin G. 1993. Random amplified polymorphic DNA markers for DNA fingerprinting and genetic variability assessment of minute parasitic wasp spe-cies (Hymenoptera: Mymaridae) and Trichogrammatidae used in biological control programs of phytophagous insects.
Genome36: 580–587.
Lawton JH, Bignell DE, Bolton B, Bloemers GF, Eggle-ton P, Hammond PM, Hodda M, Holt RD, Larsen TB, Mawdsley NA, Stork NE, Srivastava DS, Watt AD. 1998. Biodiversity inventories, indicator taxa and effects of habitat modification in tropical forest. Nature391: 72–76.
Linn C, Feder JL, Nojima S, Dambroski HR, Berlocher SH, Roelofs W. 2003. Fruit odour discrimination and sym-patric host race formation in Rhagoletis. Proceedings of the
National Academy of Sciences, USA100: 11490–11493.
Loxdale HD. 1994. Isozyme and protein profiles of insects of agricultural and horticultural importance. In: Hawksworth