USING LEARNING ANALYTICS TO PREDICT ACADEMIC SUCCESS IN ONLINE AND FACE-TO-FACE LEARNING ENVIRONMENTS
by
Lisa Janine Berry
A dissertation
submitted in partial fulfillment of the requirements for the degree of Doctor of Education in Educational Technology
Boise State University
DEFENSE COMMITTEE AND FINAL READING
APPROVALS
of the dissertation submitted by
Lisa Janine Berry
Dissertation Title: Using Learning Analytics to Predict Academic Success in Online and Face-To-Face Learning Environments
Date of Final Oral Examination: 06 March 2017
The following individuals read and discussed the dissertation submitted by student Lisa Janine Berry, and they evaluated the student’s presentation and response to questions during the final oral examination. They found that the student passed the final oral examination.
Jui-long Hung (Andy), Ed.D. Chair, Supervisory Committee Kerry Lynn Rice, Ed.D. Member, Supervisory Committee Jesủs Trespalacios, Ph.D. Member, Supervisory Committee
iv ABSTRACT
This learning analytics study looked at the various student characteristics of all on-campus students who were enrolled in 100 and 200 level courses that were offered in both online and face-to-face formats during a two-year period. There is a perception that online education is either not as successful as face-to-face instruction, or it is more difficult for students. The results of this study show this is not the case.
The goal of this study was to complete an in-depth analysis of student profiles addressing a variety of demographic categories as well as several academic and course related variables to reveal any patterns for student success in either online or face-to-face courses as measured by final grade. There were large enough differences within different demographic and academic categories to be considered significant for the study
population, but overwhelmingly, the most significant predictor of success was found to be past educational success, as reflected in a student’s cumulative grade point average.
v
TABLE OF CONTENTS
ABSTRACT ... iv
LIST OF TABLES ... ix
LIST OF FIGURES ...x
CHAPTER ONE: INTRODUCTION ...1
Background ...1
Problem Statement ...1
Purpose of Study ...6
Research Questions ...8
CHAPTER 2: LITERATURE REVIEW ...10
Introduction ...10
Evolution of Retention Tracking in Higher Education ...10
Origins of Higher Education and Distance Learning ...10
The 1930s – 1960s ...11
The 1970s – 1980s ...13
The 1990s – Today...14
Factors Impacting Persistence...16
Sociological Factors ...17
Psychological Factors ...18
vi
Economic Factors...20
Factors Impacting Student Achievement ...21
Academic Factors...21
Demographic Factors ...26
Cultural and Societal Factors ...28
Course Delivery Models ...30
Learning Analytics ...33
History of Learning Analytics ...35
Learning Analytics Frameworks ...36
Privacy and Ethics...39
Uses of Data ...40
Summary of the Literature ...43
CHAPTER 3: METHODOLOGY ...45
Overview ...45
Method ...45
Participants ...46
Capture ...47
Data Collection ...47
Data Organization ...50
Data Cleaning and Validity ...50
Report ...52
Predict ...53
vii
Refine ...54
CHAPTER 4: DATA ANALYSIS AND RESULTS ...55
Introduction ...55
Demographics ...55
Overall...55
Gender ...56
Age ...57
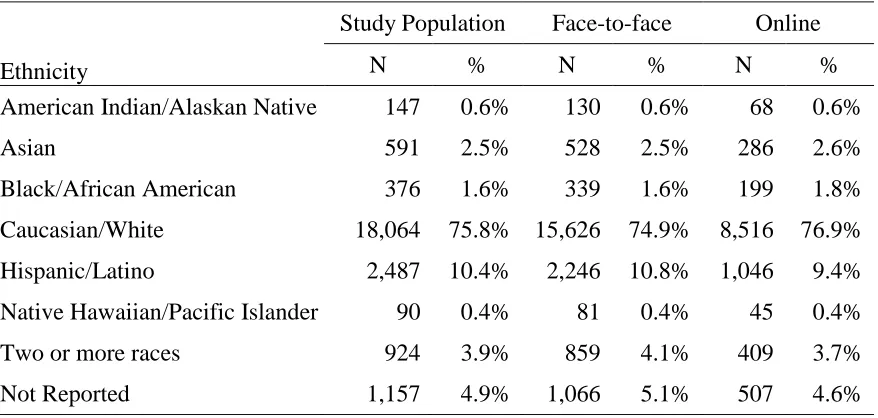
Ethnicity ...57
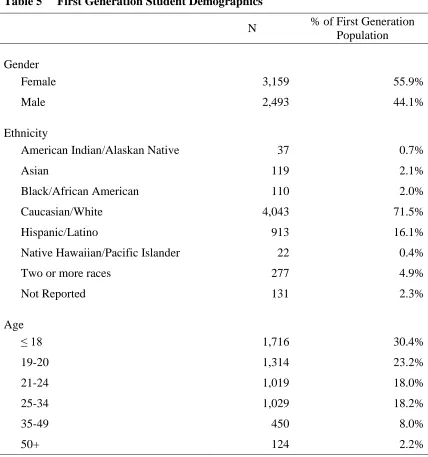
First Generation Students ...58
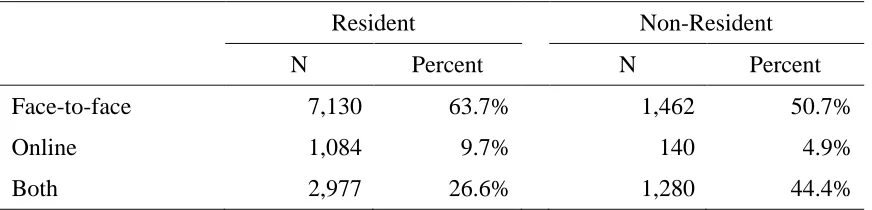
Residency ...60
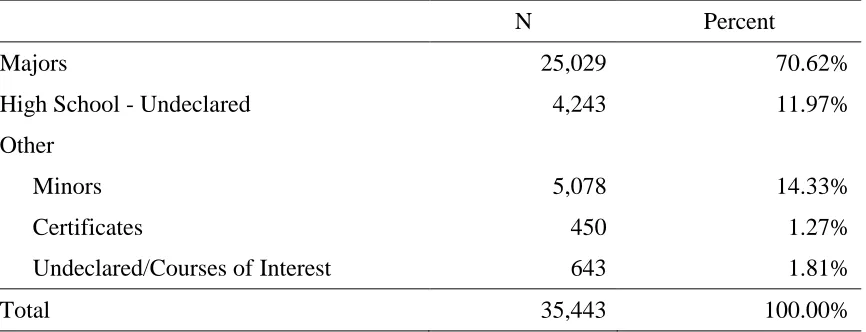
Majors/Minors/Certificates ...60
Courses ...63
Enrollments ...65
Grades Earned ...66
Course Subjects ...67
Correlation Comparisons ...73
Logistic Regression Results ...74
Demographic Variables ...75
Academic Variables ...76
Course Variables ...77
Full Prediction Model ...78
Research Question 4 – Further Analysis ...87
viii
CHAPTER 5: DISCUSSION AND CONCLUSIONS ...90
Introduction ...90
Demographics and Courses...91
Predictors of Academic Success ...92
Research Question 1: Which are important predictors from student characteristics that lead to successful completion of 100 and 200 level classes taken online, as measured by final grade? ...95
Research Question 2: Which are important predictors from student characteristics that lead to successful completion of 100 and 200 level classes taken face-to-face, as measured by final grade? ...96
Research Question 3: What predictors are common or differ between online and face-to-face settings? ...98
Research Question 4: Which academic departments or individual courses can be identified as significant and in need of further analysis? ...101
Limitations ...102
Recommendations for Future Research ...104
Implications of the Results...105
ix
LIST OF TABLES
Table 1 Predictors of Retention for Various Student Characteristics ... 22
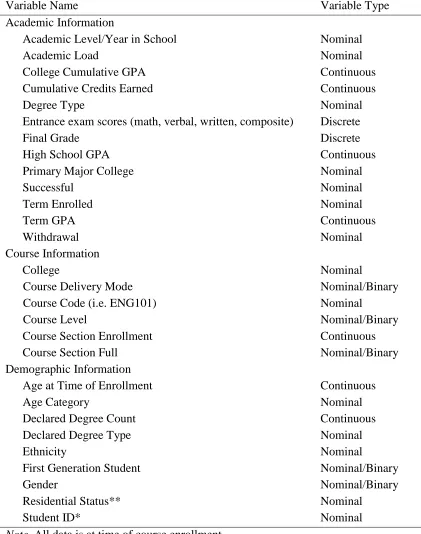
Table 2 Data Variables ... 49
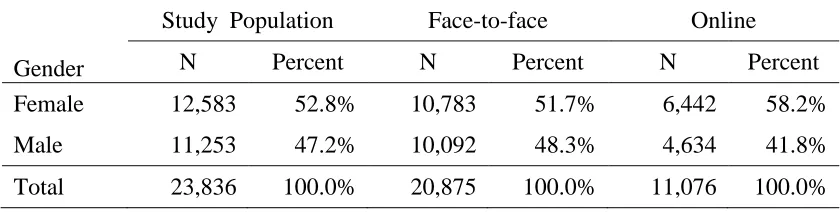
Table 3 Gender of Students by Course Modality ... 56
Table 4 Ethnicity of Students by Course Modality ... 58
Table 5 First Generation Student Demographics ... 59
Table 6 Residency Status of Students by Course Modality ... 60
Table 7 Distribution of Degree Types Declared by Students in Study Population ... 61
Table 8 Number of Degrees Declared by Student in Study Population ... 61
Table 9 College or School of Primary Major Declared by Students ... 62
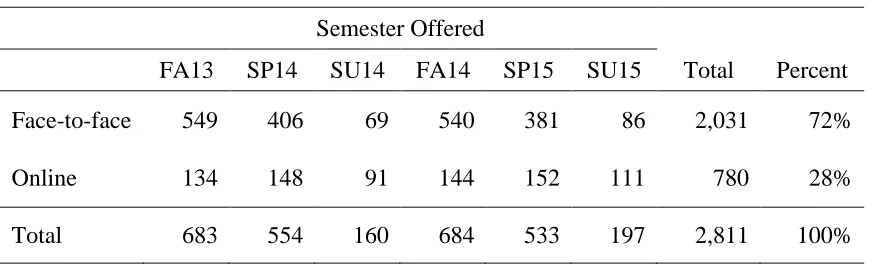
Table 10 Course Sections by Modality and Term ... 63
Table 11 Courses Offered by Academic Department ... 64
Table 12 Descriptive Statistics for Grade Value of Enrollments ... 68
Table 13 Descriptive Statistics for Grade Value by Course Subject ... 71
Table 14 Logistic Regression Summary for Subset Models ... 76
Table 15 Full Logistic Regression Models for Success ... 82
x
LIST OF FIGURES
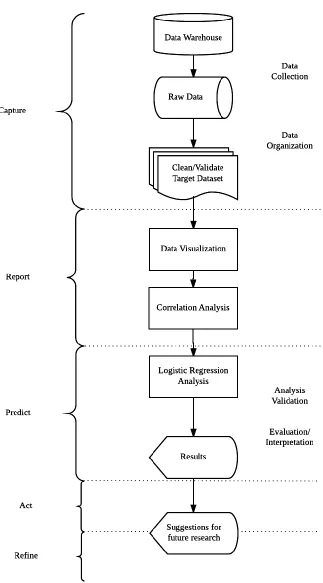
Figure 1 Visualization of Learning Analytics Process ... 48
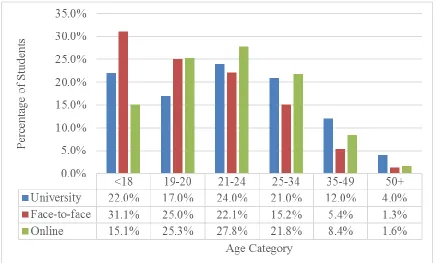
Figure 2 Distribution of Students by Age ... 57
Figure 3 Academic Level of Students at Time of Enrollment ... 65
1
CHAPTER ONE: INTRODUCTION Background
Students across the United States are choosing to continue their education beyond high school at an increasing rate. In 2012, approximately 41% of the population of 18-24-year-olds were enrolled in an institution of higher education (National Center for
Education Statistics, 2014b). Ten years earlier only 36% of 18-24-year-olds opted to enroll in college. Online learning is growing at an even faster rate than overall
enrollments. In 2014, about 28% of post-secondary students were enrolled in at least one distance learning course (Allen & Seaman, 2016; Hart, 2012). In contrast, in 2002, less than 10% of students opted for distance learning.
The university that was the basis of this study experienced growth in the overall student population as well as online course enrollments. The fall 2014 enrollment was approximately 29,100 students, nearly a 20% increase from just ten years earlier. Of these students, about 11,400, or 39%, were enrolled in at least one online course. Following the national trend, the university saw a 13% decrease in the number of students enrolled in exclusively face-to-face courses over the past two years (eCampus Center, 2015).
Problem Statement
2 percentage of students who reenroll in the university for the next term. Nationally, the retention rate of full-time students from year to year is 71.8%, but when students are enrolled only part-time, the retention rate drops to 42.2% (National Center for Educational Statistics, 2014a). The university that was the focus of this study saw significant growth in year-to-year retention of full-time students, both face-to-face and online, over the past ten years. This number grew from 58.6% in 2002 to 71.7% in 2012, which is very close to the national average (Office of Institutional Research, 2013).
Persistence is a term that is often used in relation to retention. Retention is measured from the perspective of the university, while persistence is reenrollment or the desire to reenroll from the student’s point of view. Students make decisions about whether to persist in their education based on a number of factors. Researchers
established a number of theories on why students persist in their education starting in the 1970s (Astin, 1975; Bean & Metnzer, 1985; Spady, 1970; Tinto, 1975). These theoretical frameworks consider how the needs of the individual student align with what the
3 study. In addition to the factors described in the persistence theories, academic factors can influence a student’s decision as to whether to persist in their education.
One of the key organizational factors is convenience. If educational options are convenient for students, they are more likely to persist throughout the term and enroll in coursework during the next term. Most university level students complete their post-secondary education in a traditional manner, on a college campus in a classroom. This model works well for most traditional students, who choose to live on campus or are local commuter students. However, the option to enroll in courses at a distance has expanded opportunities for many students, especially those defined as nontraditional.
Nontraditional students are those that meet one or more of these categories: students that are enrolled on a part-time basis, work more than 35 hours per week while enrolled in coursework, are financially independent, have dependents or are a single parent, do not have a high school diploma, or delayed beginning their higher education for a period of time after high school (Watt & Wagner, 2016).
With the convenience of online course offerings, students can be located anywhere in the world and successfully complete their school work. Courses offered online are taken by students in remote locations as well as by students who reside on campus. This option provides flexibility for even local students, giving them the option to work on coursework as their schedule allows as opposed to one determined by the
4 If students report taking only some of their higher education courses online, then the remainder of their classes must be completed on campus.
While the online delivery model provides convenience for both time and location, it has caused concern about the quality of the courses as compared to the more traditional, face-to-face, delivery model (Patterson & McFadden, 2009). These concerns are based on a review of pass rates that compare face-to-face and online learning. Ideally, the two delivery models, face-to-face and online, provide equal opportunities for students, and in turn, have a consistent rate of reenrollment the next term. Clark (1983) reviewed
literature addressing media comparison studies from as early as the 1960s. He concluded that, when considering learning outcomes as the sole measure of comparison,
well-designed studies show no significant difference in knowledge gained from one medium to another. Thus, when comparing face-to-face and online versions of the same course, learning outcomes should be the same (Lockee, Burton, & Cross, 1999). Clark argued that differences in achievement, or persistence during a course, are due to some other influence. These influences may include the instructional methods (Clark, 1983), student motivation, self-discipline (Colorado & Eberle, 2010), student post-secondary readiness, or cultural factors (Braxton & Hirschy, 2005).
5 dropouts and stopouts can be initiated by the student, or by the institution. If the
institution does not allow reenrollment, it is typically due to lack of an acceptable academic progress or a violation of school code of conduct.
Patterson and McFadden (2009) completed a study analyzing demographic data of students doing poorly in both face-to-face and online delivery models and found a higher dropout rate in the online environment. Age was a factor in persistence, with older students being more likely to dropout. Another study found that females are more successful than males in completing courses in the online environment (Aragon & Johnson, 2008). Considering these findings, this study aimed to identify these and other student characteristics that lead to more successful outcomes in one delivery model over another. The range of student characteristics included demographic as well as academic and course specific data that was both static and dynamic.
Despite the perception that students do worse in online courses as compared to face-to-face, leadership at the university has invested significant funds and resources to encourage the growth of online learning for both on-campus and remote students. Continued growth of online learning is an essential component of the university’s
6 model or a face-to-face format. It will be beneficial to have knowledge about success in specific courses as well as courses offered by specific departments. This knowledge can be used to inform student advising sessions, or to guide recommendations for course registration. The information can also help university leadership make decisions about which departments or courses may be due for a curriculum evaluation. In addition, individual courses, either online or face-to-face, may be identified for a redesign, or the information can be used to guide decisions for expansion of programs or degree offerings for either face-to-face or online formats. At a broader level, this information can be used to guide both the recruiting and admissions processes (Kalsbeek & Zucker, 2013).
Between 2000 and 2012, retention between the first and second year of
enrollment for students both first time and transfer students, increased by over 10% at the university that is the focus of this study (Office of Institutional Research, 2013). This indicates progress toward reaching the goal outlined in the university’s strategic plan. Although there has been overall growth in both retention and graduation rates between 2000 and 2012, there was not consistent growth (Office of Institutional Research, 2013). This presented a need for an analysis of demographic and academic data over multiple years to address variances in persistence rates and to identify trends over more recent years. Since the university will benefit from having increased retention and graduation rates, it will be advantageous for the leadership to be informed on the characteristics of successful students in both online and face-to-face course delivery modes.
Purpose of Study
7 skill, or for economic reasons (Braxton & Hirschy, 2005). The purpose of this study was to identify what types of students were more successful face-to-face and which were more successful online. Some students enter college and successfully earn a degree, while others end up leaving their chosen institution for a variety of reasons. This study
examined some of the characteristics that were common to students who were successful in both of these course delivery modes.
The significance of this study is to provide information to university stakeholders about trends in academic success and who persisted in their education whether the student opted for online or face-to-face course modalities. Stakeholders can use the information gleaned from this study to inform decisions related to policymaking and academic advising. Additionally, the information can be used to identify retention issues and curricular concerns. Students can use academic trends identified through this type of learning analytics to reflect and self-select course enrollment options.
Academic success can be defined in a number of ways. For the purposes of this study, a grade of C- or better is deemed as successful because this is the grade required for any prerequisite courses across the university. Additionally, it is the same measure used by Liu, Gomez, and Yen (2009) in their study on retention and final grades.
Universities, as well as individual students, can benefit from persistent enrollment until a degree is attained (Baum, Ma, & Payea, 2013). They are often compared by measures such as graduation rate and retention rate (Adelman, 1999). These statistics can be used as a recruiting tool for both students and faculty. In addition to monetary benefits for the university, individuals can benefit from staying in school until a degree or
8 employed, they are more likely to receive additional compensation beyond a salary such as pension and health benefits (Baum, et al., 2013; U.S. Bureau of Labor Statistics, 2015).
If institutions of higher education are informed of which types of students persist, particularly in a specific course modality, university personnel may be better prepared to counsel students who do not have similar characteristics toward success or offer
additional support to certain students. This quantitative study examined a variety of student demographic characteristics including age, gender, ethnicity, as well as several academic factors including current university grade point average (GPA), enrollment status, and year in school. A correlational analysis was used to determine any patterns of success for on-campus students in either face-to-face or online classes. This was followed by a series of logistic regression analyses which were completed in order to identify predictors of success. Following the correlation and regression analyses, a deeper analysis of courses from an outlier area was completed in an attempt to identify the underlying reasons for some of the educational trends.
Research Questions
9
1. Which are important predictors from student characteristic profiles that lead to successful completion of 100 and 200 level classes taken online, as measured by final grade?
2. Which are important predictors from student characteristic profiles that lead to successful completion of 100 and 200 level classes taken face-to-face, as measured by final grade?
3. What predictors are common or differ between online and face-to-face settings?
10
CHAPTER 2: LITERATURE REVIEW Introduction
This chapter addresses literature relevant to the study. The first section reviews the emphasis of retention and graduation rates for both face-to-face and online as higher education has evolved over time in the United States. Later sections address retention theories and factors that affect persistence as well as factors that affect student
achievement. The next section discusses some of the differences between online and face-to-face course delivery models, and the final section reviews how learning analytics and data mining have been used to explore student success.
Evolution of Retention Tracking in Higher Education
Origins of Higher Education and Distance Learning
Institutions of higher education were established in the United States long before the country was founded. Many of the early institutions were founded with religious freedom in mind. Their goal was to provide religious education for future ministers (Geiger, 2015; Snyder, 1993). At that time, the focus of the universities was to facilitate the spread of religion as opposed to retention of students, so records of this nature were not kept.
11
schools, two-year institutions designed to prepare teachers for the public school system. Enrollment in higher education during the nineteenth century was very exclusive. Enrollment across the country consisted of only 1% of people 18 to 24 years of age (Snyder, 1993). Because of the elite status for university level students, retention was not perceived as an issue and therefore was not tracked (Berger & Lyon, 2005).
The first evidence of distance education was found in Europe during the same time higher education in the United States was in its early expansion. As early as the mid-1800s, students in Great Britain were learning shorthand through courses offered via the postal service. Language classes were offered in both France and Germany using a similar approach. Learning through correspondence began in the United States a few decades later (Colorado & Eberle, 2010; Moore & Kearsley, 2005). These courses had a goal of spreading knowledge, so retention was still not a consideration.
The 1930s – 1960s
12
location. During this time, some innovative institutions implemented distance education employing mail based correspondence courses as well as delivery of higher education courses over radio broadcasts (Colorado & Eberle, 2010; Moore & Kearsley, 2005).
Major world events during this time frame had an impact on enrollment trends at the higher education level. World War II had a significant effect on enrollments since societal efforts were focused on the war as opposed to getting an education. As a result, college enrollments dropped 20% between the 1939-1940 and 1943-1944 school years (Snyder, 1993). Male students were a much higher portion of the group that departed college as compared to females. However, once the war was over, enrollment numbers grew quickly. This growth is partially due to the GI Bill that was passed by congress in 1944 to provide incentives for veterans of the war to take advantage of higher education opportunities (Bean & Metzner, 1985; Bok, 2013).
To encourage ongoing education, the United States Armed Forces founded a distance learning institute around the time of the beginning of World War II. This military based organization offered both high school and college level courses to members of the military (Moore & Kearsley, 2005). There were opportunities for correspondence courses, telephone based education, and courses offered via television. These models allowed people to continue their education wherever they were located.
13
transitioned enrollment in institutions of higher education from the elite to commonplace, leading to a more diverse student body (Berger & Lyon, 2005; Bok, 2013). This growth also brought students to the university system who lacked the proper preparation to be successful. Students did not know what to expect either academically or socially, and colleges were not prepared to provide that information to students. As a result, the more diverse student audience brought an increase in dropouts (Berger & Lyon, 2005). The 1970s – 1980s
The enrollment surge of the 1960s created an increased interest in tracking enrollment, student persistence, and satisfaction with the educational experience (Berger & Lyon, 2005). Two major studies completed in the 1970s examined college dropouts and a variety of factors that may have contributed to students leaving the higher
education system. Spady (1970) looked at environmental factors, while Kamens (1971) compared dropout rates to the size and prestige of the institution. These studies
determined that there were higher dropout rates at larger institutions. The large
institutional experience was less personal because students had fewer opportunities to get to know the faculty teaching their courses (Kamens, 1971). He also found that students who attended a university that was perceived as more prestigious regarded their education as having more value thereby making them more employable. Studies like those
14
During this time, another organization that led the implementation of alternative education modalities was the Electronic University Network, a consortium consisting of several post-secondary institutions. By the 1980s, the Electronic University Network had over two hundred television based courses available to learners across the United States, most were available on public broadcasting stations (Moore & Kearsley, 2005). These courses were some of the early attempts to provide expanded flexibility for learners. The 1990s – Today
As higher education transitioned into the twenty-first century, retention rates were still lower than desired. Dropouts ranged from a low of 8% at private elite institutions to a high of 50% at open enrollment colleges (Berger, & Lyon, 2005). Before this time, most institutions were single mode institutions, offering only one mode of instruction. Advances in technology caused many institutions to begin exploring new instructional models. Some expanded to operating as dual mode institutions, offering two modes of instruction, most often face-to-face and distance learning options. Still other institutions had individual faculty members who opted to move their courses online. Most
15
In an attempt to provide even more opportunities for students, some educators worked to provide distance learning incorporating a variety of media options. Courses used a combination of correspondence and media including video, via live broadcasting or video recordings, audio, printed study guides, with assignments submitted via mail (Colorado & Eberle, 2010; Moore & Kearsley, 2005). Another multimedia course delivery model implemented during the late twentieth century was teleconferencing. Teleconferencing used either one-way or two-way communication using video (Moore & Kearsley, 2005).
The next phase of distance learning was centered on the use of computers and the Internet (Colorado & Eberle, 2010; Moore & Kearsley, 2005). Use of this technology allowed for a multimedia experience combining the use of text, graphics, audio, and video in the learning experience. The phrase online learning is synonymous with distance learning via the Internet. Early iterations of online learning were not much more than correspondence courses that used email in place of postal mail.
Online learning became much more feasible and more widely adopted with the advent of the learning management system (LMS). Learning management systems and their improvements came in three waves. Early learning management systems provided a structured environment for sending and receiving documents. The arrival of Web 2.0 tools enhanced online learning and learning management systems by providing opportunities for students to interact with the content in real time. The next, and most recent, significant change in online learning came with combining the field of data
16
Factors Impacting Persistence
As early as the 1970s researchers developed theoretical frameworks to explain student retention or lack thereof (Astin, 1975; Bean & Metzner, 1985; Spady, 1970; Tinto, 1975). Many early persistence frameworks were based on a suicide theory. These theories worked under the assumption that a combination of academic and social
integration into the environment was critical to thriving. If the student felt they did not fit in, either academically or socially, then they were at risk of dropping out or ending their life at the institution (Spady, 1970; Tinto, 1975). Because of the era in which these theories were created, they were focused on face-to-face students. However, they can be transferred to all instructional models.
Astin (1975) attempted to explain persistence using an Input-Environment-Outcome model. He theorized that students enter higher education with a number of foundational characteristics, or inputs, that influence their ability to persist. The input variables include demographic characteristics, high school grades, and reasons for
17
Tinto (1975) expanded Spady’s theory, which focused on multiple reasons why a person might not persist in their education, to propose an interactional theory of college departure. The theory is labeled as interactional because there are often multiple
interrelated reasons why a student chooses to leave school. Astin’s and Tinto’s theories intersect at the point that they both consider the set of characteristics that a student has when beginning their higher education experience (Ishler & Upcraft, 2004). Tinto’s theory includes both sociological and psychological reasons for students to drop out or stop out of their education (Braxton & Hirschy, 2005). Bean and Metzner (1985) added organizational reasons to the theories for lack of persistence. All of the persistence theories address primarily voluntary dropout or stopouts as opposed to students who do not reenroll for reasons determined by the institution (Berger & Lyon, 2005; Ishler & Upcraft, 2004). The institution may deny reenrollment due to serious misconduct or consistent failing grades. Voluntary departure most often occurs when a student feels the obstacles to success are insurmountable.
Sociological Factors
18
satisfaction, and consequently, a higher rate of retention (Lotsari, Verykios, Panagiotakopoulos, & Kalles, 2014). Student engagement, whether behavioral, emotional, or cognitive, is positively correlated with student achievement (Adelman, 1999; Pardo, 2014), so is an essential component of sociological satisfaction with the educational experience.
Psychological Factors
Psychological factors that affect persistence can be either internal or external. Internal factors that can influence persistence include academic success, motivation, self-esteem issues, and study habits. Student motivation and perception of learning can also affect their persistence in school. Some students are only looking for surface level learning, meaning they simply want to pass the test and get a grade. These students may get less out of their educational experience than those looking for a deeper level of learning. These students are looking to relate new information to previous knowledge, find patterns in the content, and gain a deep understanding of the underlying principles (Stansfield, McLellan, & Connolly, 2004).
19
Organizational Factors
Bean and Metzner (1985) were the first to consider retention from an
organizational perspective as opposed to that of the student. Universities have a vested interest in getting students to stay in school until a degree is earned. Persistence requires students to conform to the organizational norms of the institution, but the institution plays a key role in this conformity (Habley et al., 2012).
Students must have the proper academic aptitude and skill along with personality traits that allow them to integrate themselves into the college environment (Braxton & Hirschy, 2005; Park & Choi, 2009). If a student does not fit into the organizational norms of the institution, it can affect their level of satisfaction with the university. Tinto (1975) found that students needed to adapt to the routine of the institution. They need to learn how to participate and communicate to fit into the college environment both inside and outside of the classroom. This adaptation is dependent on the structure of the university as well as the flexibility of the student. If this integration does not take place, a student is much more likely to drop out of the institution. These learning communities exist in both the face-to-face and online learning environments. Institutions can encourage
opportunities to ease student adaptation to the organization through the use of student orientation, learning communities, appropriate academic advising, and other support services (Ishler & Upcraft, 2004; Swail, 2004).
20
their education. Academic advising should take place in conjunction with the orientation, setting the student down the proper path to academic success (Ishler & Upcraft, 2004). Economic Factors
While not included in the theories established in the 1970s, current-day students also consider economic reasons for persistence in institutions of higher education (Braxton and Hirschy, 2005). The current average cost of tuition, fees, room and board for a full-time undergraduate student is approximately $20,000 per year. About 84% of full-time undergraduate students rely on financial aid in the form of grants, loans, work-study, or other sources to help cover these costs (National Center for Educational
Statistics, 2015). Many students struggle to see the return on investment of time, money, and effort put into their education, thus select other career options that do not require further education. The time spent working to pay back loans can also be a deterrent to continuing in school until a degree is attained. On the other hand, financial aid can provide opportunities for some highly motivated students who might not otherwise be able to access higher education (Swail, 2004).
21
Factors Impacting Student Achievement
Poor academic achievement is second only to financial reasons for the lack of student persistence in higher education (Bean, 2005). Academic achievement can be measured by grade point average (GPA), test scores, class rank, or final course grades. In addition to academic achievement, demographic, and cultural factors, the structure of the courses a student chooses and the level of student self-regulation can influence how a student does in school, and in turn, affect the likelihood of a student persisting until degree completion. All of these factors contribute to a student’s set of entry
characteristics. Table 1 provides a summary compilation of several key student predictors and the study reporting the data.
Academic Factors
22
Table 1 Predictors of Retention for Various Student Characteristics
Student Characteristic Relationship of Characteristic to
Academic Retention Studies Addressing Characteristic Academic Advising and
Support
More support is positively correlated with persistence
Swail (2004)
Face-to-Face Only: Adelman (1999); Thayer (2000) Online Only: Ivankova & Slick (2007)
Academic Level/ Year in School *
The further in school is a positive predictor for online course success
Online Only: Dupin-Bryant (2004); Levy (2007); Muse (2003); Osborn (2001)
Academic Load/ Number of Credits *
More credits correlate to more likely to be successful
Campbell et al.(2007)
Online Only: Colorado & Eberle (2010) Academic Readiness/
High School Rigor
More college preparation correlates to more success
Choy (2001); Demetriou & Schmitz-Sciborski (2011);Nora & Crisp (2012)
Face-to-Face Only: Adelman (1999)
Online Only: Aragon & Johnson (2008), Müller (2008); Muse (2003);
Age * Younger students are more
successful
Nora & Crisp (2012)
Online Only: Hung, Hsu, & Rice (2012); Menager-Beeley (2001); Osborn (2001); Yasmin (2013)
23
Student Characteristic Relationship of Characteristic to
Academic Retention Studies Addressing Characteristic Course Subject * Students are more successful in
some subject areas. Math tends to be more challenging.
Online Only: Hung et al. (2012); Yasmin (2013)
Entrance Exam Scores * Higher test scores are a positive predictor
Campbell et al. (2007); Cortes (2013); Reason (2003) Online Only: Morris et al. (2005)
Ethnicity * Asians and Caucasians more likely to persist
Nora & Crisp (2012); Reason, 2003; Swail (2004)
Blacks, Hispanics, Native Americans less likely to persist
Bowen, Chingos, & McPherson (2009); Nora & Crisp (2012); Reason (2003); Swail (2004)
Financial Aid Eligibility Lower socioeconomic status students are less likely to persist
Campbell et al.(2007); Swail (2004)
Higher socioeconomic status students are more likely to persist
Bowen et al. (2009); Swail (2004)
First Generation Student * First-generation students are less likely to be successful
Choy (2001); Falcon (2015); Stebleton & Soria (2013) Face-to-Face Only: Thayer (2000)
Gender * Females are more successful Online Only: Aragon & Johnson (2008); Hung et al. (2012); Yasmin (2013)
24
Student Characteristic Relationship of Characteristic to
Academic Retention Studies Addressing Characteristic Grade Point Average
(GPA) *
Higher GPA correlates to higher success online
Bowen et al. (2009); Campbell et al.(2007); Devadoss & Foltz (1996); Reason (2003); Swail (2004)
Face-to-Face Only: Adelman (1999)
Online Only: Aragon & Johnson (2008); Dupin-Bryant (2004); Harrell & Bower (2011); Menager-Beeley (2001); Morris et al. (2005); Muse (2003); Osborn (2001); Valasek (2001)
High School GPA * Higher GPA a positive predictor of academic success
Bowen et al. (2009); Cortes (2013); Nora & Crisp (2012); Reason (2003)
Online Only: Morris et al. (2005) Major * Some majors do better than others,
undeclared majors are less likely to persist
Campbell et al.(2007) Online Only: Tello (2007)
Parent Education Level Higher parent education level is positively associated with persistence
Choy (2001)
Self-Efficacy More self-efficacy a student has the more likely they are to be successful
Cortes (2013); Demetriou & Schmitz-Sciborski (2011) Online Only: Holder (2007); Ivankova & Stick (2007); Kemp (2002); Müller (2008)
25
Student Characteristic Relationship of Characteristic to
Academic Retention Studies Addressing Characteristic Self-Motivation Motivated students tend to be
successful
Demetriou & Schmitz-Sciborski (2011); Devadoss & Foltz (1996); Nora & Crisp (2012)
Face-to-Face Only: Adelman (1999)
Online Only: Ivankova & Stick (2007); Liu, Gomez, & Yen (2009); Muse (2003); Valasek (2001)
Student Age Similar to Peers
Positive effect de Freitas et al. (2015)
Student Attendance Attendance in face-to-face classes is a positive predictor of success
Devadoss & Foltz (1996)
Student Engagement More social interaction with faculty or other students is a positive predictor of academic success
Demetriou & Schmitz-Sciborski (2011); de Freitas et al. (2015); Nora & Crisp (2012); Swail (2004)
Face-to-Face Only: Thayer (2000)
Online Only: Hung et al. (2012); Ivankova & Stick (2007); Liu et al. (2009); Müller (2008); Valasek (2001)
Support of Family and Friends
More support correlates with more persistence
Choy (2001); Swail (2004)
Face-to-Face Only: Adelman (1999)
Online Only: Holder (2007); Müller (2008); Osborn (2001); Park & Choi (2009)
Work Commitments Students who are employed are less likely to persist to graduation
Kemp (2002); Tello (2007); Yasmin (2012)
26
success on a more general level finding that academic performance in higher education mirrors that of previous academic experiences. This correlation is true for both students with good grades as well as those who were unsuccessful (Lee & Choi, 2011). Students who enter a post-secondary institution less prepared for the academic rigor tend to struggle academically. This causes students to take longer to graduate (Ishler & Upcraft, 2004). Additionally, the more time that has passed since a student last took a class, the more likely they are to struggle when reenrolling (Colorado & Eberle, 2010; Moore & Kearsley, 2005). In contrast to these weaknesses, students who enter a course knowing how to study are more likely to be successful (Moore & Kearsley, 2005; McKenzie & Schweitzer, 2001). In addition to studying, students who make attendance in their classes a priority perform better (Devadoss & Foltz, 1996).
Demographic Factors
Early attempts at online learning were promoted as if all diversity could be hidden in an online environment (Rovai, Ponton, & Baker, 2008). While this could never happen in a face-to-face classroom because of visual cues, this type of utopian environment may be possible online, although it is unlikely. In this type of class, the bias would be
removed, but only until the instructor and students start interacting with each other. Students draw on their past experiences as learning resources, and these could not be shared without the diversity of the group being shared to some extent.
27
taking a break of a term or more while working on their post-secondary education. They are also more likely to attend school on a part-time basis (Ewert, 2010).
Rovai et al. (2008) found that, while enrolled in courses, males generally have a more positive attitude toward technology than their female counterparts. It may be due to this attitude toward technology that causes male students to exude more confidence in their online participation. Male students tend to use fewer qualifiers instead opting to use more intensifiers in their writing. When students are given the opportunity to interact with fellow students, females are more likely to ask questions while male students tend to answer questions more frequently. When working on low level learning tasks female students take notes and focus on absorbing the content where male students choose to ask questions directly to the instructor. In contrast, female students prefer interacting with fellow students when working on higher level learning tasks where males prefer
independent processing. The same research added that female students use a “connected voice” when contributing to discussion forums, portraying empathy and the importance of relationships while male students use an “independent voice” which is more certain in its tone, and sometimes is interpreted as confrontational (Rovai et al., 2008). Overall studies show that females are more successful than males, although studies have varying results as to the significance of their findings (Ishler & Upcraft, 2004).
28
nontraditional students. The term nontraditional student refers to a student who meets one or more of the following characteristics: they are over the age of twenty-four, married, have children, or are financially independent (Ewert, 2010; Watt & Wagner, 2016). Any of these factors can have a detrimental effect on a student’s attention to school work (Braxton & Hirschy, 2005; Park & Choi, 2009). It is these same factors that may cause a student to select online courses as opposed to face-to-face classes for the added flexibility that online options can offer.
Cultural and Societal Factors
Ethnicity is another demographic that is often used when considering success in higher education (Morris, n.d.; Richardson, 2012). Early researchers came up with theories based on genetics, hypothesizing that some races have more innate abilities than others. More recently, researchers argued that differences in educational outcomes are not due to genetics, but instead caused by the differences in economic, cultural, social, and historical circumstances. The nature versus nurture mentality spurred a new wave of research focused on educational interventions that aimed to overcome cultural differences (Morris, n.d.).
Modern research has centered on the cultural and societal factors that can have an effect on a student’s predisposition toward education (Richardson, 2012). Hofstede (2001) defined a framework that can be used to compare cultures and how the societal factors may define how the culture views higher education. The framework uses five different scales or dimensions.
29
Individualism – Collectivism Dimension. A scale that identifies how a person considers the effects of their actions.
Uncertainty – Avoidance Dimension. A measure of how nervous people are in situations perceived as unstructured or unpredictable.
Masculinity – Femininity Dimension. A range of how a culture identifies the distinction between what men are expected to do from what women are expected to do.
Long-Term – Short-Term Orientation Dimension. A measure of the extent to which people from a society are looking toward the future as opposed to living in the present.
Cultural differences can affect how students interact with the instructor in courses, both face-to-face and online. If the students have a different cultural background than the instructor, it has the potential to affect student achievement. The student may be
30
population, it is important for university faculty and staff to have an awareness of cultural differences (Campbell et al., 2007).
Course Delivery Models
There is a spectrum of course delivery models ranging from a face-to-face
classroom to a fully online course. One range within these delivery models is the amount of synchronous contact between instructor and student. Some classes take place in a fully synchronous format. This can occur in a classroom, via two-way video, or using a web-based meeting platform. Besides the level of synchronous contact, there are many considerations that can affect both the instructor and the student in these various course delivery models.
The roles of both the instructor and the student vary in the different course delivery methods. In face-to-face classes, the instructor often has the role of a “sage on the stage,” or the subject matter expert standing in the front of the classroom distributing their knowledge to the students (King, 1993). This aligns with the traditional idea of an instructor lecturing while students are taking notes and attempting to absorb as much information as possible. This means the activities are often planned and led by the instructor (Stansfield et al., 2004).
In online courses, the instructor role often changes. They act more as a “guide on the side” (King 1993). Some instructors opt to play an active role in course facilitation, providing regular academic support for students as they work their way through the course content. Instructors grade assignments and provide feedback to students, as well as facilitate online discussion forums. They make themselves available to struggling
31
seem to be struggling in their course. In this model, students have more control over their learning.
Malcolm Knowles (1984) identified a set of characteristics that are often preferred by adult learners. His learning theory is referred to as andragogy. Andragogy theory is based on a set of five assumptions regarding adult learners.
Learner Control. Since adult learners are independent members of society, they prefer to have a similar level of control within the learning environment. Therefore they like opportunities where their learning is self-directed.
Life Experience. Secondly, adult learners bring a vast array of experiences to the classroom. Knowles emphasized that these students learn best when they are encouraged to draw on their experiences and make connections between their past experience and the knowledge being gained through the educational experience.
Need-Based Learning. Adult learners approach the learning situation cognitively and emotionally ready for the task at hand. Adults tend to choose to continue their education based on a perceived need. The need could be initiated by a career change or a family event.
Value of Learning. Adult learners need a purpose for their learning. Toward this end, students need to be informed of the outcomes of the learning experience, and what value it will provide for them.
32
information that is relevant to their lives, and information that provides opportunities to connect to prior experiences.
Another variable in different course delivery formats involves the amount of interaction among students (Stansfield et al., 2004). Some course formats, either online or face-to-face, allow students to work through the materials at their own pace in a relatively independent format. In this type of course, the student has opportunities to interact with the content and the teacher, but not fellow students. Other online courses are designed for a cohort of students. In these courses, students have the opportunity to interact with each other as well as with the content and the teacher. Either format requires students to be active participants. Asynchronous online courses provide the opportunity for students to think and reflect on the content prior to participating in class. Because of the nature of the discussions, there is the potential for more student interaction and participation than in a live classroom. Discussion activities in courses are in alignment with Knowles’s
andragogy theory because it provides an avenue for students to be able to draw on personal experiences and share them with others. This approach allows students to use each other as learning resources (Moore & Kearsley, 2005).
face-to-33
face contact, there can be other advantages to online learning. The increased
opportunities for reflection, as well as unlimited access to the course content, provide a greater degree of learner control over the learning environment (Stansfield et al., 2004). The opportunity for reflection allows for deeper discussion as compared to those that take place in the face-to-face classroom. These discussions can be productive if students feel the online environment is a safe place for sharing their thoughts. In doing so, all
participants, both instructors and students, need to have respect for diverse perspectives (Rovai et al., 2008).
One common concern related to multiple course delivery models is a perception of differences in course quality (Patterson & McFadden, 2009). To mitigate concerns, online and face-to-face versions of the same course should be developed around the same set of learning objectives. Both course models should have the same measurable course outcomes, although they may be achieved in different ways. If this is truly the case, the two course models should have similar measures of student success (Clark, 1983). When a study finds that student outcomes differ between face-to-face and online, those
variances can typically be attributed to instructional strategies, student motivation, or self-discipline (Colorado & Eberle, 2010; Moore & Kearsley, 2005).
Learning Analytics
34
reduced chances of failure, effectively allowing educators to gain similar benefits for students as businesses do for their customers through advertising (Martin & Sherin, 2013). The Society for Learning Analytics Research defines their field as “the
measurement, collection, analysis and reporting of data about learners and their contexts for purposes of understanding and optimizing learning and the environment in which it occurs” (Siemens & Baker, 2012, pp. 1-2).
Learning analytics is often confused with the field of educational data mining. While the two fields have many similarities, some argue they evolved separately with a slightly different focus. The International Educational Data Mining Society defines educational data mining as “an emerging discipline, concerned with developing methods for exploring the unique types of data that come from educational settings, and using those methods to better understand students, and the settings which they learn in” (Siemens & Baker, 2012, p. 1). Learning analytics focuses on data from the learner and their context that will be used to improve either the learning process or the learning environment. In contrast, educational data mining has a slightly broader approach. These researchers do not specify where their data originates, but they do stipulate that their goal is to better understand students and the various learning environments. The core
35
personalize learning experiences for users. In contrast, learning analytics results are used to inform instructors on how to assist struggling learners (Baker & Siemens, 2014).
Both learning analytics and educational data mining are emerging as new research fields because of the ever-increasing amount of data available (Baker & Siemens, 2014; Wagner & Ice, 2012). Stakeholders at all levels are expressing interest in access and use of the data including educators, institutions, government, and accrediting agencies. These groups are using the data to make decisions about instructional strategies, judgments on the quality of learning, student attrition and graduation rates, financial aid, and policies about online teaching and learning (Dringus, 2011). Jayaprakash et al. (2014) stated that “the goal of learning analytics is to uncover hidden patterns in educational data and use those patterns to attain a better understanding of the educational process, assess student learning, and make predictions on performance” (pp. 1-2). Researchers in learning analytics should focus on providing data that support student success as opposed to other goals such as maximizing profits for the university (Becker, 2013; Slade, & Prinsloo, 2013).
History of Learning Analytics
36
learning situations (Brown, 2011). These tools provided additional data not available with learning management systems alone. The final wave of development for learning
analytics and data mining came with the increased capacity to analyze large amounts of data. Learning managements systems and student information systems were linked to track vast amounts of data.
There is an ever increasing push for stakeholders to use big data in decision making. Globalization has pushed the demand for learning analytics by creating increased competition for online educational opportunities. Students no longer need to live in the same town as their chosen institution of higher education. Reduced public funding and increased government oversight have caused a need for institutions to show a return on investment for the education they provide to students (Lockyer, Heathcote, & Dawson, 2013; Picciano, 2012).
Learning Analytics Frameworks
Since the field of learning analytics is relatively new, there are only a few proposed models to provide structure for studies. Some of these models are based on older theories of knowledge development or the use of business intelligence (Elias, 2011). Each of these models originates from the definition of learning analytics in that they are designed to use available data to inform and improve teaching and learning.
Knowledge Continuum. In his dissertation, Baker (2007) proposed a theory on how businesses can make knowledge actionable. He expanded on an earlier theory, which proposed that information lies on a Knowledge Continuum based on the depth of how the data is used (Elias, 2011). Data is at the lowest level and used to answer “what is”
37
questions about when and where. The third level on the spectrum is labeled as
knowledge. Knowledge is used to answer questions about why and how. The high end of the knowledge spectrum is defined as wisdom. Information has achieved the wisdom level when it is applied to make improvements in the field.
Collective Applications Model. This model, proposed by Dron and Anderson (2009), defines a cyclical framework in which data is gathered, processed, and presented. Gathering data involves selecting and capturing the data. Processing the data involves aggregating and processing the data. Presenting the data includes determining how it is displayed. If the desired detail is not displayed, then the cycle is repeated with some level of change in what data goes through the process (Dron & Anderson, 2009; Elias, 2011).
The Five-Step Learning Analytics Process. Campbell and Oblinger (2007)
proposed a five-stage model for learning analytics studies. The first stage is capturing the data. Researchers need to determine what data is needed, the level of granularity of the data, and how to retrieve that data (Campbell & Oblinger, 2007). During this stage, researchers should employ techniques to ensure the data is stored in a secure location (Pardo, 2014). Once the data is retrieved, the researcher must make decisions on how to organize the data prior to moving to the next stage of the process.
38
component of the reporting stage is the development of a dashboard that is used to display the data in a meaningful way for stakeholders (Pardo, 2014). This stage includes computation of descriptive statistics for the data, which informs end users of what has happened in the past.
The next stage of the process is to make predictions based on the data and reporting completed in the previous stage. This involves answering questions that initiated the data capture in a manner that explains what is likely to happen. An accurate prediction depends on the use of a reliable model. This stage revolves around the
generation of that model (Campbell & Oblinger, 2007).
Once a prediction is made, the next phase requires stakeholders to act on that prediction. If this stage is implemented correctly, actions will result in improvements (Pardo, 2014). These actions can be executed either manually or automatically. The number and type of interventions are based on the nature of the prediction that was made in the previous stage (Campbell & Oblinger, 2007). Depending on the type of reporting and predictions created during earlier stages of the learning analytics process, actions may be prescriptive in nature. Prescriptive actions should vary for different end users, or students, helping them to be successful.
39
evaluating the actions that take place, researchers should revisit the predictions used to determine those actions, the reporting that was used to predict, and even how the data was captured. Improvements could be made at any stage in the learning analytics process (Pardo, 2014).
Privacy and Ethics
There are potential ethical issues within the field of learning analytics. Primarily these are issues related to student privacy and ownership of the data (Reyes, 2015; Slade & Prinsloo, 2013). The Family Education Rights and Privacy Act (FERPA) is a federal law enacted to protect student privacy. This law guides institutions on how student data can be used for research, school improvement, and accountability, and when it is
necessary to inform students (U.S. Department of Education, 2012). While some students may want to opt out of studies that involve learning analytics, it could change the
interpretation of student learning in results of those studies in either a positive or a
negative manner (Brown, 2011). Since this field is in its relative infancy, students need to be ensured that any learning analytics research used beyond the classroom and instructor has all personally identifiable information removed from the data prior to release to researchers (Oblinger, 2012).
One challenge related to learning analytics is that there are few guidelines or regulations in place to guarantee anonymity (Pardo, 2014; Reyes, 2015). Since there are minimal guidelines, researchers should be clear in defining the purpose of their study as well as how the sensitive data is being handled (Slade & Prinsloo, 2013).
40
school improvement reasons, whether predictive or prescriptive, as opposed to other reasons like making a profit (Slade & Prinsloo, 2013). At times, an in-depth analysis of data may lead to conclusions that can help stakeholders increase their understanding about student retention and academic success, but it may not be actionable data. Other instances provide information in which stakeholders can take immediate action. No matter how the data is used, there should be a balance between the push to gain
knowledge against harming individuals, whether they are students or instructors (Slade & Prinsloo, 2013).
Since the results of data analysis have the potential to directly affect students and instructors, accurate interpretation of data is critical. If data are misinterpreted, there could be adverse effects. Students may become unmotivated, academic advising could be inaccurate, faculty members could lose opportunities for advancement, or the institution as a whole may lose enrollments. When acting on the data, stakeholders should keep in mind that the numbers that were analyzed represent real people. These people are part of the population, but may not have the same needs as the group (Slade & Prinsloo, 2013). An individual may be an exception to the norm or may have extenuating circumstances beyond what can be measured with the data alone, so it is essential to avoid profiling of students based on their demographic or academic characteristics. On the other hand, educators have an ethical obligation to act on the knowledge gained through the research (US Department of Education, 2012).
Uses of Data
41
placement in the hierarchy of the educational process (Jayaprakash et al., 2014; Shelton et al., 2015). Learning analytics data are used in three areas: descriptive, predictive, and prescriptive analyses (Affendey, Paris, Mustapha, Sulaiman, & Muda, 2010; Brown, 2011). Descriptive analysis helps create a portrait of past students, instructors, or other stakeholders, while predictive analysis predicts likely trends and outcomes for students prior to their experience (Affendey et al., 2010; Brown, 2011; Verbert, Manouselis, Drachsler, & Duval, 2012). Prescriptive analysis dictates interventions for various stakeholders within the educational community (Brown, 2011). Each of the user groups may use the data in a descriptive, predictive, or prescriptive manner based on their needs.
Higher Education Administrators. Higher education administrators use data analysis results in a variety of ways. Data are used to describe the student body as a whole as well as subpopulations within the university. Administrators can identify admissions prospects and predict the likelihood of their success (Dziuban et al, 2012). They detect retention issues, prescribe actions, and monitor graduation rates (Reyes, 2015). Administrators may also use data to identify issues in the learning community beyond the classroom itself that affect the success of students at the university (Pardo, 2014). Overall, the data reporting can lead to improved accountability across the
university, leading to better use of resources, and an increased reputation, both within the university and beyond (Campbell & Oblinger, 2007).
42
provides supplemental student resources benefits from learning analytics results to refine the timing and location of various services (Becker, 2013; Campbell & Oblinger, 2007).
Faculty. Both face-to-face and online faculty members can benefit from using data to inform their teaching. Data resulting from formative assessments can be used to identify knowledge gaps that can be addressed immediately in the classroom, positively helping current students (Reyes, 2015). Data from other sources, including the end of course evaluations along with LMS data, can be used in a prescriptive manner to inform adjustments to course content or pedagogy for future course offerings, particularly for online courses (Pardo, 2014). Learning analytics can encourage faculty members to take part in a self-reflection of their online teaching (Dringus, 2011). A self-reflection may encourage professional growth for faculty in the differences between face-to-face and online teaching and learning pedagogy (Shelton et al., 2015). Faculty members have the power to use learning analytics to guide students to success, affect practice, and
43
Student awareness of prescriptive analytics can lead to a more streamlined use of university resources (Campbell & Oblinger, 2007).
Government. Policy makers use data at all levels, descriptive, predictive, and prescriptive, to evaluate education on a national or regional level. The increase in learning analytics allows for new types of data use thereby expanding the ability to evaluate educational objectives. The new data can provide a different viewpoint for policy making decisions (Reyes, 2015).
Researchers. Researchers work with other stakeholders to share the information in a refined, usable format. Toward this end, researchers have a number of responsibilities. They are responsible for the validity and reliability of the data as it goes through the process of analysis and is shared with others (Reyes, 2015). Additionally, they are responsible for the de-identification of student data when details are reported beyond the classroom.
Summary of the Literature
Data has been used to inform instruction and track retention and graduation since the early years of higher education. Within the last decade, a dramatic increase in the data available has changed the way data is used in the decision-making process. Much of this is due to “big data” that is available in student information systems, learning management systems, and other longitudinal data systems. If this data is properly captured and
44
and Oblinger (2007) because it provided a framework that matched the focus of the study.
The decisions made based on the data are supported by the persistence theories established in the 1970s. These theories posited that the characteristics with which each student enters college, combined with the environment of the institution, can be used to identify reasons why a student may not succeed in their education. The review of the literature provided a comprehensive list of characteristics that were options for data collection points for this study. This study attempted to address as many of the variables listed in Table 1 as possible. However, one limitation of the purely quantitative study is that qualitative data is not available. As a result, those student characteristics included in Table 1 that are related to information about individual students or faculty choice were not available for this study. This included variables related to whether study participants accessed services offered by the university. Ultimately, this study addressed 50% of the student characteristics addressed in the literature. Those variables are indicated in Table 1 with an asterisk.
45
CHAPTER 3: METHODOLOGY Overview
This study was centered on a detailed look at the data describing the on-campus students at a university in the western region of the United States who were enrolled in 100 and 200 level courses that were offered in both face-to-face and online formats over a two-year period. The results of this study can be used to inform academic advisors on whether students should choose to take a given course online or face-to-face. The results can also be used to identify courses and academic departments where students regularly have significantly different levels of performance, based on final grade, between the face-to-face and online versions.
Method
Campbell and Oblinger (2007) and Pardo (2014) described a process for learning analytics that includes five stages. This study adopted the five stage process of capture, report, predict, act, and refine. This process was used to address the following research questions:
1. Which are important predictors from student characteristic profiles that lead to successful completion of 100 and 200 level classes taken online, as measured by final grade?
46
3. What predictors are common or differ between online and face-to-face settings?
4. Which academic departments or individual courses can be identified as significant and in need of further analysis?
For the purposes of this study, completion of a course was considered successful if a student earned a grade of a C- or better. This definition was chosen because the university requires students to earn a C- or better in all prerequisite courses in undergraduate programs.
Participants
The data collected for this study was the entire population of on-campus students who were enrolled in the set of 100 and 200 courses that are offered in both online and face-to-face formats between the Fall 2013 semester and the Summer 2015 semester at the university. The collection of 100 and 200 level courses was selected because the university offers multiple sections of these courses in both formats every term. Blended courses were excluded from the study. Additionally, these courses have higher
47
Capture
The capture process involved three phases, as can be seen in Figure 1. First was the process of data collection, followed by organizing the data, then cleaning and validating the data.
Data Collection
Prior to data collection, an application was submitted to the Insitutional Review Board (IRB), and was approved. Data was exported from the data warehouse at the university where this study took place. The information was pulled from the PeopleSoft Student Information System database. PeopleSoft is the student information system adopted by the university. A detailed list of data points collected can be reviewed in Table 2.
To initiate the data collection process, a query was run to create a comprehensive listing of all 100 and 200 level core courses that are offered in both online and face-to-face formats. This list was used to determine which records to extract from the data warehouse. Courses offered in only one format or the other were excluded from this study. A number of courses were offered in other formats including hybrid or via teleconferencing, but those course sections were excluded from this study. Additional queries were run to gather demographic information as well as details on residency, first generation status, high school GPA, and entrance exam scores.
48
49
Table 2 Data Variables
Variable Name Variable Type
Academic Information
Academic Level/Year in School Nominal
Academic Load Nominal
College Cumulative GPA Continuous
Cumulative Credits Earned Continuous
Degree Type Nominal
Entrance exam scores (math, verbal, written, composite) Discrete
Final Grade Discrete
High School GPA Continuous
Primary Major College Nominal
Successful Nominal
Term Enrolled Nominal
Term GPA Continuous
Withdrawal Nominal
Course Information
College Nominal
Course Delivery Mode Nominal/Binary
Course Code (i.e. ENG101) Nominal
Course Level Nominal/Binary
Course Section Enrollment Continuous
Course Section Full Nominal/Binary
Demographic Information
Age at Time of Enrollment Continuous
Age Category Nominal
Declared Degree Count Continuous
Declared Degree Type Nominal
Ethnicity Nominal
First Generation Student Nominal/Binary
Gender Nominal/Binary
Residential Status** Nominal
Student ID* Nominal
Note. All data is at time of course enrollment.
* A number used to identify multiple enrollments for a single student, not necessarily the university identification number.