Inter-American Development Bank Banco Interamericano de Desarrollo (BID)
Research Department Departamento de Investigación
Working Paper #578
Policy Volatility and Growth
by
Alberto Chong*
Mark Gradstein**
*Inter-American Development Bank
**Ben Gurion University/CEPR/CESifo/IZA
Cataloging-in-Publication data provided by the Inter-American Development Bank
Felipe Herrera Library
Chong, Alberto.
Policy volatility and growth / by Alberto Chong, Mark Gradstein. p. cm.
(Research Department Working paper series ; 578) Includes bibliographical references.
1. Economic development. 2. Economic policy. 3. Institutional economics. I. Gradstein, Mark. II. Inter-American Development Bank. Research Dept. III. Title. IV. Series.
©2006
Inter-American Development Bank 1300 New York Avenue, N.W. Washington, DC 20577
The views and interpretations in this document are those of the authors and should not be attributed to the Inter-American Development Bank, or to any individual acting on its behalf.
This paper may be freely reproduced provided credit is given to the Research Department, Inter-American Development Bank.
The Research Department (RES) produces a quarterly newsletter, IDEA (Ideas for Development in the Americas), as well as working papers and books on diverse economic issues. To obtain a complete list of RES publications, and read or download them please visit our web site at: http://www.iadb.org/res.
Abstract1
A growing body of recent macroeconomic evidence suggests that volatility is detrimental to economic growth. The channels through which volatility affects growth, however, are less clear; substantive evidence based on disaggregate data is almost non-existent. This paper offers a framework in which policy volatility has an adverse effect on firms’ entry into productive industries, thereby affecting economic growth. Empirical support for this relationship is based on a detailed dataset of thousands of firms from some 80 countries. Additional evidence is provided on the channels through which volatility affects firm growth, showing that institutional obstacles magnify the effect.
JEL Classification: E60, H11, O11
Keywords: Firm Growth, Policy Volatility, Institutions, Finance
1 Insightful remarks by Joshua Aizenman are gratefully acknowledged. Gianmarco León provided able research assistance. The findings and interpretations are those of the authors and do not necessarily represent the views of the Inter-American Development Bank or its corresponding executive directors. Alberto Chong: Research Department, Inter-American Development Bank, Stop B-900, 1300 New York Ave, NW, Washington, DC 20577, USA. Tel: (202) 623-1536, Fax: (202) 623-2481, E-mail: [email protected]. Mark Gradstein: Department of Economics, Ben Gurion University, Beer Sheva 84105, Israel. Tel: (972)-8-647-2288, Fax: (972)-8-647-2941, E-mail: [email protected].
1. Introduction
In contrast to the traditional view, recent research finds no evidence that policies per se are a significant predictor of economic performance, especially after controlling for proxies for institutional quality (see Easterly, 2005, for a summary). However, many researchers have suggested that volatility impairs investment and growth;2 Aizenman and Marion (1993) and Fatas and Mihov (2006) explicitly focus on proxies for policy volatility in this regard.3 Empirical support for this hypothesis has typically relied on cross-country evidence. Aghion et al. (2006) present evidence showing that the detrimental effect of policy volatility is especially strong in countries with a weak financial sector; in contrast, countries with a high level of financial development are less vulnerable and can successfully hedge off the effects of volatility. Using a different methodology, Hsieh and Parker (2006) reach the same conclusion. In contrast, Rodrik (1999), who focuses on external shocks to the world economy in the 1970s, argues that institutional strength insulates against the adverse effects of volatility. Consequently, the economic performance of countries with internal social conflicts, such as in Latin America, has suffered much more from the turbulence than countries with a stronger social structure, such as in East Asia. Fatas and Mihov (2006) present additional supporting evidence in this regard (see also the literature cited therein).4
The cross-country methodology employed in most of these papers, however, is far from ideal since the aggregate data captures too many factors that are difficult to isolate and disentangle. In particular, it is conceivable that volatility and growth are both affected by omitted variables, and the same is true with regard to the level of financial development. Thus, it is important to present complementary evidence that comes from more disaggregate data.This paper, therefore, focuses on the effects of volatility on firm growth. The growth of firms is considered a lead indicator of an economy’s strength, and as such has received a great deal of attention in the literature (Johnson et al., 2002; Rajan and Zingales, 1998; Beck et al., 2005, 2006).
2 See Aghion et al. (2006), Aizenman and Marion (1993, 1999), Easterly et al. (1993), Fatas and Mihov (2006), Hnatkovska and Loayza (2003), Kormendi and Meguire (1985), and Ramey and Ramey (1995). 3 It should be noted that the distinction between an economy’s volatility and policy volatility is not very clear; for example, some authors use inflation or exchange rate volatility as proxies for both concepts. 4 Acemoglu et al. (2003) argue that volatility is not an independent cause, but is instead itself affected by institutional quality.
Our analytical framework suggests that volatility—interpreted here as the government’s inability to create credible policy commitments—affects firms’ decisions to enter into productive industries, leading to a negative relationship between volatility and firm growth. Furthermore, this effect is shown to be stronger under weak institutions, especially with high entry barriers. Using a large dataset of more than 10,000 firms from about 80 countries, we examine two hypotheses: that volatility is detrimental to growth, and that institutional obstacles magnify the effect. Our analysis relies upon self-reported information on firms’ perceptions of obstacles to their operations, following the lead of some earlier work, such as Johnson et al. (2002) and Beck et al. (2006). While the use of survey data has its limitations, this approach also has several advantages. First, it allows a disaggregate analysis of large data. Second, the relatively detailed account of the various obstacles enables us to compare the effect of volatility on growth to that of other perceived obstacles, such as financial and legal constraints, which were earlier addressed in the literature (Johnson et al., 2002, and Beck et al., 2006). Finally, it makes possible a relatively clean test of the channel—financial or institutional—through which volatility impacts growth.
Based on the simple theoretical framework, the empirical analysis reveals that firms perceive volatility to be a significant obstacle to their growth, thus confirming one of the main conclusions of the aggregate studies. We then address the channel through which this occurs by interacting volatility measures with those of financial and institutional obstacles. We find that both channels matter, but that the institutional channel in particular retains predictive power even after controlling for the financial channel. Thus, in the last decades of the last century, Latin American countries experienced high volatility (Rodrik, 1999; Fatas and Mihov, 2006), as did several countries in East Asia (notably, South Korea). The latter’s economies, however—having a stronger institutional infrastructure—suffered much less from the volatility than the former.
These findings complement the earlier literature in two respects. First, they confirm the importance of institutions for moderating the detrimental effect of volatility on growth, as has previously been studied in a cross-country framework (Fatas and Mihov, 2006). Additionally, they contribute to the emerging work that investigates obstacles to firm growth (Beck et al., 2005, 2006). A methodological remark is in order
here. The employed measure of volatility is subjective, being based on survey data. It can be argued, however, that it is precisely the subjective assessment of volatility that matters for firm decisionmaking with regard to entry, investment and, ultimately, growth; indeed, earlier work (Johnson et al., 2002; Beck et al., 2006) has related subjective assessments of various obstacles to firm growth.
The roadmap of the paper is as follows. The next section lays out the analytical background for the empirical analysis. Section 3 contains the data description and the main empirical analysis, and Section 4 concludes.
2. Background
2.1 Previous Approaches
Two theoretical approaches, with very different empirical implications, have featured in the literature on volatility and growth. One approach emphasizes the importance of finance and is exemplified in Aghion et al. (2006). The idea is that the allocation of resources between short-term investment, long-term investment (the latter being more productive but also riskier because of future volatility), and safe bonds is subject to budget constraints. In perfect credit markets, borrowing allows firms to employ a countercyclical investment policy, thus mitigating volatility effects. In contrast, when credit markets are imperfect, borrowing becomes very costly and, consequently, long-term investment is procyclical, meaning that volatility increases while growth decreases. An empirical interpretation of this model is that volatility has an adverse effect on growth, especially when financial opportunities are limited. Indeed, the empirical test in Aghion et al. (2006), carried out on a panel of countries, establishes a negative relationship between the interactive term of volatility proxy and financial development on the one hand, and economic growth on the other. Moreover, Hsieh and Parker (2006) establish that the reduction in Chile’s tax rate in the mid-1980s was a leading factor behind subsequent growth in investment, and attribute it to the financial channel. Thus, this work stresses the significance of the financial channel as a mediator of the growth effects of volatility.
A different theory is presented in Rodrik (1999) who maintains the growth effect of volatility is mediated through domestic social conflicts and institutional ability to
manage these conflicts.5 The empirical implication is that the interactive term of volatility and institutional quality should have an effect on growth, and this indeed is shown in Rodrik (1999) to hold in the cross-country context. Specifically, by employing proxies for social tensions and for institutional quality, Rodrik (1999) shows that countries with lower levels of social conflict and with higher levels of institutional quality were much better able to cope with international crises in the 1970s than were countries with social tensions and weak institutions.
While both lines of research are in agreement as to the adverse effect of volatility on growth, they differ in regard to the channel through which this effect materializes. The former emphasize the level of financial development while the latter emphasize the level of institutional quality. Whereas individual studies provide some evidence in support of the respective hypotheses, to the best of our knowledge no comprehensive work has compared the competing views.6 Further, in a cross-country framework, such an exercise would be contaminated by additional potentially omitted variables, a situation that requires a more disaggregated analysis. To conduct such an analysis, we first present a simple theoretical framework that generates testable implications.
2.2 Framework
We now present a simple model whose empirical implications will be subsequently examined. The purpose of the model is to explicitly illustrate how firm growth can be affected by policy volatility and what role the institutional environment plays in this relationship. Therefore, we ignore the financial constraints that loom large in related work (Aghion et al., 2006, for example). In addition, the way institutional constraints are introduced is particularly suitable for the analysis of disaggregate firm growth, as opposed to Rodrik’s model (1999), for example, which focuses on country growth. Volatility here will be captured through the strategic policy uncertainty that firms face. Henisz (2004) contains a thorough discussion of how discretionary policymaking causes volatility and the aggregate growth consequences of such volatility (see also Fatas and Mihov, 2003, 2006, for related work). Specifically, Fatas and Mihov (2003) use explicit
5 In a related vein, Gradstein (2002) interprets institutional quality as the government’s ability to precommit to policies as opposed to discretionarily reacting to volatility, showing that policy commitment constitutes an insulation mechanism against shocks.
6 Aghion et al. (2006) do include a proxy for property rights protection in their regressions, arguing that their financial channel remains robust.
proxies for discretionary decisionmaking as their volatility measures. This approach does not necessarily rule out the possible effects of statistical uncertainty, such as terms of trade, but it suggests that they ultimately work through domestic policies, such as the degree of trade openness, and that the credibility as opposed to the volatility of those policies plays a crucial role in the analysis.
Specifically, suppose that firms, i, with a measure of one, produce output using capital k as the production factor. The firms can produce output in the official economy using advanced technology (which will for brevity’s sake be labeled as “industry”), or in the shadow economy using backward technology. The rental price of capital, r, will be assumed to be fixed, which is consistent with the assumption of an open economy. The firms differ with respect to their productivity parameters, and ai will denote firm i’s productivity parameter when acting officially; it is distributed according to a known density function h, h’ > 0. Letting aif(k) denote the production function, f’ > 0, f” < 0, and normalizing the output price to one, the firm’s operating profits are calculated as follows:
Pi= ai f(k) – rk (1)
These profits will be taxed. Letting T denote the tax rate, Pi (1-T) are after-tax operating profits. Further, entry into the industry is associated with the exogenous cost of C, which can be interpreted as fees and regulation costs, and is incurred up front; a higher C would imply a lower level of institutional quality. The negative macro consequences of entry costs have been recently well documented in Djankov et al. (2002). These assumptions imply that the net profits of a firm in the industry are given by:
Pi(1-T) – C = [ai f(k) – rk](1-T) – C (2)
Firms can avoid both the set-up costs, C, and taxes. They could, for example, move activities abroad where these are cheaper; they could cease operating as a business; or—our favored interpretation—they could go underground. It is assumed that this reduces their productivity, however. To further simplify matters, and without much loss of substance, the profits in this case are normalized to zero. Thus, industry production generates more output, whereas underground production is inferior in this regard.
Firms make two types of decisions: whether to enter the industry, and—if so— how much capital to employ. We denote N as the set of firms in the industry, and n as
their number. The government determines the tax rate T. This is assumed to maximize the tax revenue, R, less the excess burden cost of raising taxes. The latter will be assumed to be exogenously given φ(T), φ’, φ” > 0, and its interpretation is being related to designing, monitoring, and enforcing the tax collection mechanism.
Since the tax revenue is given by: R = T
∫
∈ − N i i i if k rk a ( ) ] [ (3)the government’s objective function is as follows: G = T
∫
∈ − N i i i if k rk a ( ) ] [ - φ(T (4)The exact specification of the government’s objective function, particularly the relative weights of the tax revenues and the excess tax burden, is immaterial for the substance of the ensuing analysis.
We distinguish between two regime types. Under the benchmark regime, the government has the ability to commit to the tax rate; firms’ decisions are then made subsequent to its determination. Alternatively, when there is policy volatility, the government determines the tax rate ex post the firms’ decisions, particularly after the firms have incurred entry costs. Thus, we interpret policy volatility as the lack of a credible policy commitment.
2.3 Analysis
Since an operating firm’s optimal choice of capital input maximizes (2), the first-order condition that equates marginal productivity to the rental price,
ai f’(k) – r = 0 (5)
determines the optimal amount of capital, ki = k(ai). Furthermore, the differentiation of (5) reveals that this is an increasing function, so that more productive firms make a larger capital investment.
2.3.1 Commitment Regime
Under the commitment regime, the firms make their entry decisions knowing the tax rate T. It is easy to see that only sufficiently productive firms choose to enter the industry, where the break-even productivity level, a*, is given by:
[a*f(k(a*)) – r k(a*)](1-T) – C = 0 (6) Differentiating (6) we obtain:7
Proposition 1. Higher taxes and a weaker institutional environment decrease the
number of firms entering the industry. Furthermore, the detrimental effect of taxes on firm entry is aggravated by a weak institutional environment.
The detrimental growth effect of taxes, exacerbated in a weak institutional environment, then follows from the fact that industry productivity is relatively high. Cross-country evidence on the adverse effects of corporate taxes on growth is provided in Lee and Gordon (2005); Cullen and Gordon (2002), show more specifically that corporate taxes deter entrepreneurship.
The government’s tax revenue then is: R = T af k rk h a da a a ) ( ] ) ( [ *
∫
> − (7)and the objective function is:
G = T af k rkh a da a a ) ( ] ) ( [ *
∫
> − - φ(T) (8)In other words, the government chooses the tax rate so as to maximize G while correctly anticipating the effect of its choice on firms’ decisions. While an increase in the tax rate increases the revenue collected from the firms that are expected to enter the industry, it also decreases the tax base by limiting entry (Proposition 1). Differentiation of (8) while employing the envelope theorem leads to the following first-order condition, which balances the above considerations while taking into account the excess tax burden:
7 The proofs are in the Appendix.
da a h rk k af a a ) ( ] ) ( [ *
∫
> − - [a*f(k(a*)) – r k(a*)]da*/dT - φ’(T) = 0 (9)Equations (6) and (9) thus determine equilibrium entry decisions and the tax rate. 2.3.2 Lack of Commitment
In this case, the tax rate choice cannot affect firms’ decisions. Maximization of (4) leads then to the first-order condition:
∫
∈ − N i i i if k rk a ( ) ] [ - φ’(T) = 0 (10)Anticipating this, the firms then make their industry entry decisions. As before, only sufficiently productive firms enter; the cutoff, a**, is given by:
[a**f(k(a**)) – r k(a**)](1-T) – C = 0 (11) Using the cutoff, equation (10) can be rewritten as follows:
∫
> − * * ) ( ] ) ( [ a a da a h rk k af - φ’(T) = 0 (10’)Equations (10’) and (11) determine the equilibrium in this case. 2.3.3 Comparison of Regimes
Comparing the two regimes, the commitment regime given by (6) and (9) and the non-commitment regime given by (10’) and (11), and employing the second-order conditions, we note that, given that C > 0, the commitment regime leads to a smaller tax rate than the non-commitment regime. The reason, of course, is that under the latter, the entry effect of taxation is taken into consideration, while under the former it is not. Recalling Proposition 1, this then implies that under the commitment regime, a larger fraction of firms enter the industry, hence the firm growth rate is higher. In contrast, when C = 0, there is no difference in outcomes between the two regimes. Thus, a weak institutional arrangement is essential for driving a wedge between the two regimes.
We summarize these observations as follows:
Proposition 2. With weak institutions, the commitment regime leads to a
industry than under the non-commitment regime. With strong institutions, C = 0, and the two regimes lead to identical outcomes.
Recalling that industry production is more advantageous, this implies that policy volatility is detrimental to capital investment, firm growth, and profitability. We next proceed to empirically assess the implications of the link between volatility and growth.
3. Empirical Analysis
3.1 Data and Basic Statistics
We use the World Business Environment Survey (WBES) data available at the World Bank website.8 The sample consists of firm-level survey responses from more than 10,000 firms in more than 80 large and small countries, many of them developing and in transition. The survey asked each business to rank the constraints or problems that affected their operations. This process involved an extensive questionnaire undertaken by means of a face-to-face interview with either the firm manager or firm owner of each company. As a result, the survey reports comparative measurements based on firms’ perceptions about the investment climate as shaped by economic policy, governance and corruption, regulation and taxes, infrastructure, public service quality, predictability of economic developments and policies, and financial constraints, as well as on firm size, growth, and other characteristics.
Table 1. Variable Definitions
Variable Source
Firms’ characteristics
Sales growth in the last
three years (%) Answer to the question: Please estimate the growth of your company’s sales over the past three years. Company is owned by a
foreign investor Answer to the question on the nationality of the owners. Government owns the
company
Answer to the question on the ownership of the firm. Service The firm belongs to the services sector.
WBES
Macroeconomic context
Log(GDP pc) Logarithm of the average per capita GDP for the period 1995-1999. Expressed in constant 2000 US dollars.
GDP growth (%) Average GDP growth (%) for the period 1995-1999. WDI French legal origin Identifies the legal origin of the Company Law or Commercial Code of
each country. Equals 1 if the origin is the French Commercial Code and
zero otherwise. WDI
Table 1., continued Policy volatility
Economic predictability Answer to the question: Do you regularly have to cope with unexpected changes in economic and financial policies which materially affect your business? Changes in economic and financial policies are: (1) completely predictable; (2) highly predictable; (3) fairly predictable; (4) fairly unpredictable; (5) highly unpredictable; (6) completely unpredictable. Policy instability Answer to the question: Please judge on a four point scale how
problematic are the following factors for the operation and growth of your business: Policy instability/uncertainty. (1) No obstacle; (2) Minor obstacle; (3) Moderate obstacle; (4) Major obstacle.
WBES
Institutions
Judiciary Answer to the question: Please judge on a four point scale how problematic are the following factors for the operation and growth of your business: Functioning of the judiciary. (1) No obstacle; (2) Minor obstacle; (3) Moderate obstacle; (4) Major obstacle.
Corruption Answer to the question: Please judge on a four point scale how problematic are the following factors for the operation and growth of your business: Corruption. (1) No obstacle; (2) Minor obstacle; (3) Moderate obstacle; (4) Major obstacle.
Courts Answer to the question: In resolving business disputes, do you believe your country’s court system to be affordable. (1) always, (6) never.
WBES
Financial Constraints
Financial obstacles Answer to the question: Please judge on a four point scale how problematic are the following factors for the operation and growth of your business: Financing. (1) No obstacle; (2) Minor obstacle; (3) Moderate obstacle; (4) Major obstacle.
WBES
The survey, an initiative of the World Bank Group and its partner institutions, had the following objectives: (i) to provide feedback from enterprises on the state of the private sector in client countries; (ii) to measure the quality of governance and public services, including the extent of corruption; (iii) to provide better information on constraints to private-sector growth, from an enterprise perspective; (iv) to establish the basis for internationally comparable indicators that can track changes in the business environment over time, thus allowing for both competitive assessments and impact assessments of market-oriented reforms; and (v) to stimulate systematic public-private dialogue on business perceptions and the agenda for reform. The field work for the survey was carried out between 1999 and 2000 and consisted of private polling of firms that fulfilled the basic requirements regarding sector, size, location, and ownership characteristics.9 The objective was to gather information on a sizeable number of firms in
9 The particular requirements that had to be filled by the selected sample were as follows. Sector: in each country, the sectoral composition in terms of manufacturing (including agro-processing) versus services
several countries around the world, an objective that was accomplished for most of the sample.10
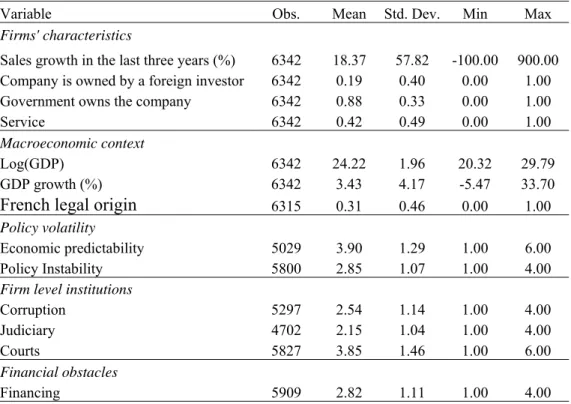
Table 2. Summary Statistics
Variable Obs. Mean Std. Dev. Min Max
Firms' characteristics
Sales growth in the last three years (%) 6342 18.37 57.82 -100.00 900.00 Company is owned by a foreign investor 6342 0.19 0.40 0.00 1.00 Government owns the company 6342 0.88 0.33 0.00 1.00
Service 6342 0.42 0.49 0.00 1.00
Macroeconomic context
Log(GDP) 6342 24.22 1.96 20.32 29.79
GDP growth (%) 6342 3.43 4.17 -5.47 33.70
French legal origin 6315 0.31 0.46 0.00 1.00
Policy volatility
Economic predictability 5029 3.90 1.29 1.00 6.00
Policy Instability 5800 2.85 1.07 1.00 4.00
Firm level institutions
Corruption 5297 2.54 1.14 1.00 4.00
Judiciary 4702 2.15 1.04 1.00 4.00
Courts 5827 3.85 1.46 1.00 6.00
Financial obstacles
Financing 5909 2.82 1.11 1.00 4.00
We merged the firm-level data obtained through the WBES with country-level control variables such as GDP per capita and growth, which were taken from the World Development Indicators (World Bank, 2005). These variables were used as five-year averages in order to avoid capturing some noise due to the natural volatility of macroeconomic variables. Additionally, we used the origin of a country’s legal system as (including commerce) will be determined by relative contribution to GDP, subject to a 15 percent minimum for each category. Size: at least 15 percent of the sample shall be in the small and 15 percent in the large size categories. Ownership: at least 15 percent of the firms will have foreign control. Exporters: at least 15 percent of firms will be exporters, meaning that some significant share of their output is exported. Location: at least 15 percent of firms will be in the category “small city or countryside.”
10 The countries and number of firms (in parentheses) included in the survey are: Cambodia (258), China (68), Indonesia (70), Malaysia (36), Philippines (84), Thailand (324), Albania (89), Armenia (95), Azerbaijan (68), Belarus (95), Bosnia (65), Bulgaria (99), Croatia (90), Czech Rep (72), Estonia (106), Georgia (77), Hungary (95), Kazakhstan (86), Kyrgyzstan (65), Lithuania (68), Moldova (83), Poland (167), Romania (96), Russia (378), Slovakia (86), Turkey (111), Ukraine (167), Uzbekistan (94), Bangladesh (34), India (135), Pakistan (56), Canada (68), France (56), Germany (59), Italy (56), Portugal (49), Spain (65), Sweden (71), United Kingdom (56), United States (65), Argentina (77), Belize (18), Bolivia (65), Brazil (133), Chile (71), Colombia (80), Costa Rica (52), Dominican Republic (76), Ecuador (47), El Salvador (48), Guatemala (53), Haiti (46), Honduras (46), Mexico (38), Nicaragua (56), Panama (48), Peru (66), Trinidad and Tobago (60), Uruguay (56), Venezuela (57), and the West Bank-Gaza (27).
a country institutional proxy. As has become customary in the literature, we distinguish between French and non-French legal origins and use them as dummy variables. The questions used as proxies of policy volatility, financial obstacles, and institutions as well as all other variables employed in this paper are described in Table 1. Table 2 contains descriptive statistics and Table 3 presents a basic correlation matrix with corresponding p-values.
Table 3. Correlation Matrix Sales growth in last three years (%) Company is owned by foreign investor Government owns the company Services Log (GDP) GDP growth (%) French legal origin Economic predictability Policy instability
Corruption Courts Judiciary
0.049
Company is owned by
a foreign investor 0.000
0.018 0.015
Government owns the
company 0.192 0.287 Services 0.015 -0.053 0.075 0.264 0.000 0.000 Log (GDP) 0.044 0.080 0.101 0.049 0.001 0.000 0.000 0.000 GDP growth (%) 0.088 0.046 -0.011 -0.003 -0.204 0.000 0.001 0.409 0.827 0.000
French legal origin -0.080 0.087 0.141 0.036 0.123 0.017
0.000 0.000 0.000 0.005 0.000 0.178 Economic predictability -0.020 -0.078 0.029 -0.013 -0.024 -0.109 -0.111 0.158 0.000 0.040 0.345 0.086 0.000 0.000 -0.071 -0.059 0.042 0.002 0.004 -0.107 0.072 0.197 Policy Instability 0.000 0.000 0.001 0.868 0.749 0.000 0.000 0.000 -0.043 -0.038 0.097 -0.046 -0.137 -0.036 0.107 0.071 0.392 Corruption 0.002 0.006 0.000 0.001 0.000 0.009 0.000 0.000 0.000 -0.054 -0.001 0.012 -0.017 -0.032 -0.018 0.130 0.071 0.368 0.551 Judiciary 0.000 0.946 0.420 0.244 0.026 0.222 0.000 0.000 0.000 0.000 Courts -0.047 -0.018 0.113 0.030 0.083 0.026 0.044 0.067 0.116 0.122 0.191 0.000 0.174 0.000 0.020 0.000 0.045 0.001 0.000 0.000 0.000 0.000 -0.060 -0.159 -0.053 -0.089 -0.053 -0.098 -0.039 0.102 0.214 0.262 0.016 0.179 Financing 0.000 0.000 0.000 0.000 0.000 0.000 0.003 0.000 0.000 0.000 0.230 0.000
3.2 Results
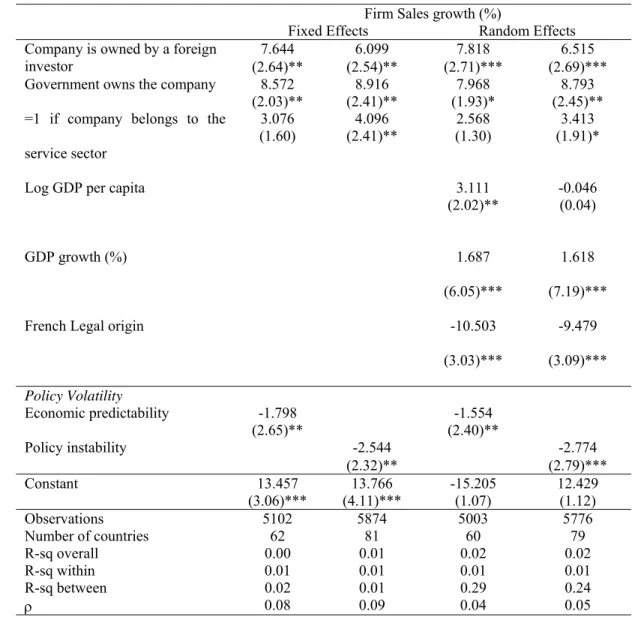
We first run a simple specification, running firm sales growth on volatility proxies and additional firm-level and macro-level controls.11 The analysis focuses on two volatility proxies: economic predictability and policy instability. The results, using country fixed effects and random effects, are shown in Table 4.
Table 4. Policy Volatility and Firm Growth
Firm Sales growth (%)
Fixed Effects Random Effects
7.644 6.099 7.818 6.515 Company is owned by a foreign
investor (2.64)** (2.54)** (2.71)*** (2.69)***
8.572 8.916 7.968 8.793 Government owns the company
(2.03)** (2.41)** (1.93)* (2.45)** 3.076 4.096 2.568 3.413 =1 if company belongs to the
service sector (1.60) (2.41)** (1.30) (1.91)*
3.111 -0.046
Log GDP per capita
(2.02)** (0.04)
GDP growth (%) 1.687 1.618
(6.05)*** (7.19)***
French Legal origin -10.503 -9.479
(3.03)*** (3.09)*** Policy Volatility Economic predictability -1.798 -1.554 (2.65)** (2.40)** -2.544 -2.774 Policy instability (2.32)** (2.79)*** Constant 13.457 13.766 -15.205 12.429 (3.06)*** (4.11)*** (1.07) (1.12) Observations 5102 5874 5003 5776 Number of countries 62 81 60 79 R-sq overall 0.00 0.01 0.02 0.02 R-sq within 0.01 0.01 0.01 0.01 R-sq between 0.02 0.01 0.29 0.24 ρ 0.08 0.09 0.04 0.05
Robust z-statistics in parentheses. Standard errors adjusted for clusters in each country; (*) significant at 10 percent; (**) significant at 5 percent; (***) significant at 1 percent.
11 The specification employed here loosely follows Beck et al. (2005). When using broad variations of the specification employed in this paper, we obtain very similar results.
Both economic unpredictability and policy instability as perceived by the firms have a statistically significant negative effect on sales growth. Among firm-level characteristics, foreign ownership matters and is associated with a higher rate of sales growth. Government-owned firms seem also to have grown faster, although the findings here are not as robust.12 Country-level economic growth is positively related to firm growth, and the legal origin variable is significant too; countries whose legal system is rooted in the French tradition have a slower rate of firm growth.
Volatility appears to be not only statistically significant, but also economically meaningful. Thus, a one-level increase in the scale of economic unpredictability decreases firm growth by about 1.5 percent; and a similar increase in political instability is associated with a growth drop of more than 3 percent. It is noteworthy that the explicit perception of policy instability has an even stronger association with firm growth than economic predictability. These results are generally consistent with those in the earlier literature, for example, Aizenman and Marion (1993, 1999), Fatas and Mihov (2006), and Hnatkovska and Loayza (2003), who discern the detrimental growth effects of volatility in cross-country contexts.
12 In some specifications, not reported here, firm age (years since it was established) is negatively associated with firm growth, implying that younger firms grow faster than older ones.
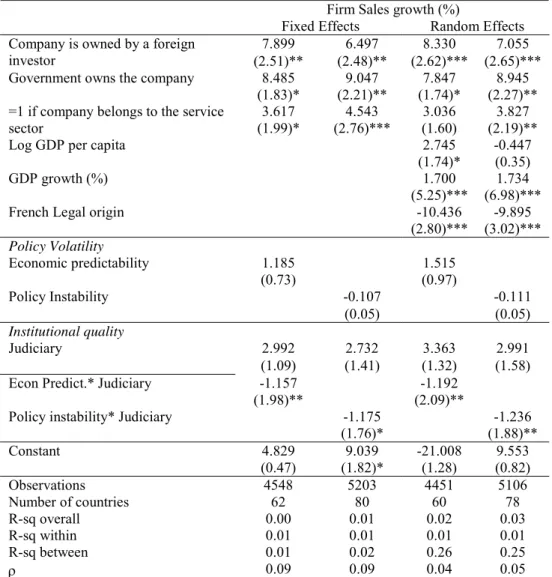
Table 5. Policy Volatility, Institutional Quality, and Firm Growth: Interactive Terms
Our next step then is to determine the channel through which volatility affects growth. As discussed above, the two main channels suggested by the theoretical analyses as well as by some macroeconomic evidence are the financial channel and the institutional channel. Consequently, we now add to our basic specification measures representing each of these two channels, as well as corresponding interactive terms with our volatility proxies. We first study the institutional link by using a perception proxy on the quality of the judiciary, which we believe encompasses the
Firm Sales growth (%)
Fixed Effects Random Effects
7.899 6.497 8.330 7.055
Company is owned by a foreign
investor (2.51)** (2.48)** (2.62)*** (2.65)***
8.485 9.047 7.847 8.945
Government owns the company
(1.83)* (2.21)** (1.74)* (2.27)**
3.617 4.543 3.036 3.827
=1 if company belongs to the service
sector (1.99)* (2.76)*** (1.60) (2.19)**
Log GDP per capita 2.745 -0.447
(1.74)* (0.35)
GDP growth (%) 1.700 1.734
(5.25)*** (6.98)***
French Legal origin -10.436 -9.895
(2.80)*** (3.02)*** Policy Volatility 1.185 1.515 Economic predictability (0.73) (0.97) -0.107 -0.111 Policy Instability (0.05) (0.05) Institutional quality 2.992 2.732 3.363 2.991 Judiciary (1.09) (1.41) (1.32) (1.58) -1.157 -1.192 Econ Predict.* Judiciary
(1.98)** (2.09)**
-1.175 -1.236
Policy instability* Judiciary
(1.76)* (1.88)** Constant 4.829 9.039 -21.008 9.553 (0.47) (1.82)* (1.28) (0.82) Observations 4548 5203 4451 5106 Number of countries 62 80 60 78 R-sq overall 0.00 0.01 0.02 0.03 R-sq within 0.01 0.01 0.01 0.01 R-sq between 0.01 0.02 0.26 0.25 ρ 0.09 0.09 0.04 0.05
Robust z-statistics in parentheses. Standard errors adjusted for clusters in each country; (*) significant at 10 percent; (**) significant at 5 percent; (***) significant at 1 percent
general institutional constraints faced by firms.13 The inclusion of these variables results in both volatility proxies losing their statistical significance.14 However, the interactive terms of economic predictability and policy volatility with the institutional variable are all statistically significant at conventional levels, suggesting that the adverse growth effect of volatility is mediated through institutional quality.15 These findings are shown in Table 5.
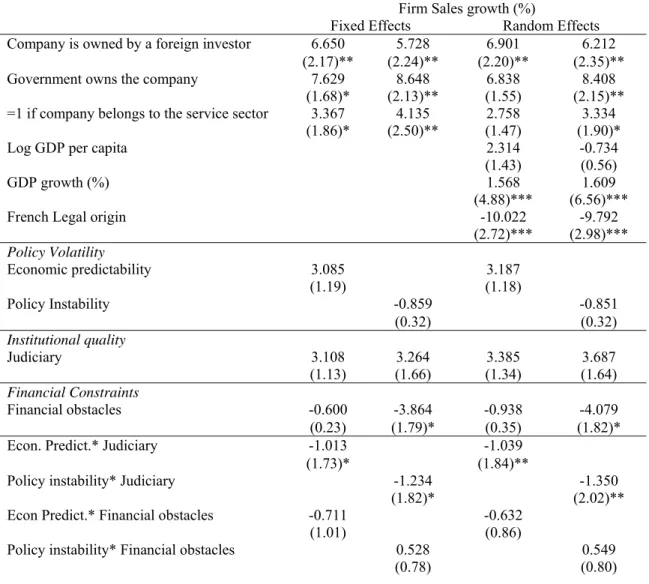
Table 6. Policy Volatility, Institutional Quality, Financial Obstacles and Firm Growth: Interactive Terms
Firm Sales growth (%)
Fixed Effects Random Effects
6.650 5.728 6.901 6.212 Company is owned by a foreign investor
(2.17)** (2.24)** (2.20)** (2.35)** 7.629 8.648 6.838 8.408 Government owns the company
(1.68)* (2.13)** (1.55) (2.15)** 3.367 4.135 2.758 3.334 =1 if company belongs to the service sector
(1.86)* (2.50)** (1.47) (1.90)*
Log GDP per capita 2.314 -0.734
(1.43) (0.56)
GDP growth (%) 1.568 1.609
(4.88)*** (6.56)***
French Legal origin -10.022 -9.792
(2.72)*** (2.98)*** Policy Volatility 3.085 3.187 Economic predictability (1.19) (1.18) -0.859 -0.851 Policy Instability (0.32) (0.32) Institutional quality 3.108 3.264 3.385 3.687 Judiciary (1.13) (1.66) (1.34) (1.64) Financial Constraints -0.600 -3.864 -0.938 -4.079 Financial obstacles (0.23) (1.79)* (0.35) (1.82)* -1.013 -1.039 Econ. Predict.* Judiciary
(1.73)* (1.84)** -1.234 -1.350 Policy instability* Judiciary
(1.82)* (2.02)** -0.711 -0.632 Econ Predict.* Financial obstacles
(1.01) (0.86) 0.528 0.549 Policy instability* Financial obstacles
(0.78) (0.80)
13 The role of the judiciary as a crucial variable in the performance of countries has been recently stressed by La Porta et al. (2004) and Djankov et al. (2003). The definition of this variable is shown in Table 1.
14 In the case of economic predictability, the sign switches but, as mentioned in the text, the corresponding coefficients are not statistically significant at conventional levels.
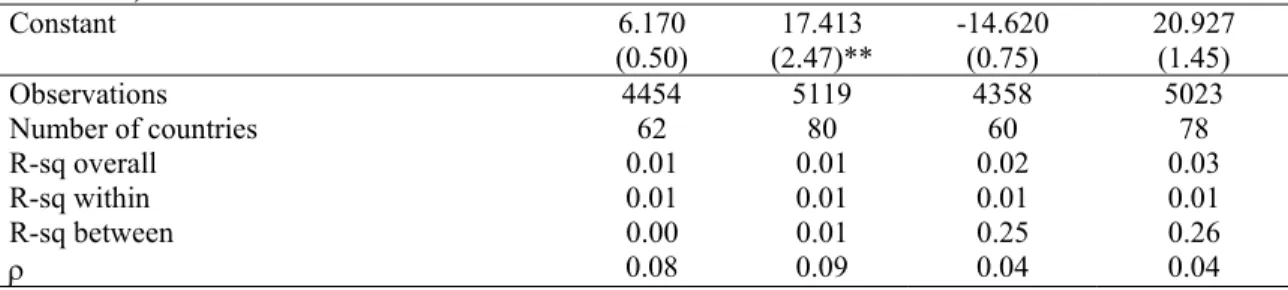
Table 6., continued Constant 6.170 17.413 -14.620 20.927 (0.50) (2.47)** (0.75) (1.45) Observations 4454 5119 4358 5023 Number of countries 62 80 60 78 R-sq overall 0.01 0.01 0.02 0.03 R-sq within 0.01 0.01 0.01 0.01 R-sq between 0.00 0.01 0.25 0.26 ρ 0.08 0.09 0.04 0.04
Robust z-statistics in parentheses. Standard errors adjusted for clusters in each country; (*) significant at 10 percent; (**) significant at 5 percent; (***) significant at 1 percent.
These results seem to suggest, therefore, that strong institutional quality, as measured by the functioning of the judiciary, ameliorates the generally negative effect of volatility on firm growth. Since much of the earlier work underscores the importance of the financial channel in this regard, it is interesting to see whether the institutional channel retains its significance in the presence of the financial variables. Hence, in Table 6, the volatility proxies are interacted not only with the proxies for institutional obstacles but also with those for financial constraints. This latter variable is measured by the extent to which firms perceive that financial obstacles impede firm development and growth.16 As can be seen, our interacted institutional proxy retains its statistical significance, whereas the policy volatility-interacted financial variable yields a coefficient that is never statistically significant at conventional levels (and sometimes yields the wrong sign), suggesting that institutional quality may even trump the importance of the financial channel. In fact, it appears that, whereas the link between institutions and firm growth is essentially given through the interactions between institutions and policy volatility and far less through a direct institutional channel, the financial variable appears to have a direct effect on firm sales growth, but not through interactions with policy volatility. This is reflected by the fact that the financial obstacle term in the regressions tends to be statistically significant, but the corresponding interactive term with policy volatility never is. On the contrary, the institutional variable is never statistically significant, but the interactive term is always significant at conventional levels.
16 This variable has been employed in previous empirical research on financial constraints. See Beck et al. (2005). The definition of this variable is shown in Table 1.
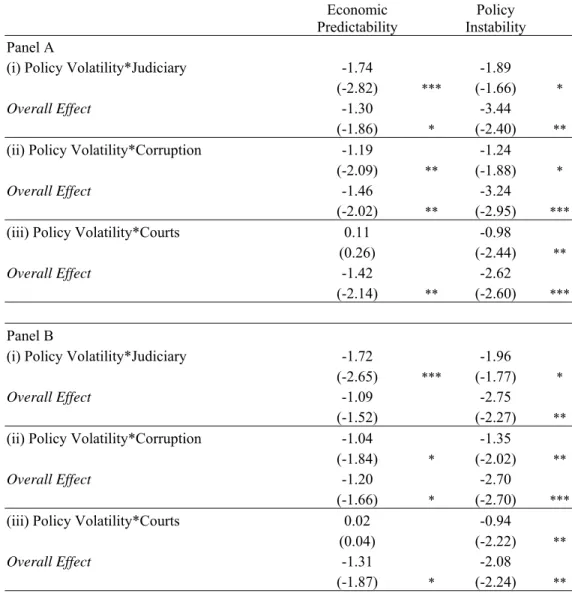
Table 7. Robustness to Changes in Proxies
Predictability Economic Instability Policy Panel A
(i) Policy Volatility*Judiciary -1.74 -1.89
(-2.82) *** (-1.66) *
Overall Effect -1.30 -3.44
(-1.86) * (-2.40) **
(ii) Policy Volatility*Corruption -1.19 -1.24
(-2.09) ** (-1.88) *
Overall Effect -1.46 -3.24
(-2.02) ** (-2.95) ***
(iii) Policy Volatility*Courts 0.11 -0.98
(0.26) (-2.44) **
Overall Effect -1.42 -2.62
(-2.14) ** (-2.60) ***
Panel B
(i) Policy Volatility*Judiciary -1.72 -1.96
(-2.65) *** (-1.77) *
Overall Effect -1.09 -2.75
(-1.52) (-2.27) **
(ii) Policy Volatility*Corruption -1.04 -1.35
(-1.84) * (-2.02) **
Overall Effect -1.20 -2.70
(-1.66) * (-2.70) ***
(iii) Policy Volatility*Courts 0.02 -0.94 (0.04) (-2.22) **
Overall Effect -1.31 -2.08
(-1.87) * (-2.24) **
Robust z-statistics in parentheses. Standard errors adjusted for clusters in each country; (*) significant at 10 percent; (**) significant at 5 percent; (***) significant at 1 percent. Results in Panel A are based on the same random effects specification employed in Table 5. Results in Panel B are based on the same random effects specification employed in Table 6. The overall effects are evaluated at the mean of the corresponding variable.
We further pursue the above analysis by testing the robustness of our findings to changes in institutional proxies.17 In particular, we employ two additional variables, corruption and affordability of courts, which we believe are also consistent with the underlying rationale of the model. In this case, and for the sake of economy, we do not present the full regression results but
17 We also tested a broad array of financial variables. Remarkably, we obtain very similar results. Furthermore, in order to further test the robustness of our findings, we tested a broad array of different specifications and included other variables such as GDP growth, economic sectors, inflation, terms of trade, and openness. In fact, our results do not change. All these additional results are available upon request.
focus only on the coefficients of our variables of interest as well as on the overall effects on firm sales growth. Our findings are shown in Table 7. When replicating the specification of Table 5 (without financial variables), we find that regardless of the institutional and volatility proxies employed, the interactive term between policy volatility and institutions is almost always negative and statistically significant at conventional levels. Furthermore, the overall effects of policy volatility on firm growth are negative and statistically significant regardless of the institutional proxy employed. This is shown in Panel A. Similarly, when replicating the specification of Table 6 (with financial variables and interactions), we also find that the interactive term between institutions and volatility tends to be negative and statistically significant in most cases. The corresponding overall effect of policy volatility on firm growth is also statistically significant.18 These results are shown in Panel B in Table 7.
4. Concluding Remarks
This paper contributes to the literature on volatility and growth in three ways. First, it provides an analytical framework that identifies the effect of policy volatility on firm growth. Then, using unique firm-level survey data, it empirically establishes the existence of such an effect, thus reinforcing the extant macroeconomic findings. Finally, it theorizes that weak institutions magnify the detrimental growth effect of volatility and finds preliminary support in the data for this hypothesis. These findings complement the existing macroeconomic literature that also identifies volatility as an impediment to growth. While underscoring the significance of institutional quality in mediating this relationship, this paper also complements work that emphasizes the financial channel.
In this paper, volatility is a somewhat generic term, although an attempt is made to distinguish between economic and policy volatility. Future research would hopefully shed further light on what specific aspects of volatility are especially detrimental for growth.
18 Unlike the very few available firm-level growth studies, we apply an instrumental variables approach using the following instruments: (i) number of recessions and black market premium as instruments for policy volatility; (ii) number of bank bankruptcies as an instrument for financial constraints, and (iii) ethnolinguistic fractionalization and continental dummies as instruments for institutional quality. While not perfect instruments, they do pass overidentifying restriction tests. Applying the corresponding instrumental variables approach in both fixed effects and random effects gives similar results to the ones presented here. In particular, the interactive terms between institutions and firm growth remain negative and statistically significant. Also, when using national-level institutional variables such as the well-known ICRG index (Knack and Keefer, 1995), we obtain results very similar results to those shown here. All variables are from the World Bank (2005). We would be glad to provide these additional results upon request.
Appendix
1. Proof of Proposition 1
Differentiating (6) we obtain:
∂a*/∂T = [a*f(k(a*)) – r k(a*)]/[ f(k(a*))(1-T)] > 0 (A1) and
∂a*/∂C = 1/[ f(k(a*))(1-T)] > 0 (A2) and
∂2a*/∂T ∂C = - [f’(dk/da*)(1-T) - f]/[ f(k(a*))(1-T)]2 > 0 (A3)
Thus, the fraction of entering firms, n = 1-h(a*), decreases in T and in C; and the sensitivity of entry with respect to T increases in C.
2. Proof of Proposition 2
For C > 0, comparing (9) and (10’), we observe that the left-hand side in the latter exceeds that in the former. Since the second-order conditions imply that these respective expressions decrease in T, we obtain the result that the tax rate is smaller under the commitment regime. Since the only difference between equations (6) and (11) determining firms’ entry is the tax rate, it follows from Proposition 1 that a* < a**, so that fewer firms enter the industry under the non-commitment regime, which in turn implies slower overall growth. In contrast, when C = 0, entry is costless, and a choice of tax rate does not affect the firms’ decisions to enter.
References
Acemoglu, D., S. Johnson, J. Robinson, and Y. Thaicharoen. 2003. “Institutional causes, macroeconomic symptoms: Volatility, crises and growth.” Journal of Monetary Economics 50: 49-123.
Aghion, P., G-M. Angeletos, A. Banerjee, and K. Manova.2006. “Volatility and growth: Credit constraints and productivity-enhancing investment.” National Bureau of Economic Research (NBER)Working Paper 11349. Cambridge, Mass.: NBER.
Aizenman, J. and N. Marion. 1993. “Policy uncertainty, persistence and growth.” Review of International Economics 1: 145–163.
----. 1999. “Volatility and investment: Interpreting evidence from developing countries,” Economica 66: 157-79.
Beck, T., A. Demirguc-Kunt, and V. Maksimovic. 2005. “Financial and legal constraints to firm growth: Does firm size matter?” Journal of Finance, forthcoming.
Beck, T., A. Demirguc-Kunt, L. Laeven, and R. Levine. 2006. “Finance, firm size, and growth.” Mimeo. Washington, D.C.: World Bank.
Cullen, J.B. and R.H. Gordon. 2002. “Taxes and entrepreneurial activity: Theory and evidence for the Unites States.” National Bureau of Economic Research (NBER) Working Paper 9015. Cambridge, Mass.: NEBR.
Djankov, S., R. La Porta, F. Lopez-de-Silanes, and A. Shleifer. 2002. “The regulation of entry,” Quarterly Journal of Economics 117: 1-37.
----. 2003. “Courts,” Quarterly Journal of Economics 118(2): 453-517.
Easterly, W. 2005. “National policies and economic growth.” In: P. Aghion and S. Durlauf, eds. Handbook of Economic Growth. Amsterdam: Elsevier.
Easterly, W., M. Kremer, L. Pritchett, and L. Summers. 1993. “Good policy or good luck? Country growth performance and temporary shocks.” Journal of Monetary Economics 32: 459-483.
Fatas, A. and I. Mihov. 2003. “The case for restricting fiscal policy discretion.” Quarterly Journal of Economics 118(4): 1419-1447.
----. 2006. “Policy volatility, institutions, and economic growth.” Centre for Economic Policy
Gradstein, M. 2002. “Rules, stability, and growth.” Journal of Development Economics 67: 471-484.
Henisz, W. 2004. “Political institutions and policy volatility.” Economics and Politics, 16: 1-27. Hnatkovska, V. and N. Loayza. 2003. “Volatility and growth.” Mimeo. Washington, D.C.:
World Bank.
Hsieh, C-T. and J.A. Parker. 2006. “Taxes and growth in a financially underdeveloped country: Evidence from the Chilean investment boom,” mimeo.
Johnson, S., J. McMillan and C. Woodruff. 2002. “Property rights and finance.” American Economic Review 92(5): 1335-1356.
Kormendi, R. and P. Meguire. 1985. “Macroeconomic determinants of growth.” Journal of Monetary Economics 16:141-163.
Knack, S. and P. Keefer. 1995. “Institutions and Economic Performance: Cross-Country Tests Using Alternative Institutional Measures.” Economics and Politics 7: 207-227.
La Porta, R., C. Pop-Echeles, F. Lopez-de-Silanes, and A. Shleifer. 2004. “Judicial Checks and Balances.” Journal of Political Economy 112: 445-470.
Lee, Y. and R.H. Gordon. 2005. “Tax structure and economic growth.” Journal of Public Economics 89(5-6): 1027-1043.
Rajan, R. and L. Zingales. 1998. “Financial dependence and growth.” American Economic Review 88: 559-586.
Ramey, G. and V. Ramey. 1995. “Cross-country evidence on the link between volatility and growth.” American Economic Review 85: 1138-51.
Rodrik, D. 1999. “Where did all the growth go? External shocks, social conflict, and growth collapses.”Journal of Economic Growth 4: 385-412.
World Business Environment Survey (WBES).Washington, D.C.: World Bank.
http://info.worldbank.org/governance/wbes/.