Content-based Alert Correlation
Ke Wang
Submitted in partial fulfillment of the requirements for the degree
of Doctor of Philosophy
in the Graduate School of Arts and Sciences
COLUMBIA UNIVERSITY
2006Ke Wang All Rights Reserved
Network Payload-based Anomaly Detection and
Content-based Alert Correlation
Ke Wang
Every computer on the Internet nowadays is a potential target for a new attack at any moment. The pervasive use of signature-based anti-virus scanners and misuse detection Intrusion Detection Systems have failed to provide adequate protection against a constant barrage of “zero-day” attacks. Such attacks may cause denial-of-service, system crashes, or information theft resulting in the loss of critical information. In this thesis, we consider the problem of detecting these “zero-day” intrusions quickly and accurately upon their very first appearance.
Most current Network Intrusion Detection Systems (NIDS) use simple features, like packet headers and derived statistics describing connections and sessions (packet rates, bytes transferred, etc.) to detect unusual events that indicate a system is likely under attack. These approaches, however, are blind to the content of the packet stream, and in particular, the packet content delivered to a service that contains the data and code that exploits the vulnerable application software. We conjecture that fast and efficient detectors that focus on network packet content anomaly detection will improve defenses and identify zero-day attacks far more accurately than approaches that consider only header information.
We therefore present two payload-based anomaly detectors, PAYL and Anagram, for intrusion detection. They are designed to detect attacks that are otherwise normal connec-tions except that the packets carry bad (anomalous) content indicative of a new exploit. These payload-based anomaly sensors can augment other sensors and enrich the view of network traffic to detect malicious events. Both PAYL and Anagram create models of
pervised and very efficient fashion. PAYL computes, during a training phase, a profile of byte (1-gram) frequency distribution and their standard deviation of the application pay-load flowing to a single host and port. PAYL produces a very fine-grained model that is conditioned on payload length. Anagram models high-order n-grams (n > 1) which cap-ture the sequential information between bytes. We experimentally demonstrate that both of these sensors are capable of detecting new attacks with high accuracy and low false positive rates. Furthermore, in order to detect the very early onset of a worm attack, we designed an ingress/egress correlation function that is built in the sensors to quickly identify the worms’ initial propagation. The sensors are also designed to generate robust signatures of validated malicious packet content. The technique does not depend upon the detection of probing or scanning behavior or the prevalence of common probe payload, so it is especially useful for the detection of slow and stealthy worms.
An often-cited weakness of anomaly detection systems is that they suffer from “mimicry attack”: clever adversaries may craft attacks that appear normal to an anomaly detector and hence will go unnoticed as a false negative. A mimicry attack against a site defended by a content-based anomaly detector can be executed by an attacker by sniffing the target site’s traffic flow, modeling the byte distributions of that flow, and blending their exploit with “normal” appearing byte padding. To defend against such attacks, we further propose the techniques of randomized modeling and randomized testing. Under randomized mod-eling/testing, each sensor will randomly partition the payload into several subsequences, each of whom are modeled/tested separately,thus building a “model/test diversity” on each host that is unknown to the mimicry attacker. This raises the bar for the attackers as they have no means to know how and where to pad the exploit code to appear normal within each randomly computed partition, even if they have the global knowledge of the target site’s content flow.
Finally, PAYL/Anagram’s speed and high detection rate makes it valuable not only as a stand-alone network-based sensor, but also as a host-based data-flow classifier in an
instru-and the possibility of a “symbiotic” feedback loop that can improve accuracy instru-and reduce false positive rates over time.
Besides building stand-alone anomaly sensors, we also demonstrate a collaborative security strategy whereby different hosts may exchange payload alerts to increase the ac-curacy of the local sensor and reduce false positives. We propose and examine several new approaches to enable the sharing of suspicious payloads via privacy-preserving technolo-gies. We detail the work we have done with our PAYL and Anagram, to support gener-alized payload correlation and signature generation without releasing identifiable payload data. The important principle demonstrated is that correlation of multiple alerts can identify true positives from the set of anomaly alerts, reducing incorrect decisions and producing accurate mitigation against zero-day attacks.
A new wave of cleverly crafted polymorphic attacks has substantially complicated the task of automatically generating “string-based” signatures to filter newly discovered zero-day attacks. Although the payload anomaly detection techniques we present are able to detect these attacks, correlating the individual packet content delivering distinct instances of the same polymorphic attack are shown to have limited value, requiring new approaches for generating robust signatures.
1 Introduction 1
1.1 Problem Statement and Our Approach . . . 3
1.2 Thesis Contributions . . . 6
1.3 Thesis Outline . . . 9
2 Related Work 11 2.1 Network Anomaly Detection . . . 11
2.2 Worm Detection and Signature Generation . . . 14
2.3 Polymorphic Worms, Mimicry and Learning Attacks . . . 16
2.4 Privacy-preserving Correlation . . . 17
3 PAYL: 1-gram Payload Modeling and Anomaly Detection 19 3.1 Length Conditioned n-gram Payload Model . . . 19
3.2 Simplified Mahalanobis Distance . . . 23
3.3 Learning Issues . . . 26
3.3.1 Incremental Learning . . . 26
3.3.2 Reduced Model Size by Clustering . . . 27
3.3.3 Unsupervised Learning . . . 29
3.4 Z-String . . . 29
3.5 Finer-grained Modeling: Multiple Centroids . . . 31
3.6 Detection Evaluation . . . 35
3.6.2 Experiments with CUCS Data Set . . . 41
3.7 Summary . . . 44
4 Anagram: Higher Order n-gram Payload Modeling and Anomaly Detection 46 4.1 Higher Order N-gram Payload Model . . . 50
4.2 Model Size and Bloom Filters . . . 55
4.2.1 Memory overhead . . . 55
4.2.2 Computation overhead . . . 57
4.3 Discussion . . . 57
4.4 Implementation . . . 59
4.5 Summary . . . 60
5 Randomization against Mimicry Attack 62 5.1 Mimicry Attack . . . 62
5.1.1 Anagram against Mimicry Attack . . . 66
5.1.2 Randomization . . . 68
5.1.2.1 Randomized Modeling . . . 69
5.1.3 Randomized Testing . . . 71
5.2 Threshold reduction and “extreme” padding . . . 75
5.3 Summary . . . 76
6 Learning Strategies 77 6.1 Epoch-based Learning . . . 77
6.2 Semi-supervised Learning . . . 81
6.3 Adaptive Learning . . . 84
6.3.1 Training Attacks versus Mimicry Attacks . . . 84
servers . . . 85
6.3.2.1 Adaptive model training with shadow servers . . . 87
6.4 Summary . . . 88
7 Content-based Alerts Correlation and Signature Generation 89 7.1 Ingress/Egress Correlation for Worm Propagation . . . 89
7.1.1 Ingress and Egress Traffic Correlation . . . 90
7.1.2 Evaluation . . . 92
7.1.3 Buffer Size vs. Stealthiness . . . 94
7.2 Data Diversity across Sites . . . 97
7.3 Anomalous Payload Correlation among Sites . . . 100
7.3.1 Evaluating correlation techniques . . . 102
7.3.2 Alert correlation techniques . . . 103
7.3.2.1 Baseline: Raw payload correlation . . . 103
7.3.2.2 Frequency-modeled 1-gram alert correlation . . . 105
7.3.2.3 Binary-modeled n-gram alert correlation . . . 106
7.3.3 Similarity Score . . . 107
7.3.4 Testing results with real traffic . . . 108
7.3.5 Cross-Domain Alert Correlation Evaluation . . . 110
7.4 Signature Generation . . . 113
7.4.1 Ingress/Egress Correlation for Worm Signature Generation . . . 113
7.4.2 Correlation among Sites for Signature Generation . . . 114
7.4.3 Accuracy of Generated Signatures . . . 118
7.4.4 Signature for Polymorphic Worms . . . 121
7.5 Summary . . . 123
8.1 Summary . . . 125
8.2 Thesis Contributions . . . 127
8.3 Future Work . . . 128
8.4 Closing Remarks . . . 130
A Pseudo Code for PAYL and Anagram 131 A.1 Pseudo Code for Anagram . . . 131
A.2 Pseudo Code for PAYL . . . 135
Bibliography 140
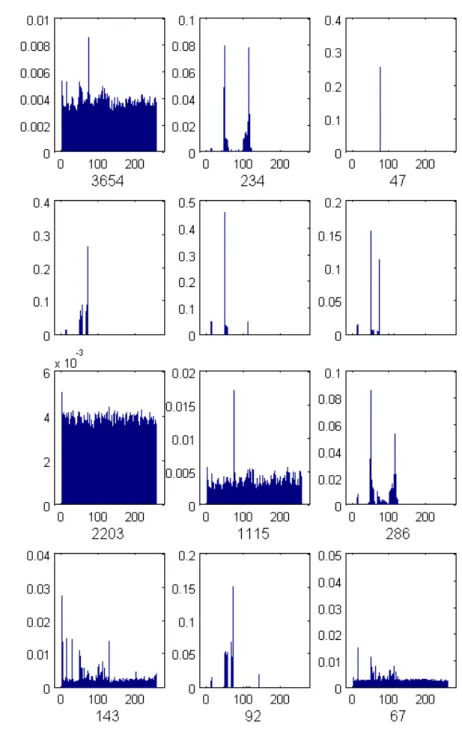
3.1 Example byte distributions for different ports. For each plot, the X-axis is the ASCII byte 0-255, and the Y-axis is the average byte frequency . . . 22 3.2 Example byte distribution for different payload lengths for port 80 on the
same host server . . . 23 3.3 Raw packet of CRII; only the first 301 bytes are shown for brevity. . . 23 3.4 Example of CodeRed II packet (in Figure 3.3), and its payload distribution
against the normal traffic at the same packet length 1360 . . . 24 3.5 The average relative frequency of each byte, and the standard deviation of
the frequency of each byte, for payload length 185 of port 80 . . . 25 3.6 Payload distribution for the CRII packet (in Figure 3.3) appears in the top
plot, re-ordered to the rank-ordered count frequency distribution in the bot-tom plot. . . 30 3.7 The signature Z-String computed from the CRII packet (in Figure 3.3).
The top numerical part is the ASCII representation of the Z-String, with the middle omitted for brevity. The lower byte sequence is the byte repre-sentation of the Z-String, while the non-printable character is displayed as ’.’. . . 31 3.8 One pass clustering algorithm . . . 32 3.9 Merge two cluster sets . . . 33
clustering; lower plot: semi-batched one-pass online clustering (batch size 50). The number under each subplot is the number of packets in that one centroid during training . . . 34 3.11 ROC curves for ports 21, 23, 25, 80 for the five different models. Notice
the x-axis scale is different for each plot and does not span to 100%, but limited to the worst false positive rate for each plot . . . 38 3.12 ROC of PAYL detecting incoming worms, false positive rate restricted to
less than 0.5% . . . 43 4.1 General architecture of Anagram sensor, the training phase. . . 49 4.2 General architecture of Anagram sensor, the detection phase. . . 50 4.3 ROC curves comparing the frequency-based and binary-based n-gram
ap-proach . . . 53 4.4 Inserting n-grams (n=5) into a Bloom Filter . . . 56 5.1 This figure shows the structure of the blended exploit buffer. The variable
parts depend on the exploit used. The buffer may be split into several pack-ets by the network stack when transmitted. The Maximum Segment Size (MSS) on our system was 1460 so each packet above including headers was no larger than 1460 bytes. . . 63 5.2 Comparison of frequency distributions of attack packet (unpadded left and
padded right) and normal port 80 traffic. The padded worm packet matches the normal traffic well. . . 64
local partial traffic. The upper plot shows the global model computed using all the traffic that web server W received, and the lower one gives the local model by observing the traffic to server W originating from several local IP address, for payload length 525. . . 66 5.4 Randomized Modeling . . . 69 5.5 Payload distribution examples for the randomized modeling. The top
sub-plot is the byte distribution using the whole packet, and the bottom two subplots are for each of the two random sub-partitions . . . 70 5.6 Randomized Testing . . . 71 5.7 The average false positive rate and standard deviation with 100% detection
rate for randomized testing of Anagram, with normal training (left) and semi-supervised training (right). . . 73 6.1 The pseudo code of epoch-based training. . . 78 6.2 Evolving of stability metrics of epoch-based training for PAYL. The left
plot gives the number of centroids over epochs, and the right one gives the sum of Manhattan distance between corresponding centroids after each new epoch. . . 79 6.3 The likelihood of seeing new n-grams as training time increases . . . 80 6.4 False positive rate (with 100% detection rate) as training time increases . . 81 6.5 Distribution of bad content scores for normal packets (left) and attack
pack-ets (right). . . 83 6.6 The false positive rate (with 100% detection rate) for different n-grams,
under both normal and semi-supervised training . . . 84 6.7 Shadow server architecture . . . 86
of alerts the worm need to wait before spreading to avoid detection, for 5 different worms. . . 96 7.2 Example byte distribution for payload length 536 of port 80 for the three
sites EX, W, W1, in order from top to bottom . . . 99 7.3 Similarity score comparison of 80 random pairs of “good-vs-good” alerts. . 109 7.4 Methods comparison. The correlation methods are, from 1 to 8, Raw-LCS;
Raw-LCSeq; Raw-ED; Frequency-MD; Zstr-LCS; Zstr-LCSeq; Zstr-ED; N-grams withn= 5. . . 112 7.5 The initial portion of the generated signature for CodeRed II by LCS on
raw payload. . . 114 7.6 The initial portion of raw packet of CRII; only the first 301 bytes are shown
for brevity. . . 115 7.7 Frequency distribution for the CRII packet. . . 116 7.8 First 20 bytes of the Z-String computed from the CRII packet. . . 116 7.9 Generated 5-gram signature from the CRII packet; only the first 172 bytes
are shown for brevity. . . 117 7.10 The accumulative frequency of the signature match scores computed by
matching normal traffic against different worm signatures. The first plot shows for the signatures of phpBB worm, and the second plot is that of the CodeRedII worm. . . 120
3.1 Detection performance comparison for sorted and unsorted centroids . . . . 33 3.2 Overall detection rate of each model when false positive rate lower than 1% 40 3.3 Speed and Memory measurements of each model. The training and testing
time is in units of seconds per 100M data, including the I/O time. The memory consumption is measured in the number of centroids that were kept after clustering or learning. . . 41 3.4 False positive rate of PAYL using different modeling algorithm on dataset
W, W1 and EX, when detecting all the worms. . . 44 4.1 The percentage of the observed unique n-grams for different frequencies of
occurance for 90 hours of training traffic . . . 52 4.2 The false positive rate (%) of the two approaches using different n-grams
when achieving 100% detection rate, www1-06 train/test dataset . . . 54 4.3 Hit rate of different cache strategies for Anagram speed-up. . . 60 5.1 The maximum possible padding length for a packet of different varieties of
the mimicry attack . . . 67 5.2 The detection performance of PAYL with randomized testing on the mimicry
attack which is designed to target it. . . 74 7.1 Different fragmentation for CodeRed and CodeRed II . . . 93
7.3 The detail number of figure 7.1. The number in the parenthesis following the worm name is their anomaly score. . . 97 7.4 For each pair of sites, the 3 packet lengths with the largest Manhattan
dis-tance between distribution. . . 100 7.5 The number of unique 5-grams in dataset W, W1 and EX, and the common
5-grams numbers between each pair of sites. . . 100 7.6 Manhattan distance from Raw-LCSeq; lower is better. . . 109 7.7 The similarity scores between different versions of shell code 2 of CLET
polymorphic engine, in average and standard deviation. . . 122
First of all, I would like to express my sincere appreciation to my advisor, Prof. Salvatore J. Stolfo, for his invaluable guidance and support throughout my whole PhD study. His en-thusiasm, broad knowledge and deep insights in computer science have made the research experience exciting and intriguing. And his patience and humor made my graduate study a fun and enjoyable journey. I also appreciate Prof. Angelos Keromytis, Prof. Vishal Misra, Prof. Moti Yung, Dr. Niels Provos, for serving on my committee and providing helpful suggestions.
My special thanks to two of my main collaborators and best friends: Janak J. Parekh and Gabriela Cretu. They are always helpful whenever I have questions not only on research but also on other matters, and their enthusiasm and devotedness in science always inspire me. The collaboration with them was really a joyful experience.
Many thanks to the members of the IDS and the network security group, past and present, for their help over the past four years. In particular, I would like to thank Dr. Shlomo Hershkop, Vanessa Frias-Martinez, Wei-Jen Li, Michael Locasto for their collab-oration in my work. I would also like to thank Angelos Stavrou, Stelios Sidiroglou, Phil Gross, and many other people for their helpful discussion about my research.
Finally, my most heartful thanks go to my parents and my husband. Their constant love and support make my graduate studies easier and much more joyful.
Chapter 1
Introduction
Computers and the Internet have become a vital part of our everyday life; at the same time, they have often also become targets of malicious attackers. Attacks can destroy files, wipe the hard disk, or even bring down part of the Internet if the routing infrastructure is targeted, or if the attack succeeds in reaching a broad collection of hosts with common vulnerabilities. As new attacks appear every day, it is crucial to find effective ways to detect these “zero day” attacks and defend networked systems.
Many anti-virus scanners and Intrusion Detection Systems (IDS) are available to help detect possible attacks. There are two major categories of IDS: misuse-based and anomaly-based. Misuse-based IDSes are primarily based on signatures that identify previously de-tected attacks. Although these systems are effective at detecting known intrusion attempts and exploits, they fail to recognize new attacks and carefully crafted variants of old ex-ploits. A new generation of systems have been the subject of research for at least a decade and are now appearing as standard security products that are based upon anomaly detec-tion. Anomaly detection systems model normal or expected behavior in a system, and detect deviations of interest that may indicate a security breach or an attempted attack.
a site by scanning and probing. These attacks can often be detected by analyzing network packet headers or by monitoring network traffic connection attempts and session behavior. Many well-known examples of worms have been described that propagate at very high speeds on the Internet [67]. These are easy to detect by analyzing the rate of scanning and probing from external sources, which would indicate a worm propagation is underway. Unfortunately, while this approach detects the early onset of a propagation, the worm has already successfully penetrated a number of victims, infected it and started its damage and its propagation. Then it should also be evident that slow and stealthy worm propagations may go unnoticed if one depends entirely on the detection of rapid or burst changes in flows or probes.
There are other attacks that display normal protocol behavior except that they may carry malicious content in an otherwise normal connection. For example, slow-propagating par-asitic worms targeting specific sites may follow the connection pattern of a host and thus may not exhibit any unusual volumes of connection attempts. Misuse and anomaly detec-tors that analyze packet headers and traffic flow statistics may be blind to these attacks or they may be too slow to react and reliably detect worms that are designed to evade detection by shaping their behavior to look like legitimate traffic patterns [49]. Furthermore, signa-ture scanners are vulnerable to zero-day exploits [67] and polymorphic worms/stealthy attacks with obfuscated exploit code [6]. Consequently, there has been an increasing focus on payload analysis to detect the early onset of a worm or targeted attack.
A number of researchers have focused on payload-based anomaly detection. Approaches that have been studied include specification-based anomaly detection [61] as well as tech-niques that aim to detect “code-like” byte sequences in network payloads [30, 81].
In our work, we focus on automated statistical learning approaches to efficiently train content models on a site’s “normal” traffic flow without requiring significant semantic anal-ysis. Ideally, we seek to design a sensor that automatically learns the characteristics of nor-mal attack-free data for any application, service, network or host. Consequently, a model learned from normal attack-free data may be used to identify “abnormal” or suspicious
traf-fic that would be subjected to further analysis to validate whether the data embodies a new attack. Ideally, we aim to detect the first occurrences of a worm attack either at a network system gateway or within an internal network and to prevent its propagation. Although we cast the payload anomaly detection problem in terms of worms, the method is useful for a wide range of exploit attempts against many if not all services and ports. We have cast the problem as a network packet level analysis problem. However, the techniques are equally applicable as a host-level anomaly detector.
1.1
Problem Statement and Our Approach
This thesis studies the following problem:
We seek to accurately detect zero-day attacks upon their very first appearance, or very soon thereafter using network packet payload anomaly detection.
New attacks against network services occur every day, attacks for which no signatures have yet been produced and deployed. These so called zero-day attacks can cause great harm. We conjecture that the “normal” content stream, both ingress and egress, of a site can be effectively and efficiently modeled to detect abnormal content indicative of a zero-day attack against some network service.
The ideal case is the 100% accurate detection of the network packets delivering the attack vector, with 0% false positive rate. In this work we seek to approach this ideal level of performance and conduct several experiments using real network traffic to demonstrate how close we may reach this ideal.
The approach we take is to compute a “normal” model of content flow for each network available service during a training phase, and then to use this learned “normal” model to detect abnormal, never-before-seen content. These suspicious network connections may or may not be attacks; hence, the approach presumes that other correlated information will identify the suspicious abnormal content that is true attacks, from false positives. We propose to correlate other content alerts under the principle that the attack vector will likely
be presented at multiple sites or in multiple connections. In the case of worms, we expect that a successful attack will create a propagation phase of worm execution which includes egress packet streams containing substantially the same abnormal content as the original ingress attack vector. Hence, correlation includes testing and comparing suspicious ingress and egress content alerts.
There are many design choices in modeling payload in network flows. The primary design criteria and operating objectives of any anomaly detection system entails:
• automatic “hands-free” deployment requiring little or no human intervention, • generality for broad application to any service or system,
• incremental update to accommodate changing or drifting environments,
• accuracy in detecting truly anomalous events (here anomalous payload), with low (or controllable) false positive rates,
• resistance to mimicry attack, and
• efficiency to operate in high bandwidth environments with little or no impact on throughput or latency.
These are difficult objectives to meet concurrently, yet they do suggest an approach that may balance these competing criteria for payload anomaly detection. The primary modeling technique proposed in this thesis is language-independent n-gram modeling of payload using machine learning techniques to automate the modeling of normal content flow. The techniques are completely general, and we discuss several strategies to automat-ically calibrate, update and improve models over time. An important primary area of work we present is a new and general method to resist mimicry attack for any technique one may choose to use to model “normal” content. The modeling techniques presented in this thesis are designed with high efficiency, so that the techniques proposed may scale to high speed networks, and even may be applicable to low bandwidth, low power environments such as MANETS.
It is important to note that we focus on “clear text” content channels, and do not address the issue of encrypted content flows. Anomaly detection of encrypted content has been studied by others by computing various entropy-based or Kolmogorov complexity-based models; we speculate about the effectiveness of these approaches in the future research section. For our work, we presume the content is available for inspection; the techniques proposed in this thesis can be applied at the point of decryption either by using a network service proxy architecture or on the host where network content can be passively sniffed at the point where it is decrypted and delivered to the targeted application software.
We also restrict our analysis and experimental evaluations to HTTP traffic. Such traffic poses fewer privacy restrictions since most web traffic content is usually public. Hence, we were able to acquire significant amounts of web traffic for use in our thesis research, although we believe the algorithms and technology presented in this thesis are applicable to other content flows. We also have chosen to limit our study to web traffic since historically web services have been a common target of previous worm attacks, and offer a comprehen-sive model of monoculture problems [43]. Our work on cross-site content alert sharing is thus applicable to a wide variety of systems on the Internet.
In this thesis, we detail two light-weight, real-time network anomaly detection sensors we designed, PAYL and Anagram, and experimentally demonstrate that they can success-fully detect inbound worm packets with high accuracy and a low false positive rate. We then show that if the worm has already infected a machine and starts to propagate to other victims, PAYL/Anagram can quickly detect the propagation and automatically generate a signature concurrently that can be distributed to other machines in the local LAN or across domains to filter the zero-day attack vector. This signature is accurate, and won’t block normal traffic (thus exhibiting a low false positive rate).
It is important to note that in this line of work we assume there is an active adversary who seeks to attack sites without notice. Hence, the threat model we assume is that the attacker will know that a content-based anomaly detector is in use, and they will seek means to “blind” the sensor from seeing their attack. An external research group led by Wenke
Lee at Georgia Tech fashioned an automated system that was designed to blind PAYL, the first sensor we proposed, to attacks creating unwanted false negatives [28]. Anagram, the second sensor presented in this thesis, was devised as a new sensor with a different modeling strategy from PAYL to thwart these automatically generated mimicry attacks levied at PAYL.
Under this threat model, we assume that the attacker will attempt to train the anomaly sensor to consider attack data as normal data. Under this learning attack strategy the at-tacker may send a stream of ingress data that is successively distant from “normal attack free” data but closer to their intended crafted exploit data. One means of thwarting these training attacks is to notice whether or not the target service replies with an error message for unrecognized requests. In such cases, the anomaly detector in its training phase can simply ignore such ingress packets and hence not include such purposely crafted training data in its model. We do not treat this case in detail in this thesis since to date no one has yet demonstrated a successful training attack. However, we discuss approaches to thwart training attacks.
Alternatively, the attacker may analyze the true content stream of the intended target and craft the content of their attack to appear to be normal content. In the latter case of this mimicry attack strategy, we propose a method to compute randomized models to thwart the attacker. Hence, even if the attacker knew the true content model of a target site, they may not know how exactly how to craft their attack to avoid detection. We present an alternative strategy we call randomized testing, that is less expensive to implement than randomized modeling, but that substantially provides very much the same anti-mimicry capabilities as randomized modeling.
1.2
Thesis Contributions
This thesis research makes the following contributions:
detec-tion. We systematically study the possibility and approaches of modeling “normal” network payload for use in anomaly detection to detect likely network attacks.
– A new statistical, semantics-independent, efficient content-based anomaly de-tector based on 1-gram analysis that is shown to be effective at detecting ab-normal content and attacks. The sensor does not rely upon a specification or semantic analysis of the target applications. The sensor learns a model of nor-mal content in a completely automated fashion.
– A “binary” based model representation of a mixture of high order n-grams de-tects abnormal content surprisingly well. Such modeling in the Anagram sensor can capture the sequential information between bytes and is resistant against ex-isting mimicry attacks; the technique is particularly efficient in space and com-putational costs, and does not incur infeasible amounts of computation, unlike building the full frequency distribution of higher order n-grams.
– The implementation of Anagram models using Bloom filters provides fast and effective correlation while also preserving the privacy of shared content. – Development of a run-time measurement of the “stability” of a network’s
con-tent flow, providing an automatic and reasonable estimate of when the sensor has been sufficiently trained and is ready for deployment.
– A “bad content model” created from known old attack signatures and collected virus samples that can be used to perform semi-supervised learning that im-proves accuracy of the anomaly detector. This information was acquired from publicly available sources such as Snort rules and online malware collections. – Identify the data diversity of network payload across sites, which can be used to
thwart large-scale attacks. The so-called Monoculture Problem (a large popula-tion of hosts sharing the same vulnerability exploited by a single attack) is the fundamental reason why worm attacks spread broadly with great efficiency and speed. Even though each potential target may still have the exact same
vulner-able software application availvulner-able for attack, we demonstrate that each site’s diverse content flow produces different and diversified payload models at differ-ent sites making a single common attack hard to evade all of the collaborating content anomaly detectors.
– A new defensive strategy showing how a symbiotic relationship between host-based sensors and a content-host-based sensor can adapt over time to improve accu-racy of modeling a site’s content flow.
• Novel techniques of randomized modeling/testing that can help thwart mimicry attacks. There are a new class of “smart worms” that launch their attack by first sniffing traffic and shaping the datagram to the statistics specific to a given target site to appear normal. By randomizing the portion of packets that the anomaly sensors extracts for modeling and testing, it is difficult for the attacker to guess where or how to pad content. This technique gives the sensors artificial diversity and robustness against future mimicry attacks. The techniques are general and applicable to any content modeling technique one may wish to use.
• A technique of correlating ingress/egress payload to capture a worm’s initial propagation attempt. Key features of worms include their self-propagation strat-egy; a newly infected host will begin sending outbound traffic that is substantially similar (if not exactly the same) as the original content that attacked the victim. In-stead of waiting until the volume of outgoing scans suggests full-blown propagation attempts, we can stop the worm spread from the very first attempt. This technique is especially good for catching the stealthy or targeted worms which do not display scanning or probing behavior.
• Novel techniques for efficient privacy-preserving payload collaboration across sites, and automatic signature generation. As the data diversity characteristics suggests, different sites have different normal payload models. This implies from a statistical perspective that they should also have different false positive alerts. Any
“common or highly similar anomalous payloads” detected among two or more sites logically would be caused by a common attack exploit targeting two or more sites. Cross-site or cross-domain sharing may thus reduce the false positive rate at each site, and may more accurately identify worm outbreaks in the earliest stages of an infection.
– Robust and privacy-preserving means of representing content-based alerts for cross-site alert sharing and signature generation. The best candidates, as de-tailed later, include the 1-gram based Z-String produced by PAYL, and the Bloom filter representation of anomalous n-grams detected by Anagram. – Highly accurate signatures that are automatically generated. Such signatures
detail and capture the core invariant part of the attacks even for polymorphic/me-tamorphic attack vectors
1.3
Thesis Outline
The rest of the thesis is organized as follows. Chapter 2 discusses related work in intrusion detection, worm detection, automatic signature generation and collaborative security. In chapter 3, we describe the PAYL anomaly detection sensor, the modeling and detection techniques employed in PAYL, and demonstrate how well it can detect attacks. Chapter 4 describes the Anagram anomaly detection sensor, designed to ameliorate the core mimicry attack problems that PAYL exhibits. The techniques described in the design of Anagram to resist mimicry attack are general, and in chapter 5 we propose the randomized modeling and testing approach to help thwart mimicry attack against any content-based anomaly sensor. The sensors described in this thesis are based upon machine learning algorithms applied to content flows. Metrics need to be found to decide when the model is well enough trained. Furthermore, the content flow environment may change in time and hence we seek ways to improve the learning phase and to produce accurate “normal” models. We explore several learning strategies in chapter 6, which includes “epoch-based” learning,
and adaptive learning that uses the sensors together with shadow servers for feedback from the server whose data flow is modeled. Chapter 7 introduces the idea of content-based alert correlation, which includes local (or host-level) ingress/egress correlation, and cross-site correlation. We examine several different ways to achieve privacy-preserving payload alert correlation, and demonstrate their effectiveness in detecting true alerts and reducing false positives. Chapter 8 summarizes the thesis and outlines ideas for future work.
Chapter 2
Related Work
2.1
Network Anomaly Detection
There are two types of systems that are called anomaly detectors: those based upon a specification (or a set of rules) of what is regarded as “good/normal” behavior, and others that learn the behavior of a system under normal operation. The first type relies upon human expertise and may be regarded as a straightforward extension of typical misuse detection IDS systems. Here we regard the latter type, where the behavior of a system is automatically learned, as a true anomaly detection system.
Rule-based network intrusion detection systems such as Snort and Bro use hand-crafted rules to identify known attacks, for example, virus signatures in the application payload, and requests to nonexistent services or hosts. They can do little to stop zero-day worms. They depend upon signatures only known after the worm has been launched success-fully, essentially disclosing their new content and method. The rules can also be specified for “good” behavior instead of “bad” behavior. Sekar [61] proposed specification-based anomaly detection in which they specify all the legitimate behavior of a server, for in-stance, IP, TCP or SMTP, using finite state machines (FSM), and any execution path that fails to track the specified FSM may be flagged as anomalous. But it’s hard to guarantee that a manually-developed state machine is accurate and complete, and hard to update if
the service has any modification.
Network anomaly detection systems, such as NIDES [22], PHAD [47] and ALAD [45], compute (statistical) models for normal network traffic and generate alarms when there is a large deviation from the normal model. Such model-learning systems have the ability to detect new attacks that never appeared before, but they might suffer from false alerts from those unusual content that is otherwise normal. We take the same approach in this thesis. However, these systems differ in the features extracted from available audit data and the particular algorithms they use to compute the normal models. Most use features extracted from the packet headers. ALAD and NIDES model the distribution of the source and destination IP and port addresses and the TCP connection state. PHAD uses many more attributes, a total of 34, which are extracted from the packet header fields of Ethernet, IP, TCP, UDP and ICMP packets.
Some systems use some payload features but in a very limited way. NATE is similar to PHAD; it treats each of the first 48 bytes of a packet as a statistical feature starting from the IP header, which means it can include at most the first 8 bytes of the payload of each network packet. ALAD models the incoming TCP request and includes as a feature the first word or token of each input line out of the first 1000 application payload bytes, restricted only to the header part for some protocols like HTTP and SMTP. PAYL and Anagram model the entire packet datagram, and may also be applied to long session data.
The work of Kruegel et. al. [31] describes a service-specific intrusion detection system that is most similar to our work. They combine the type, length and payload distribution of the request as features in a statistical model to compute an anomaly score of a service request. However, they treat the payload in a very coarse way. They first sort the 256 ASCII characters by frequency and aggregate them into 6 groups: byte value ranges 0, 1-3, 4-6, 7-11, 12-15, and 16-255, and compute one single uniform distribution model of these 6 segments for all requests to one service over all possible length payloads. They use a chi-square test against this model to calculate the anomaly score of new requests. In contrast, PAYL models the full byte distribution conditioned on the length of payloads and we use
Mahalanobis distance as fully described in the following discussion. Furthermore, the modeling we introduce includes automatic clustering of centroids that is shown to increase accuracy and dramatically reduce resource consumption. The method is fully general and does not require any parsing, discretization, aggregation or tokenizing of the input stream (eg, [46]).
Rieck [60] also proposed a payload-based network intrusion detection approach using n-grams recently. Unlike Anagram which builds binary-based n-gram models using Bloom filters, they store the n-grams in a trie data structure, and the similarity between two tries is defined according the number of matching and mismatching nodes. Another difference is that Anagram builds a universal model for the whole dataset, while [60] builds a trie for each connection in the dataset. During detection, they compare the test data against each of the pre-computed tries using a method similar to k-nearest neighbor, or simplified Ma-halanobis distance. One major shortcoming of this work is its high computation overhead, considering the number of tries that are compared in the model for each packet tested.
Early intrusion anomaly sensors focused on system calls. Forrest[15]’s “foreign se-quences of system calls” in a binary-based anomaly detector is quite similar to the mod-eling implemented in Anagram. Tan and Maxion[72] shows why Forrest’s work produced optimal results when the size of the token window was fixed at 6 (essentially a 6-gram). For-rest’s grams were sequences of tokens each representing a unique system function, whereas Anagram models n-grams of byte values. It has much more complicated situations with a huge feature space. Anagram also employs a semi-supervised training strategy whereby models of previously known attacks are employed in the sensor to improve accuracy.
Network intrusion detection systems can also be classified according to the semantic level of the data that is analyzed and modeled. Some of the systems such as MADAMID [33], Bro [55], EMERALD [57], STAT [74], ALAD [45], etc., reconstruct the network packets and extract features that describe the higher level interactions between end hosts. For example, session duration time, service type, bytes transferred, and so forth are re-garded as higher level, temporally ordered features not discernible by inspecting only the
packet content. Other systems are purely packet-based like PHAD [47], NATED [21], NATE [37]. They detect anomalies in network packets directly without reconstruction of connection data. This approach has the important advantage of being simple and fast to compute, and they are generally quite good at detecting those attacks that do not result in valid connections or sessions, for example, scanning and probing attacks.
2.2
Worm Detection and Signature Generation
There has been much work done on worm detection and their signature generation. Most of them based on detecting abnormal communication patterns or based on their abnormal content.
Fast-spreading and large number of connections is one important feature discernible from the most typical symptoms of a worm attack. Many models have been proposed to predict worm propagation speed and possible defense mechanisms [67, 5, 66]. Helped by network telescopes, Pang et. al. [53] use the macro symptoms such as Internet background radiation to generate early alerts of possible Internet-wide worm propagation. Other tech-niques are based on blocking or rate limiting traffic from hosts that exhibit abnormal local traffic patterns: number of connections to new destinations [83], the ratio of failed to suc-cessful connections [82], destination address dispersion [23], etc. But these techniques cannot detect worms that have normal traffic patterns, for example, the targeted worms, parasitic worms, or slow, stealthy worms.
Many researchers also have considered the use of content invariance or content preva-lence for worm detection, and generate content-based signatures. Honeycomb [29] is a host-based IDS that automatically creates signatures by applying longest common sub-string (LCS) on malicious traffic captured by a honeypot targeting dark space. Computed substrings are used as candidate worm signatures. Similarly, EarlyBird [65] uses Rabin fingerprints to find the most frequent substrings for signatures. Polygraph [52] extends the work done in Autograph [25]; both are signature generators that assume traffic is separated
into two flow pools, one with suspicious scanning traffic and a one with non-suspicious traffic. Instead of assuming signatures are contiguous, like Autograph, Polygraph allows a signature composed of multiple noncontiguous substrings (tokens), particularly to ac-commodate polymorphic worms. Tokens may be generated as a set (of which all must be present), as an ordered sequence, or as a probabilistic set (Bayes signature). Hamsa [35] further improves Polygraph in terms of efficiency, accuracy and attack resilience. Like Polygraph, Anagram is capable of identifying multiple “tokens”. However, Anagram’s design also does not assume an external flow classifier, being one itself. PADS [73], or “Position-Aware Distribution Signatures”, seek to blend frequency distributions and packet signature positioning.
Each of the aforementioned projects are based on detecting frequently occurring pay-loads delivered by a source IP that is “suspicious”, either because the connection targeted dark IP space or the source IP address exhibited pre-scanning behavior. These approaches imply that the detection occurs some time after the propagation of the worm has exe-cuted, and can easily be misled by deliberate noise [56]. Unlike these approaches, the ingress/egress correlation approach we proposed does not depend on scanning behavior and payload prevalence. Instead, we can detect the first propagation attempt of the worm immediately and generate the signature of it by extracting the common part of the incoming and outgoing traffic of the worm. Another substantial advantage of the Anagram anomaly detector is its ability of computing robust signature. Instead of considering the whole pay-load or the most frequent part, Anagram first identifies the malicious n-grams, so that the signature composed by them only captures the malicious exploit parts and are more accu-rate. Even under purposefully obfuscated content, the small invariant “decoder” regions of the payload are still identifiable across multiple suspicious payloads.
More recently, work has focused on building semantic-aware or vulnerability-based signatures to handle multiple (or polymorphic) attacks for the same exploit. Kruegel et. al. [30] use structural analysis of binary code and generate control-flow graphs to catch worm mutations. Shield [77] provides vulnerability signatures instead of string-oriented content
signatures, and blocks attacks that exploit that vulnerability. A “shield” is manually spec-ified for a vulnerability identspec-ified in some network available code; the time lag to specify, test and deploy shields from the moment the vulnerability is identified favors the worm writer, not the defenders. Vigilante [8] introduces the notion of vulnerability-specific self-certifying alerts that focus on filtering undesirable execution control, code execution, or function arguments, and can be exchanged via P2P systems. VSEF [51] builds execution-based filters that filter out vulnerable processor instruction-execution-based traces. COVERS [36] analyzes attack-triggered memory errors in C/C++ programs and develops structural mem-ory signatures; this is a primarily host-specific approach, while PAYL/Anagram focuses on network traffic in this thesis. However, as mentioned, PAYL/Anagram may also be used as host-based sensors with little effort.
SigFree [81] uses a different approach, focusing on generic code detection; as its name implies, it does not rely on signatures, preferring to disassemble instruction sequences and identify, using data flow anomaly detection, if requests contain sufficient code to merit them as being suspicious. PAYL/Anagram do not explicitly differentiate between code and data, although it is often able to do so based on training. Additionally, PAYL/Anagram monitor content flows, not just requests, and can apply to a broader variety of protocols.
2.3
Polymorphic Worms, Mimicry and Learning Attacks
Polymorphic viruses are nothing new; “1260” and the “Dark Avenger Mutation Engine” were considered the first two polymorphic virus engines, written in the early 90s [70]. However, early work focused on making it more difficult for detection by COTS signature scanners, would be easily detected by an anomaly detector as they contain significantly different byte distributions than non-malicious code, and were primarily targeted for man-ual execution and so did not incorporate exploit mechanisms like common Internet worms. Polymorphic worms with vulnerability-exploiting shellcode, e.g., ADMmutate [24] and CLET [13], do support exploit vectors and are primarily designed to fool signature-based
IDSes. CLET does feature a form of padding, which they call cramming, to defeat simple anomaly detectors. However, cram bytes are derived from a static source, i.e. instructions in a file included with the CLET distribution; while this may be customized to approach a general mimicry attack, it must be done by hand.
Wagner and Dean [75] were among the first to demonstrate a mimicry attack on an anomaly detection system, but these initial efforts to generate mimicry attacks, includ-ing [76] and [71], focused on host-based system-call anomaly detection. With the advent of effective network payload-based anomaly detection techniques, researchers have begun building “smart worms” that employ a combination of polymorphism and mimicry attack mechanisms. Kolesnikov, Dagon and Lee [28] built a worm specifically designed to target network anomaly detection approaches, including PAYL. They use a number of techniques, including polymorphic decryption, normal traffic profiling and blending, and splitting to ef-fectively defeat PAYL and several other IDSes.
Defeating learning attacks by training attacks is also a current research theme; [3] dis-cusses the problem for anomaly detectors from a theoretical perspective, categorizes dif-ferent types of learning attacks (e.g., causative vs. exploratory, etc.) and speculates as to several possible solutions. We independently proposed randomized modeling employed in Anagram that implements some of the techniques proposed in [3]. Anagram uses random-ization, hiding key parameters of the model from the attacker, and may be extensible to any learning based anomaly sensor. Our ongoing work includes exploring several other strat-egies, including the randomization of n-gram sizes, and various strategies to test whether an attacker is polluting learning traffic at given points in time. We discuss several of these ideas in the section of future research.
2.4
Privacy-preserving Correlation
There have been recent efforts to focus on the privacy of content alerts to enable effective correlation without leaking confidential information. Lincoln et al. [37] suggest hash-based
sanitization of several header fields, enabling equality matching (e.g., identifying the same source IP) while removing other features, including payloads; instead, our techniques keep (and analyze) these payloads. Kissner [26] describes the notion of privacy-preserving set operations using cryptographic techniques; this achieves stronger privacy guarantees than hashing approaches described by Lincoln, but it is restricted to set union, intersection, el-ement reduction (set count difference), which could still potentially be used with n-gram analysis. Privacy-Preserving Friends Troubleshooting Network [20, 19] extends earlier work on PeerPressure [78]—a collaborative model for software configuration diagnosis— with a privacy-preserving architecture utilizing a “friend”-based neighbor approach to col-laboration, including the use of secure multiparty computation to vote on configuration outliers and homomorphic encryption to protect privacy. Xu [84] introduces the notion of “concept hierarchies” to abstract low-level concepts, along with the use of entropy, to bal-ance the sanitization and information gain of alerts; a similar use of entropy may also be applicable here.
Our work focuses more on the privacy-preserving representations of network payload and the techniques to correlate them. Our purpose is to successfully find those alerts con-taining very similar payload among different sites, which are likely to be the common attacks vector, and to reduce the false positives generated by local sensors. At the same time, we will use the correlated payload based on these representations to generate accu-rate attack signatures.
There is also a tremendous volume of work on privacy-preserving data mining, e.g. [1, 38]; these primarily assume secure querying, perturbation, and aggregate computation of values amongst one or two databases, and does not generally scale to the collaboration described here. Additionally, most of the research in this field is more concerned with offline analysis of data base query processing.
Chapter 3
PAYL: 1-gram Payload Modeling and
Anomaly Detection
In this chapter, we present the payload-based anomaly detector PAYL. we choose to con-sider “language-independent” statistical modeling of sampled data streams, which is best exemplified by well known n-gram analysis. Many have explored the use of n-grams in a variety of tasks. The method is well understood, efficient and effective. The simplest model one can compose is the 1-gram model. A 1-gram model is certainly efficient (requiring a linear time scan of the data stream and an update of a small 256-element histogram), but whether it is accurate requires analysis and experimentation. To our surprise, this technique has worked surprisingly well in our experiments.
3.1
Length Conditioned n-gram Payload Model
Network payload is just a stream of bytes. Unlike the network packet headers, payload doesn’t have a fixed format, small set of keywords or expected tokens, or a limited range of values. Any character or byte value may appear at any position of the datagram stream. To model the payload, we need to divide the stream into smaller clusters or groups according to some criteria to associate similar streams for modeling. The port number and the length
are two obvious choices. We may also condition the models on the direction of the stream, thus producing separate models for the inbound traffic and outbound responses.
Usually the standard network services have a fixed pre-assigned port number: 20 for FTP data transmission, 21 for FTP commands, 22 for SSH, 23 for Telnet, 25 for SMTP, 80 for Web, etc. Each such application has its own special protocol and thus has its own pay-load type. Each site running these services would have its own “typical paypay-load” flowing over these services. Payload to port 22 should be encrypted and appear as uniform distri-bution of byte values, while the payload to port 21 should be primarily printable characters entered by a user and a keyboard.
Within one port, the payload length also varies over a large range. The most common TCP packets have payload lengths from 0 to 1460. Different length ranges have different types of payload. The larger payloads are more likely to have non-printable characters indicative of media formats and binary representations (pictures, video clips or executable files etc.). Thus, we compute a payload model for each different length range for each port and service and for each direction of payload flow. This produces a far more accurate characterization of the normal payload than would otherwise be possible by computing a single model for all traffic going to the host. However, many centroids might be computed for each possible length payload creating a detector with large resource consumption.
To keep our model simple and quick to compute, we model the payload using n-gram analysis, and in particular the byte value distribution, exactly when n=1. An n-gram is the sequence of n adjacent bytes in a payload unit. A sliding window with width n is passed over the whole payload and the occurrence of each n-gram is counted. N-gram analysis was first introduced by [12] and exploited in many language analysis tasks, as well as security tasks. The seminal work of Forrest [15] on system call traces uses a form of n-gram analysis (without the frequency distribution and allowing for “wildcards” in the n-gram) to detect malware execution as uncharacteristic sequences of system calls.
For a payload, the feature vector is the relative frequency count of each n-gram which is calculated by dividing the number of occurrences of each n-gram by the total number of
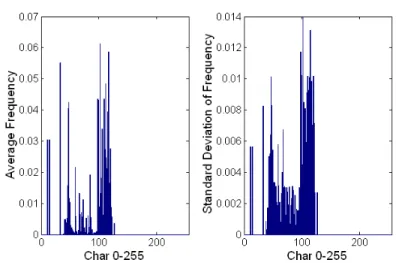
n-grams. The simplest case of a 1-gram computes the average frequency of each ASCII character 0-255. Some stable character frequencies and some very variant character fre-quencies can result in the same average frequency, but they should be characterized very differently in the model. Thus, we compute in addition to the mean value, the variance and standard deviation of each frequency as another characterizing feature. So for the payload of a fixed length of some port, we treat each character’s relative frequency as a variable and compute its mean and standard deviation as the payload model.
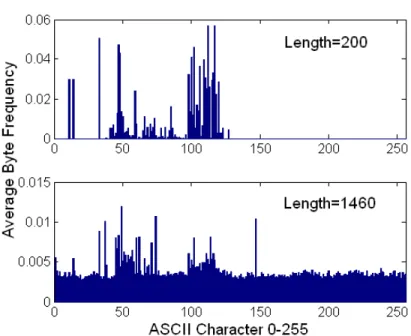
Figure 3.1 provides an example showing how the payload byte distributions vary from port to port, and from source and destination flows. Each plot represents the characteristic profile for that port and flow direction (inbound/outbound). Notice also that the distri-butions for ports 22 (inbound and outbound) show no discernible pattern, and hence the statistical distribution for such encrypted channels would entail a more uniform frequency distribution across all of the 256 byte values, each with low variance. Hence, encrypted channels are fairly easy to spot. Notice that this figure is actually generated from a dataset with only the first 96 bytes of payload in each packet, and there is already a very clear pattern with the truncated payload. Figure 3.2 displays the variability of the frequency distributions among different length payloads. The two plots characterize two different distributions from the incoming traffic to the same web server, port 80 for two different lengths, here payloads of 200 bytes, the other 1,460 bytes. Clearly, a single monolithic model for both length categories will not represent the distributions accurately.
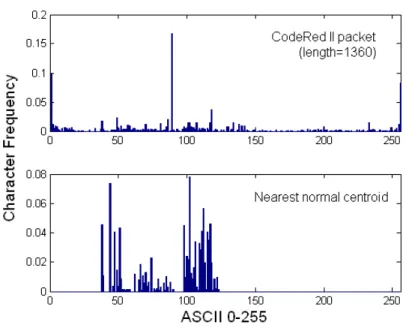
And most importantly, which also serves as the basic assumption of this work, is that the attack’s payload distribution is very different from the normal ones. Figure 3.3 and Figure 3.4 below gives such an example. Figure 3.3 shows a portion of the first packet of CodeRed II, and the Figure 3.4 compares the byte distribution of the worm packet (upper one) against the normal traffic (lower one) which has the same packet length 1360.
Given a training data set, we compute a set of modelsMij. For each specific observed lengthiof each portj,Mij stores the average byte frequency and the standard deviation of each byte’s frequency. The combination of the mean and variance of each byte’s frequency
Figure 3.1: Example byte distributions for different ports. For each plot, the X-axis is the ASCII byte 0-255, and the Y-axis is the average byte frequency
can characterize the payload within some range of payload lengths. So if there are 5 ports, and each port’s payload has 10 different lengths, there will be in total 50 centroid models computed after training. As an example, we show the model computed for the payload of length 185 for port 80 in figure 3.5, which is derived from a dataset described in the evaluation section 3.8. (We also provide an automated means of reducing the number of centroids via clustering as described in section 3.4)
PAYL operates as follows. We first observe many exemplar payloads during a training phase and compute the mean and variance of the byte value distribution producing model
Mij. During detection, each incoming payload is scanned and its byte value distribution is computed. This new payload distribution is then compared against modelMij; if the dis-tribution of the new payload is significantly different from the norm, the detector flags the packet as anomalous and generates an alert. The means to compare the two distributions, the model and the new payload, is described next.
Figure 3.2: Example byte distribution for different payload lengths for port 80 on the same host server
3.2
Simplified Mahalanobis Distance
Mahalanobis distance is a standard distance metric to compare two statistical distributions. It is a very useful way to measure the similarity between the (unknown) new payload sam-ple and the previously computed model. Here we compute the distance between the byte distributions of the newly observed payload against the profile from the model computed for the corresponding length range. The higher the distance score, the more likely this
GET./default.ida?XXXXXXXXXXXXXXXXXXXXXXXXXX XXXXXXXXXXXXXXXXXXXXXXXXXXXXXXXXXXXXXXXXXXX XXXXXXXXXXXXXXXXXXXXXXXXXXXXXXXXXXXXXXXXXXX XXXXXXXXXXXXXXXXXXXXXXXXXXXXXXXXXXXXX%u9090 %u6858%ucbd3%u7801%u9090%u6858%ucbd3%u7801% u9090%u6858%ucbd3%u7801%u9090%u9090%u8190%u 00c3%u0003%u8b00%u531b%u53ff%u0078%u0000%u0
Figure 3.4: Example of CodeRed II packet (in Figure 3.3), and its payload distribution against the normal traffic at the same packet length 1360
payload is abnormal.
The formula for the Mahalanobis distance is:
d2(x, y) = (x−y)TC−1(x−y) (3.1) wherexandyare two feature vectors, and each element of the vector is a variable. xis the feature vector of the new observation, andyis the averaged feature vector computed from the training examples, each of which is a vector. AndC−1 is the inverse covariance matrix
asCij =Cov(yi, yj). yi, yj are the ith and jth elements of the training vector.
The advantage of Mahalanobis distance is that it takes into account not only the average value but also its variance and the covariance of the variables measured. Instead of simply computing the distance from the mean values, it weights each variable by its standard deviation and covariance, so the computed value gives a statistical measure of how well the new example matches (or is consistent with ) the training samples.
In our problem, we use the “naive” assumption that the bytes are statistically indepen-dent. Thus, the covariance matrixCbecomes diagonal and the elements along the diagonal
Figure 3.5: The average relative frequency of each byte, and the standard deviation of the frequency of each byte, for payload length 185 of port 80
are just the variance of each byte.
Notice, when computing the Mahalanobis distance, we pay the price of having to com-pute multiplications and square roots after summing the differences across the byte value frequencies. To further speed up the computation, we derive the simplified Mahalanobis distance: d(x, y) = n−1 X i=0 (|xi−yi|/σi) (3.2) where the variance is replaced by the standard deviation. Herenis fixed to 256 under the 1-gram model (since there are only 256 possible byte values). Thus, we avoid the time-consuming square and square-root computations (in favor of a single division operation) and now the whole computation time is linear in the length of the payload with a small constant to compute the measure. This produces an exceptionally fast detector (recall our objective to operate in high-bandwidth environments).
For the simplified Mahalanobis distance, there is the possibility that the standard devia-tionσiequals zero and the distance will become infinite. This will happen when a character or byte value never appears in the training samples or, oddly enough, it appears with exactly
the same frequency in each sample. To avoid this situation, we give a smoothing factorα
to the standard deviation similar to the prior observation:
d(x, y) =
n−1
X
i=0
(|xi−yi|/(σi+α)) (3.3) The smoothing factor αreflects the statistical confidence of the sampled training data. The larger the value ofα, the less the confidence the samples are truly representative of the actual distribution, and thus the byte distribution can be more variable. Over time, as more samples are observed in training,αmay be decremented automatically.
The formula for the simplified Mahalanobis distance also suggests how to set the thresh-old to detect anomalies. If we set the threshthresh-old to 256, this means we allow each character to have a fluctuation range of one standard deviation from its mean. Thus, logically we may adjust the threshold to a value in increments of 128 or 256, which may be implemented as an automatic self-calibration process.
3.3
Learning Issues
3.3.1
Incremental Learning
The 1-gram model with Mahalanobis distance is very easy to implement as an incremental version with only slightly more information stored in each model. An incremental version of this method is particularly useful for several reasons. A model may be computed on the fly in a “hands-free” automatic fashion. That model will improve in accuracy as time moves forward and more data is sampled. Furthermore, an incremental online version may also “age out” old data from the model keeping a more accurate view of the most recent payloads flowing to or from a service. This “drift in environment” can be solved via incremental or online learning [32].
To age out older examples used in training the model, we can specify a decay parameter of the older model and emphasize the frequency distributions appearing in the new samples.
This provides the means of automatically updating the model to maintain an accurate view of normal payloads seen most recently.
To compute the incremental version of the Mahalanobis distance, we need to compute the mean and the standard deviation of each ASCII character seen for each new sample observed. For the mean frequency of a character, we computexN =
PN
i=1xi/N from the training examples. If we also store the number of samples processed,N, we can update the mean as xN+1 = xN ×N +xN+1 N + 1 =xN + xN+1−xN N + 1 (3.4)
when we see a new examplexN+1, a clever update technique described by Knuth [27].
Since the standard deviation is the square root of the variance, the variance computation can be rewritten using the expected valueE as:
V ar(X) = E(X−EX)2 =E(X2)−(EX)2 (3.5) We can update the standard deviation in a similar way if we also store the average of thex2
i in the model.
This requires maintaining only one more 256-element array in each model that stores the average of the and the total number of observations N. Thus, the n-gram byte dis-tribution model can be implemented as an incremental learning system easily and very efficiently. Maintaining this extra information can also be used in clustering samples as described in the next section.
3.3.2
Reduced Model Size by Clustering
When we described our model, we said we compute one model Mij for each observed length biniof payloads sent to portj. Such fine-grained modeling might introduce several problems. First, the total size of the model can become very large. (The payload lengths are associated with media files that may be measured in gigabytes and many length bins may be defined causing a large number of centroids to be computed.) Further, the byte
distribution for payloads of length bini can be very similar to that of payloads of length binsi−1andi+ 1; after all they vary by one byte. Storing a model for each length may therefore be obviously redundant and wasteful.
Another problem is that for some length bins, there may not be enough training samples. Sparseness implies the data will generate an empirical distribution that will be an inaccurate estimate of the true distribution leading to a faulty detector.
There are two possible solutions to these problems. One solution for the sparseness problem is relaxing the models by assigning a higher smoothing factor to the standard deviations which allows higher variability of the payloads. The other solution is to “bor-row” data from neighboring bins to increase the number of samples; i.e. we use data from neighboring bins used to compute other “similar” models.
We compare two neighboring models using the simple Manhattan distance to measure the similarity of their average byte frequency distributions. If their distance is smaller than some thresholdt, we merge those two models. This clustering technique is repeated it until no more neighboring models can be merged. This merging is easily computed using the incremental algorithm described in Section 3.3.1; we update the means and variances of the two models to produce a new updated distribution.
Now for a new observed test data with lengthisent to portj, we use the modelMij, or the model it was merged with. But there is still the possibility that the length of the test data is outside the range of all the computed models. For such test data, we use the model whose length range is nearest to that of the test data. In these cases, the mere fact that the payload has such an unusual length unobserved during training may itself be cause to generate an alert.
The reader should note that the modeling algorithm and the model merging process are each linear time computations, and hence the modeling technique is very fast and can be performed in real time. The online learning algorithm also assures us that models will improve over time, and their accuracy will be maintained even when services are changed and new payloads are observed.
3.3.3
Unsupervised Learning
Our model together with Mahalanobis distance can also be applied as an unsupervised learning algorithm. Thus, training the models is possible even if noise is present in the training data (for example, if training samples include payloads from past worm propaga-tions still propagating on the Internet.) This is based on the assumption that the anomalous payload is a minority of the training data and their payload distribution is different from the normal payload. These abnormal payloads can be identified in the training set and their dis-tributions removed from the model. This is accomplished by applying the learned models to the training dataset to detect outliers. Those anomalous payloads will have a much larger distance to the profile than the “average” normal samples and thus will likely appear as sta-tistical outliers. After identifying these anomalous training samples, we can either remove the outliers and retrain the models, or update the frequency distributions of the computed models by removing the counts of the byte frequencies appearing in the anomalous training data.
3.4
Z-String
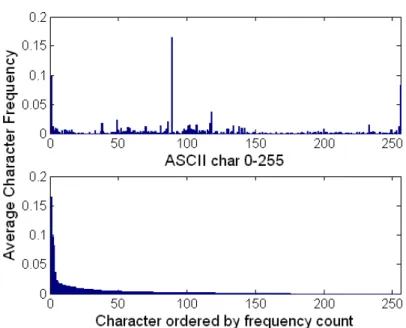
Consider the string of bytes corresponding to the sorted, rank ordered byte frequency of a model. Figure 3.6 displays a view of this process. The frequency distribution of payloads of one packet of the worm CRII is plotted in the top graph. The lower graph represents the same information by the plot is reordered to the rank ordering of the distribution. Here, the first bar in the lower plot is the frequency of the most frequently appearing ASCII character. The second bar is likewise the second most frequent, and so on. This rank ordered distribution surprisingly follows a Zipf-like distribution (an exponential function or a power law where there are few values appearing many times, and a large number of values appearing very infrequently.)
The rank order distribution also defines what we call a “Z-string”. The byte values ordered from most frequent to least frequent serves as a representative of the entire
dis-tribution. Figure 3.7 displays the Z-String for the plot in Figure 3.6. Notice that for this distribution there are only 175 distinct byte values appearing in the distribution. Thus, the Z-string has length 175.
Furthermore, as we shall see later, this rank ordered byte value distribution of the new payload deemed anomalous also may serve as a simple representation of a “new worm signature” that may be rapidly deployed to other sites to better detect the appearance of a new worm at those sites; if an anomalous payload appears at those sites and its rank ordered byte distribution matches a Z-string provided from another site, the evidence is very good that a worm has appeared. This distribution mechanism is part of an ongoing project called “Worminator” [41, 68] that implements a “col