DOI: 10.1556/606.2018.13.2.18 Vol. 13, No. 2, pp. 185–194 (2018) www.akademiai.com
TRADITIONAL HOUSES ENERGY OPTIMIZATION
USING PASSIVE STRATEGIES
1Chro Hama RADHA
1 Breuer Marcell Doctoral School, Institute of Architecture, Faculty of Engineering and
Information Technology, University of Pécs, Boszorkány u. 2, H-7624 Pécs, Hungary and City Planning Department, Faculty of Technical Engineering, Sulaimani Polytechnic
University, Slaimani, Iraq, e-mail: chro.radha@spu.edu.iq Received 22 October 2017; accepted 13 January 2018
Abstract: Energy efficiency and reduction of a building’s environmental impact are the major priorities of the energy and environmental policy worldwide. The passive strategy is one of the most effective strategies for energy efficiency and thermal comfort either in newly built or in retrofitting existing buildings. This study investigated energy and comfort optimization in a typical traditional house in Sulaimani city in Iraq, through analyzing, investigating, and improving energy efficiency using passive strategies. Several strategies for improvement were investigated, including window-to-wall ratio, thermal insulation, infiltration, natural ventilation, shading, and form compact. The total convenient passive strategies for the residential building typology was summarized and proposed as an optimal solution model in terms of energy efficiency and thermal comfort. An optimization model was presented and the results were compared with the reference model. The results revealed that the optimum model performed better 34% than the existing traditional model in term of energy consumption.
Keywords: Passive strategies, Energy simulation, Energy optimization, Thermal comfort
1. Introduction
The passive design responds to the local climate and site conditions in order to maximize the comfort and the health of building occupants while minimizing energy use. The key to designing a passive building is to take the best advantage of the local climate [1]. With regard to passive strategies, architectural design elements, such as building shape, orientation, and Window-to-Wall Ratio (WWR), can significantly influence the final energy use of a building [2]. Traditional building has been a good example of climatic design and represents the techniques that have found to improve
their living conditions. It is the result of centuries of optimization in the use of resources, materials, construction techniques and climate considerations, which are achieved through a trial-and-error process [3]. Recent researchers were devoted to analyze the performance of traditional techniques adopted in and around vernacular buildings in order to derive principles for the use in modern urban houses [4]. In addition, natural ventilation is an energy efficient alternative for reducing the energy use in the buildings, achieving thermal comfort, and maintaining a healthy indoor environment. It is an effective measure to save energy in the traditional buildings [5]. In traditional buildings wind catcher has been used as a passive strategies for ventilation and cooling building in hot-arid or hot-humid areas, they still used in some areas in the Middle East and Egypt, as a green system capable of increasing the air quality inside buildings with minimum energy consumption [6].
In Iraqi Kurdistan Region, the energy consumption has increased gradually. According to the annual report of the Ministry of Electricity and Energy in Kurdistan (MEEK) 2011, the residential sector consumed 66% of the total national generated electricity [5].
2. Case study description
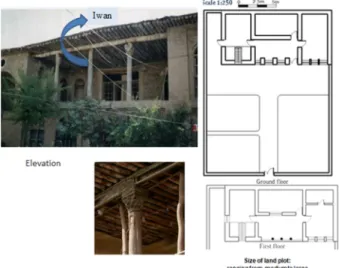
It is a typical traditional house in Sulaimani city. It consists of two floors with a floor area 158 m2, which has characterized by an open front big patio.The ground floor is mainly reserved for services including bakery, kitchen, bathroom and public reception or guest reception, where the upper floor is purely private, and contain two or three rooms that overlooking on inner Iwan as it is shown in Fig. 1, often supported by two or three wooden columns [5].
The division between the public and the private domains has been achieved vertically. According to the build materials as it is shown in Fig. 2, mud brick is used as a wall construction with a thickness ranged between 40-80 cm, mud mortar is used for the interior and external wall finishing. The windows are wooden framed, single-glazed. Usually, there are three windows side by side on the walls of the rooms. The frequently spaced narrow windows provide the sunlight to penetrate into the deepest point of the spaces. In addition, the house roof was made of bole of trees, with diameters not exceed than 15 cm, which was used as a crossbeam form, it was covered by a layer of mat, then placed a layer of compressed soil that was mixed with straw. These practices assist energy conservation in buildings by reducing heat-loss through the roof. Furthermore, the house oriented toward the inside, and the size of the land plot ranged from a medium to large [7].
Fig. 2. The Morphology properties of a typical residential building [7]
3. Methodology
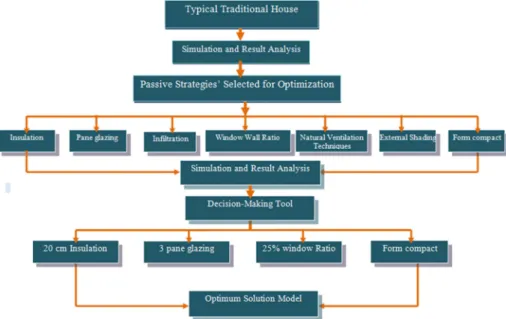
The methodology that is shown in Fig. 3 begins with the process of analyzing and investigating the energy efficiency and thermal comfort in a typical traditional house in Sulaimani city. Then investigate the major deficient to provide energy consumption reduction suggestions and indoor environment improvement through identifying different scenarios based on the passive strategies for optimization. The computational IDA ICE software technique has been used for simulation different scenarios to assist the most feasible strategy selection for energy efficiency and thermal comfort.
Furthermore, the Excel decision-making tool was used for comparing different scenarios with the reference model to identify the most effective strategies for reducing energy consumption and increasing thermal comfort in the typical traditional house. The optimum solution model was proposed in terms of energy and thermal comfort efficiency.
Fig. 3. The methodology of the study (Source: Author)
4. Simulation model
The IDA ICE software was used as a simulation tool to investigate the energy efficiency in the existing building. The simplification of the architectural layout is needed before importing into IDA ICE. Then, the whole construction materials, loads, control settings, climate data file were defined. Based on the typical residential house information, fuel was used for heating, while the electricity was used for cooling and Domestic Hot Water (DHW), as it is shown in the Table I.
The weather file which created by Meteonorn software 7, was used that consisted of six parameters were related to the local climate: dry-bulb temperature, relative humidity, direct normal radiation, diffuse radiation, wind speed, and wind direction. The air temperature was measured at a height of 10 m, regarding the orientation, and based on the previous study of the author, the best orientation in term of energy consumption is the south orientation that was chosen for the simulation. After setting up all parameters, the IDA ICE model it can be created as it is shown in Fig. 4.
Table I
Description of the residential building Constructio
n Material Layer Thickness U value W/m2*K
External
wall 60 cm thickness mud brick wall 5 cm double mud plaster 1 2 65 cm 0.7748 Internal
wall 40 cm thickness mud brick 5 cm double gypsum 1 2 45 cm 1.057 Internal floor (Internal slab) 15 cm wood 1 42 cm 2 cm light insulation 2 0.48 20 cm compact soil 1 5 cm brick tile 1
Roof 15 cm wood 2 cm light insulation 1 2 37 cm 0.5008
20 cm compact soil 1
External
floor 5 cm brick tile 5 cm compact soil 1 1 10 cm 3.266 Glazing 1 pane glazing
Heating Fuel Max. heating power/ 7597.2 W Cooling Electric Max. cooling power/ 4977.5 W Domestic hot water Electric Max. heating power/ 961.3 W Infiltration
Air tightness 10 ACH (building) Pressure difference 50 Pa
Pressure coefficients AIVC Semi-exposed’’
Fig. 4. IDA ICE model of a typical residential building
The existing model was simulated by running one-year and the simulation results were provided that is shown in Table II, the total energy demand for the typical residential building for one year period was 40512 kWh. The predominant characteristic in the energy consumption is fuel heating that was 17392 kWh, followed by energy consumption for cooling that was 12855 kWh, while the energy consumption for
domestic hot water was 8421 kWh, and the rest of energy consumption is for lighting and other purposes.
Table II
Delivered energy report from IDA ICE for one year period
Purchased energy Peak demand
██ Lighting, facility 1844 kWh 11.6 kWh/m2 0.5 kW
██ Electric cooling 12855 kWh 81.2 kWh/m2 27.7 kW
██ Electric heating 8421 kWh 53.2 kWh/m2 0.96 kW
██ Fuel heating 17392 kWh 109.8 kWh/m2 14.88 kW
Total 40512 kWh 255.8 kWh/m2
Thermal comfort 6768 hours in a year
5. Passive strategies application for optimum model
Optimization is a technique used to obtain the best results from a system or process. In essence, the importance of optimization lies not in trying to find out all about a system, but in finding out, with the least possible effort, the best way to adjust the system [8]. International studies confirm this conjecture, according to which 30% more energy savings can be achieved by optimization of the building [9]. The passive strategy for optimization refers to an approach that harnesses naturally occurring phenomena, including the power of the sun, the direction of the wind and other climatic effects that contribute to an energy consumption reduction and to maintain consistent indoor temperatures and occupant comfort. The optimization of the traditional house offers the possibility of studying the various passive strategies, including thermal insulation, pane glazing, WWR, the daylight potential for all rooms, solar heat controller device, outdoor air flow rate (infiltration) control, natural ventilation technique usage, and their impacts on the energy reaction and comfort performance of the building.
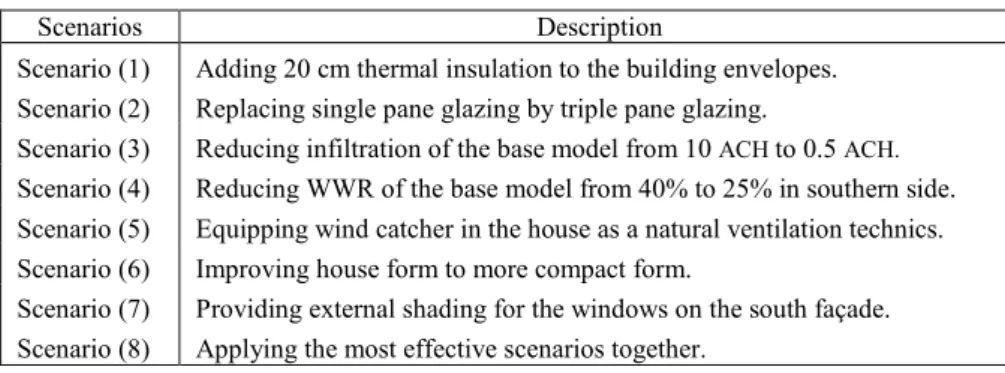
In the next step, with regarding to the passive strategies that mention above, seventh different scenarios have been defined. The eighth scenario was applied for getting an optimization model, as it is shown in Table III.
6. Result analysis
All models of different scenarios were simulated for the whole year period. The results for the energy consumption of heating, cooling, DHW, lighting, annual energy consumption, and thermal comfort were recorded. The Excel tool was used as a decision-making tool for comparing the results, based on the reference model.
Table IV shows the percentage of reduction and increased energy consumption and thermal comfort compared to the reference model. The results of simulations have been shown that the total yearly energy consumption was reduced 24.1% by adding 20 cm insulation in the building envelopes, while the acceptable thermal comfort hours was
decreased 2.3%. Replacing the single pane glazing to triple pane glazing, in the second scenario, the total energy consumption was reduced 11.8%, while thermal comfort increases 1%. By reduction infiltration from 10 ACH to 0.5 ACH, the total energy and thermal comfort hours decrease slightly. In addition, in the fourth scenario, when reducing WWR of the base model from 40% to 25% in the southern side, the total energy consumption was reduced 3.3%. While in the fifth scenario, for improving the natural ventilation and daylight in the house, a wind catcher was equipped, it can be noted that the total energy reduction was 10.4%, from the base model. By compacting the house’s form, the total annual energy reduction was 8.9%. In addition, providing external shading of windows on the south façade, the total energy reduction was 3.5%.
Table III
Scenarios detailed descriptions
Scenarios Description
Scenario (1) Adding 20 cm thermal insulation to the building envelopes. Scenario (2) Replacing single pane glazing by triple pane glazing.
Scenario (3) Reducing infiltration of the base model from 10 ACH to 0.5 ACH. Scenario (4) Reducing WWR of the base model from 40% to 25% in southern side. Scenario (5) Equipping wind catcher in the house as a natural ventilation technics. Scenario (6) Improving house form to more compact form.
Scenario (7) Providing external shading for the windows on the south façade. Scenario (8) Applying the most effective scenarios together.
Table IV
The percentage of energy consumption and thermal comfort in all scenarios
Re fe re nc e In su la tio n 20 c m 3 Pa ne gl as s In fi ltr at io n 0. 5 A CH W in do w -w al l-ra tio 25 % W in d -Ca tc he r E xt er na l sh ad in g Fo rm co m pa ct Electric cooling kW h 0.0% -10.2% -8.1% -10.8% -8.4% -16.6% -10.8% -1.7% Fuel heating 0.0% -48.5% -21.5% -0.1% -1.6% -12.5% -0.1% -22.5% DHW 0.0% 0.0% 0.0% 0.0% 0.0% 1.8% 0.0% 2.9% Lighting 0.0% -0.1% -0.1% -0.1% -0.1% -3.9% -0.1% 13.3% Total energy 0.0% -24.1% -11.8% -3.5% -3.3% -10.4% -3.5% -8.9% Acceptable thermal comfort Hou r 0.0% -2.3% 1.0% -1.0% -1% -0.3% -1.4% -0.2%
The results showed that each scenario has a different effect on the models, in terms of energy consumption and thermal comfort. Furthermore, the most effective strategy for reducing energy was thermal insulation, especially in the cold season, followed by pane glazing and wind catcher.
7. Evaluation of passive strategies for the optimization
In order to identify the most effective passive strategies of the energy and thermal comfort performance the virtual digital value from one to ten was estimated. The positive numerical represented the increase and the negative numerical was represented the decrease, for example, the percentage of energy reduction from one to five, the +1 value was given, while the percentage of energy increase from one to five, the ‒1 value was given, and so on. This is vice versa for the thermal comfort, this means for the reduction the minus value and for the increase the plus value was given. The results analysis in the Table V shows the most effective strategies for reducing yearly energy consumption were thermal insulation, pane glass, wind catcher form compacting and WWR that should take into consideration during creating the optimum model. While the most effective strategies for thermal comfort was thermal insulation. In addition, reducing infiltration and providing the external shading had a negative impact on the acceptable thermal comfort hours inside the house.
Table V
The energy consumption reduction in all passive strategy scenarios
In su la tio n Pa ne g la ss In fi ltr at io n W W R W in d ca tc he r E xt er na l sh ad in g Fo rm co m pa ct Electric cooling +3 +2 +3 +2 +4 3 +1 Fuel heating +10 +5 0 +1 +3 0 +5 DHW 0 0 0 0 -1 0 -1 Lighting 0 0 0 0 +1 0 -3 Total energy +5 +3 +1 +1 +3 +1 +2 Thermal comfort +1 0 -1 0 0 -1 0 Sum points +19 +10 +3 +4 +10 +3 +4
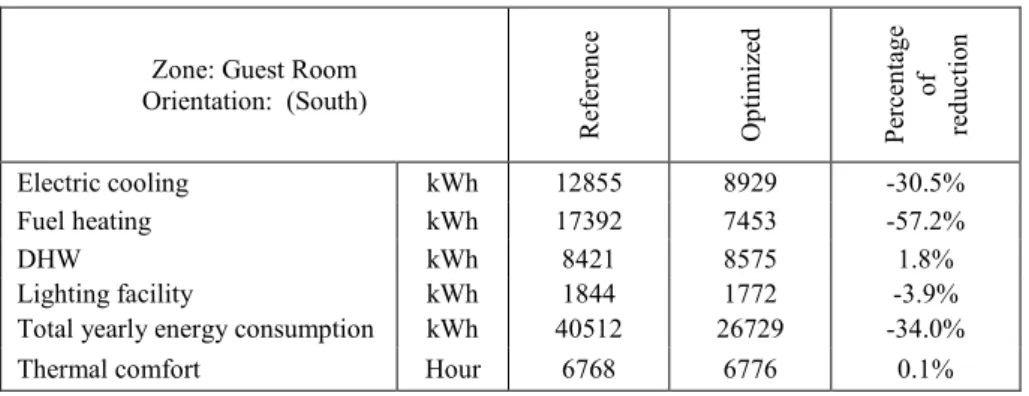
The results comparison of energy consumption and thermal comfort for the reference case and the optimized case were presented in Table VI. Based on the results comparison, the heating and cooling energy demand were reduced significantly in the optimum model. The rate reduction of the energy consumption of the cooling was 30.5%, while the rate of reducing energy consumed for heating was 57.2%. The total energy consumption was reduced by 34%. In addition, the thermal comfort hours were increased slightly in the optimum model.
Table VI
The optimum model for the residential house and comparison with the reference model Zone: Guest Room
Orientation: (South) Re fe re nc e O pt im iz ed Pe rc en ta ge of re du ct io n Electric cooling kWh 12855 8929 -30.5% Fuel heating kWh 17392 7453 -57.2% DHW kWh 8421 8575 1.8% Lighting facility kWh 1844 1772 -3.9%
Total yearly energy consumption kWh 40512 26729 -34.0%
Thermal comfort Hour 6768 6776 0.1%
8. Conclusion
This study investigated the energy and thermal comfort optimization in a typical residential house, through simulation several passive strategies as different scenarios. Based on the supporting decision-making tool, the simulation showed that the most important improvements were increasing thermal insulation and increasing pane glass is followed by utilizing wind catcher strategy, form compact, and WWR reduction. The optimum model for the traditional house was proposed and compared to the base model. The result showed that the optimum house performed better in both energy and thermal comfort performance than the reference model that was reduced 34% yearly energy consumption compared with the reference model, while the acceptable thermal comfort hours increased 0.1%. The aim of the study was increasing awareness among designers, to drive characteristics of traditional houses in the modern houses.
References
[1] Taleb H. M. Using passive cooling strategies to improve thermal performance and reduce energy consumption of residential buildings in U.A.E. building, Frontiers of Architectural Research, Vol. 3, No. 2, 2014, pp. 154–165.
[2] Kang J. E., Ahn K. U., Park C. S., Schuetze T. Assessment of passive vs. active strategies for a school building design, Sustainability, Vol. 7, No. 11, 2015, pp. 15136‒15151. [3] Yüksek I. Esin T. Analysis of traditional rural houses in Turkey in terms of energy
efficiency, International Journal of Sustainable Energy, Vol. 32. No. 6, 2013, pp. 643‒658. [4] Kubota T., Toe D. H. C. Application of passive cooling techniques in vernacular houses to modern urban houses: A case study of Malasia, Procedia - Social and behavioral Sciences, Vol. 179, 2015, pp. 29‒39.
[5] Radha C. H., Kistelegdi I., Radha C. H. Efficient natural ventilation in traditional and contemporary houses in hot and dry climate, Proc. of 2nd International Conference on Architecture, Structure and Civil Engineering (ICASCE’16), London, UK, 26-27 March 2016, pp. 67−75.
[6] Dehghani-sanji A. R., Soltani M., Raahemifar K. A new design of wind tower for passive ventilation in buildings to reduce energy consumption in windy regions, Renewable and Sustainable Energy Reviews, Vol. 42, 2015, pp. 182–195.
[7] Radha C., Kistelegdi I., Thermal performance analysis of Sabunkaran residential building typology, Pollack Periodica, Vol. 12, No. 2, 2017, pp. 151–162.
[8] Murray S. N., O’Sullivan D. T. J. An optimization methodology and sensitivity analysis of existing building retrofits, Proc. of 1st International Building Simulation and Optimization Conference (IBSOC), Loughborough, UK, 10-11 September 2012, pp. 110‒116.
[9] Kovari G., Kistelegdi I. Optimized building automation and control for the improvement of energy efficiency and climate comfort of office buildings, Pollack Periodica, Vol. 10, No. 1, 2015, pp. 71–82.
![Fig. 2. The Morphology properties of a typical residential building [7]](https://thumb-us.123doks.com/thumbv2/123dok_us/1092141.2645100/3.892.245.584.410.765/fig-morphology-properties-typical-residential-building.webp)