Content-Based Music
Information Retrieval:
Current Directions and
Future Challenges
Current retrieval systems can handle tens-of-thousands of music tracks
but new systems need to aim at huge online music collections that
contain tens-of-millions of tracks.
By
Michael A. Casey,
Member IEEE
,
Remco Veltkamp,
Masataka Goto,
Marc Leman,
Christophe Rhodes, and Malcolm Slaney,
Senior Member IEEE
ABSTRACT
|
The steep rise in music downloading over CD sales has created a major shift in the music industry away from physical media formats and towards online products and services. Music is one of the most popular types of online information and there are now hundreds of music streaming and download services operating on the World-Wide Web. Some of the music collections available are approaching the scale of ten million tracks and this has posed a major challenge for searching, retrieving, and organizing music content. Research efforts in music information retrieval have involved experts from music perception, cognition, musicology, engi-neering, and computer science engaged in truly interdisciplin-ary activity that has resulted in many proposed algorithmic and methodological solutions to music search using content-based methods. This paper outlines the problems of content-based music information retrieval and explores the state-of-the-art methods using audio cues (e.g., query by humming, audiofingerprinting, content-based music retrieval) and other cues (e.g., music notation and symbolic representation), and identifies some of the major challenges for the coming years.
KEYWORDS
|
Audio signal processing; content-based music information retrieval; symbolic processing; user interfacesI .
I N TR O D U CT I ON
Music is now so readily accessible in digital form that personal collections can easily exceed the practical limits on the time we have to listen to them: ten thousand music tracks on a personal music device have a total duration of approximately 30 days of continuous audio. Distribution of new music recordings has become easier, prompting a huge increase in the amount of new music that is available. In 2005, there was a three-fold growth in legal music downloads and mobile phone ring tones, worth $1.1 billion worldwide, offsetting the global decline in CD sales; and in 2007, music downloads in the U.K. reached new highs [1]–[3].
Traditional ways of listening to music, and methods for discovering music, such as radio broadcasts and record stores, are being replaced by personalized ways to hear and learn about music. For example, the advent of social net-working Web sites, such as those reported in [4] and [5], has prompted a rapid uptake of new channels of music discovery among online communities, changing the nature of music dissemination and forcing the major record labels to rethink their strategies.
Manuscript received September 3, 2007; revised December 5, 2007. This work was supported in part by the U.K. Engineering and Physical Sciences Research Council under Grants EPSRC EP/E02274X/1 and EPSRC GR/S84750/01.
M. A. CaseyandC. Rhodesare with the Department of Computing, Goldsmiths College, University of London, SE14 6NW London, U.K. (e-mail: [email protected]; [email protected]).
R. Veltkampis with the Department of Information and Computing Sciences, Utrecht University, 3508TB Utrecht, The Netherlands (e-mail: [email protected]).
M. Gotois with the National Institute of Advanced Industrial Science and Technology (AIST), Ibaraki 305-8568, Japan (e-mail: [email protected]).
M. Lemanis with the Department of Art, Music, and Theater Sciences, Ghent University, 9000 Ghent, Belgium (e-mail: [email protected]).
M. Slaneyis with Yahoo! Research Inc., Santa Clara, CA 95054 USA (e-mail: [email protected]).
It is not only music consumers who have expectations of searchable music collections; along with the rise of consumer activity in digital music, there are new opportu-nities for research into using large music collections for discovering trends and patterns in music. Systems for trend spotting in online music sales are in commercial development [6], as are systems to support musicological research into music evolution over the corpus of Western classical music scores and available classical recordings [7], [8]. Musicology research aims to answer questions such as: which musical works and performances have been historically the most influential?
Strategies for enabling access to music collections, both new and historical, need to be developed in order to keep up with expectations of search and browse functionality. These strategies are collectively called music information retrieval (MIR) and have been the subject of intensive research by an ever-increasing community of academic and industrial research laboratories, archives, and libraries. There are three main audiences that are identified as the beneficiaries of MIR: industry bodies engaged in record-ing, aggregating and disseminating music; end users who want to find music and use it in a personalized way; and professionals: music performers, teachers, musicologists, copyright lawyers, and music producers.
At present, the most common method of accessing music is through textual metadata. Metadata can be rich and expressive so there are many scenarios where this approach is sufficient. Most music download services cur-rently use metadata-only approaches and have reached a degree of success with them. However, when catalogues become very large (greater than a hundred thousand tracks) it is extremely difficult to maintain consistent expressive metadata descriptions because many people created the descriptions and variation in concept encod-ings impacts search performance. Furthermore, the descriptions represent opinions, so editorial supervision of the metadata is paramount [9].
An example of a commercial metadata-driven music system ispandora.comwhere the user is presented with the instructionBtype in the name of your favorite artist or song and we’ll create a radio station featuring that music and more like it.[The system uses metadata to estimateartist similarityandtrack similarity; then, it retrieves tracks that the user might want to hear in a personalized radio station. Whereas the query was simple to pose, finding the answer is costly. The system works using detailed human-entered track-level metadata enumerating musical-cultural prop-erties for each of several hundred thousand tracks. It is estimated that it takes about 20–30 minutes per track of one expert’s time to enter the metadata.1 The cost is therefore enormous in the time taken to prepare a database to contain all the information necessary to perform similarity-based search. In this case, it would take
approximately 50 person-years to enter the metadata for one million tracks.
Social media web services address the limitations of centralized metadata by opening the task of describing content to public communities of users and leveraging the power of groups to exchange information about content. This is the hallmark of Web 2.0. With millions of users of portals such as MySpace, Flickr, and YouTube, group be-havior means that users naturally gravitate towards those parts of the portalVcategories or groupsVwith which they share an affinity; so they are likely to find items of interest indexed by users with similar tastes. However, the activity on social networking portals is not uniform across the interests of society and culture at large, being predomi-nantly occupied by technologically sophisticated users, therefore social media is essentially a type of editorial metadata process.
In addition to metadata-based systems, information about the content of music can be used to help users find music. Content-based music description identifies what the user is seeking even when he does not know speci-fically what he is looking for. For example, the Shazam system (shazam.com), described in [10], can identify a particular recording from a sample taken on a mobile phone in a dance club or crowded bar and deliver the artist, album, and track title along with nearby locations to purchase the recording or a link for direct online pur-chasing and downloading. Users with a melody but no other information can turn to the online music service Nayio (nayio.com) which allows one to sing a query and attempts to identify the work.
In the recording industry, companies have used sys-tems based on symbolic information about musical con-tent, such as melody, chords, rhythm, and lyrics, to analyze the potential impact of a work in the marketplace. Services such as Polyphonic HMI’s Hit Song Science andPlatinum Blue Music Intelligenceuse such symbolic information with techniques from Artificial Intelligence to make consulta-tive recommendations about new releases.
Because there are so many different aspects to music information retrieval and different uses for it, we cannot address all of them here. This paper addresses some of the recent developments in content-based analysis and re-trieval of music, paying particular attention to the methods by which important information about music signals and symbols can be automatically extracted and processed for use with music information retrieval systems. We consider both audio recordings and musical scores, as it is beneficial to look at both, when they are available, to find clues about what a user is looking for.
The structure of this paper is as follows: Section II introduces the types of tasks, methods, and approaches to evaluation of content-based MIR systems; Section III presents methods for high-level audio music analysis; Section IV discusses audio similarity-based retrieval; symbolic music analysis and retrieval are presented in
Section V; Section VI presents an overview of advances in music visualization and browsing; Section VII discusses systems for music information retrieval; and we conclude in Section VIII with a discussion of challenges and future directions for the field.
I I .
U S E S C A S E S A N D A P P R O A C H E S
A. Use Cases: Specificities and Query TypesContent-based MIR is engaged in intelligent, automat-ed processing of music. The goal is to make music, or information about music, easier to find. To support this goal, most MIR research has been focused on automatic music description and evaluation of the proposed methods. The field is organized around use cases which define a type of query, the sense of match, and the form of the output. Queries and output can be textual information (metadata), music fragments, recordings, scores, or music features. The match can be exact, retrieving music with specific content, or approximate, retrieving near neighbors in a musical space where proximity encodes musical similarity, for example.
The main components of an MIR system are detailed in Fig. 1. These are query formation, description extrac-tion, matching and, finally, music document retrieval. The scope of an MIR system can be situated on a scale of specificity for which the query type and choice of exact or approximate matching define the characteristic specificity of the system. Those systems that identify exact content of individual recordings, for example, are called high-specificity systems; those employing broad descriptions
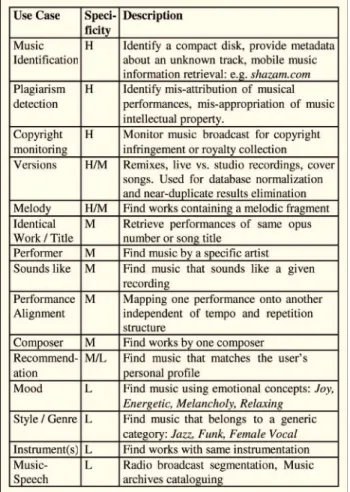
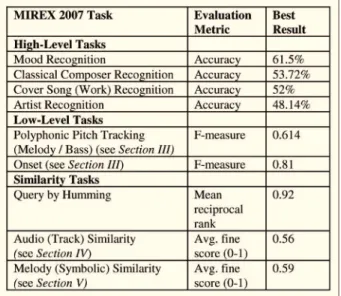
of music, such as genre, have low specificity: that is, a search given a query track will return tracks having little content directly in common with the query, but with some global characteristics that match. Hence, we divide specificity into three broad categories: high-specificity systems match instances of audio signal content; mid-specificity systems match high-level music features, such as melody, but do not match audio content; and low-specificity systems match global (statistical) properties of the query. Table 1 enumerates some of the MIR use cases and their specificities (high, mid, or low). A more comprehensive list of tasks and their specificities is given in [11].
There are three basic strategies for solving MIR use cases. Each strategy is suited to a given specificity. The first is based on conceptual metadata, information that is encoded and searched like text and is suited to low-specificity queries; the second approach uses high-level descriptions of music content corresponding with intuitive or expert knowledge about how a piece of music is constructed. This approach is suited to mid specificity queries. The third strategy is based on low-level signal-based properties which are used for all specificities. We outline each of these three approaches in the following sections.
Fig. 1.Flowchart of canonical content-based query system.
B. Approaches
1) Metadata:Metadata is the driver of MIR systems. As such, many services exist simply to provide reliable metadata for existing collections of music, either for end users or for large commercial music collections. Most music listeners use metadata in their home listening envi-ronments. A common MIR task is to seek metadata from the internet for digital music that wasBripped[from com-pact disc to a computer. This is the core functionality of automatic Web-based services such asGracenote (gracenote. com) and MusicBrainz (musicbrainz.org)Vboth of these metadata repositories rely on user-contributed content to scale track-level music description to millions of entries.
These services provide both factual metadata, namely objective truths about a track, andcultural metadata, which contains subjective concepts. For a metadata system to work its descriptions of music must be accurate and the meaning of the metadata vocabulary widely understood. Web 2.0 provides a partial solution in that communities of users can vote on a track’s metadata. This democratic process at least ensures that the metadata for a track is consistent with the usage of one, or more, communities. Problems associated with factual information, artist, album, year of publication, track title, and duration, can severely limit the utility of metadata. Ensuring the generality of the associated text fields, for example, consistencies of spelling, capitalization, international characters, special characters and order of proper names, is essential to useful functioning [9].
In addition to factual metadata, subjective, culturally determined information at the level of the whole track is often used to retrieve tracks. Common classes of such metadata aremood,emotion,genre,style, and so forth. Most current music services use a combination of factual and cultural metadata. There has also been much interest in automatic methods for assigning cultural, and factual, metadata to music. Some services collect user preference data, such as the number of times particular tracks have been played, and use the information to make new music recommendations to users based on the user community. For example, Whitman and Rifkin [12] used music descriptions generated from community metadata; they achieved Internet-wide description by using data mining and information retrieval techniques. Their extracted data was time awareVreflecting changes both in the artists’ style and in the public’s perception of the artists. The data was collected weekly, and language analysis was performed to associate noun and verb phrases with musical features extracted from audio of each artist.
The textual approach to MIR is a very promising new direction in the field: a comprehensive review of the methods and results of such research is beyond the scope of the current paper.
For all its utility, metadata cannot solve the entirety of MIR due to the complexities outlined above. Commercial
systems currently rely heavily on metadata but are not able to easily provide their users with search capabilities for finding music they do not already know about, or do not know how to search for. This gap is one of the oppor-tunities for content-based methods, which hold the pro-mise of being able to complement metadata-based methods and give users access to new music via processes of self-directed discovery and musical search that scales to the totality of available music tracks. For the remainder of this paper, we focus primarily on content-based music description rather than factual or culturally determined parameters. However, content-based methods are consid-ered not replacements but enhancements for metadata-based methods.
2) High-Level Music Content Description: An intuitive starting point for content-based music information retrieval is to use musical concepts such as melody or harmony to describe the content of the music. In the early days of MIR, many query-by-humming systems were proposed that sought to extract melodic content from polyphonic audio signals (those with multiple simulta-neous musical lines) so that a user could search for music by singing or humming part of the melody; such systems are now being deployed as commercial services; see, for example, naiyo.com. A survey of sung-query methods was conducted by Hu and Dannenberg in [13].
High-level intuitive information about music embodies the types of knowledge that a sophisticated listener would have about a piece of music, whether or not theyknowthey have that knowledge:
BIt is melody that enables us to distinguish one work from another. It is melody that human beings are innately able to reproduce by singing, humming, and whistling. It is melody that makes music memorable: we are likely to recall a tune long after we have forgotten its text.[[14]
Even though it is an intuitive approach, melody extraction from polyphonic recordings, i.e., multiple instruments playing different lines simultaneously, re-mains extremely difficult to achieve. Surprisingly, it is not only difficult to extract melody from audio but also from symbolic representations such as MIDI files. The same is true of many other high-level music concepts such as rhythm, timbre, and harmony. Therefore, extraction of high-level music content descriptions is a subgoal of MIR and the subject of intensive research. Common high-level descriptors are identified in Table 2. The goal of such tasks is to encode music into a schema that conforms to traditional Western music concepts that can then be used to make queries and search music.
Automatic extraction of factual, cultural, and high-level music descriptions have been a subject of intense study in the MIREX music information retrieval experimental
exchange. MIREX provides a framework for formal evaluation of MIR systems using centralized tasks, datasets, platforms, and evaluation methods [15], [16]. As such, MIREX has become a very important indicator of the state of the art for many subtasks within the field of MIR. A summary of the results of the 2007 high-level music tasks is given in Table 3; the query-by-humming task has a particularly high score. It is interesting to note that the best-performing system on this task used low-level
audio matching methods rather than extracting a high-level melody feature from audio [18]. The authors suggest that low-level audio methods outperform symbolic meth-ods even when clean symbolic information is available as in this task.
Because there is a great number of music recordings available that can be used as a first stage input to a high-level music description system, this motivates work on extracting high-level music features from low-level audio content. The MIREX community extends the range of tasks that are evaluated each year, allowing for valuable knowledge to be gained on the limits of current algorithms and techniques.
3) Low-Level Audio Features: The third strategy for content-based music description is to use the information in the digital audio. Low-level audio features are measure-ments of audio signals that contain information about a musical work and music performance. They also contain extraneous information due to the difficulty of precisely measuring just a single aspect of music, so there is a tradeoff between the signal-level description and the high-level music concept that is encoded.
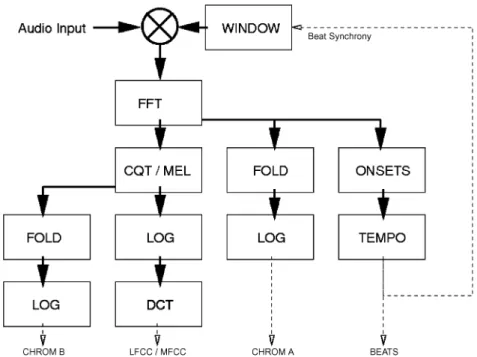
In general, low-level audio features are segmented in three different ways: frame based segmentations (periodic sampling at 10 ms-1000 ms intervals), beat-synchronous segmentations (features are aligned to musical beat boundaries), and statistical measures that construct probability distributions out of features (bag of features models). Many low-level audio features are based on the short-time spectrum of the audio signal. Fig. 2 illustrates how some of the most widely used low-level audio features are extracted from a digital audio music signal using a windowed fast Fourier transform (FFT) as the spectral extraction step. Both frame-based and beat-based windows are evident in the figure.
a) Short-Time Magnitude Spectrum: Many low-level audio features use the magnitude spectrum as a first step for feature extraction because the phase of the spectrum is not as perceptually salient for music as the magnitude. This is generally true except in the detection of onsets and in phase continuation for sinusoidal components.
b) Constant-Q/Mel Spectrum:The ear’s response to an acoustic signal is logarithmic in frequency and uses nonuniform frequency bands, known as critical bands, to resolve close frequencies into a single band of a given center frequency. Many systems represent the constant bandwidth critical bands using a constant-Q transform, where the Q is the ratio of bandwidth to frequency [17], [19]. It is typical to use some division of the musical octave for the frequency bands, such as a twelfth, corresponding to one semitone in Western music, but it is also common to use more perceptually motivated frequency spacing for band centers. Fig. 3 shows the alignment between a set of linearly spaced frequency band edges and the corre-sponding logarithmically spaced twelfth-octave bands. The Table 3Summary of Results of Best-Performing Classification and
Recognition Systems in MIREX 2007 Exchange
Mel frequency scale has linearly spaced filters in the lower frequency range and logarithmically spaced filters above 1300 Hz. Both logarithmic and Mel frequency scales are used. The Mel or Constant-Q spectrum can be obtained from a linear spectrum by summing the powers in adja-cent frequency bands. This approach has the advantage of being able to employ the efficient FFT to compute the spectrum.
c) Pitch-Class Profile (Chromagram): Another com-mon type of frequency folding is used to represent the energy due to each pitch class in twelfth-octave bands called a pitch-class profile (PCP) [20]–[22]. This feature integrates the energy in all octaves of one pitch class into a single band. There are 12 equally spaced pitch classes in Western tonal music, independent of pitch height, so there are typically 12 bands in a chromagram represen-tation. Sometimes, for finer resolution of pitch informa-tion, the octave is divided into an integer multiple of 12
such as 24, 36, or 48 bands. Tuning systems that use equally spaced pitch classes are calledequal temperament. Recently, some studies have explored extracting features for tuning systems that do not use equally spaced pitch classes: a necessary extension for application to non-Western music.
d) Onset Detection:Musical events are delineated by onsets; a note has an attack followed by sustain and decay portions. Notes that occur simultaneously in music are often actually scattered in time and the percept is inte-grated by the ear-brain system. Onset detection is con-cerned with marking just the beginnings of notes. There are several approaches to onset detection, employing spectral differences in the magnitude spectrum of adjacent time points, or phase differences in adjacent time points, or some combination of the two (complex number onset detection) [23]–[25]. Onset detection is one of the tasks studied in the MIREX framework of MIR evaluation shown in Table 3.
e) Mel/Log-Frequency Cepstral Coefficients: Mel-frequency cepstral coefficients (MFCC) take the loga-rithm of the Mel magnitude spectrum and decorrelate the resulting values using a Discrete Cosine Transform. This is a real-valued implementation of the complex cepstrum in signal processing [19]. The effect of MFCCs is to organize sinusoidal modulation of spectral magnitudes by increasing modulation frequency in a real-valued array. Values at the start of the array correspond to long wave spectral modulation and therefore represent the projection of the log magnitude spectrum onto a basis of formant
Fig. 3.Folding of a set of linearly spaced frequency bands (lower graph) onto a set of logarithmically spaced frequency bands (upper graph). The x-axis shows frequency of bands, upper lines are labeled by their Western music notation pitch class and lower lines by their FFT bin number (for 16 384 bins with 44.1 kHz sample rate).
Fig. 2.Schematic of common audio low-level feature extraction processes. From left-to-right: log-frequency chromagram, Mel-frequency cepstral coefficients, linear-frequency chromagram, and beat tracking. In some cases, the beat tracking process is used to make the features beat synchronous, otherwise segmentation uses fixed-length windows.
peaks. Values at the end of the MFCC array are the projection coefficients of the log magnitude spectrum onto short wavelength spectral modulation, corresponding to harmonic components in the spectrum. It is usual to use about 20 MFCC coefficients, therefore representing the formant peaks of a spectrum; this extraction corresponds, in part, to musicaltimbreVthe way the audio sounds other than its pitch and rhythm.
f) Spectral Flux:The spectral flux of a musical signal estimates the fine spectral-temporal structure in different frequency bands by measuring the modulation ampli-tudes in mid-to-high spectral bands [26], [27]. The resulting feature is a two-dimensional matrix, with fre-quency bands in the rows and modulation frefre-quency in columns, representing the rate of change of power in each spectral band.
g) Decibel Scale (Log Power): The decibel scale is employed for representing power in spectral bands be-cause the scale closely represents the ear’s response. The decibel scale is calculated as ten times the base-10 loga-rithm of power.
h) Tempo/Beat/Meter Tracking: As shown in Fig. 2, beat extraction follows from onset detection, and it is often used to align the other low-level features. Alignment of
features provides a measurement for every beat interval, rather than at the frame level, so the low-level features are segmented by musically salient content. This has recently proven to be exceptionally useful for mid-specificity MIR tasks such as cover songs and versions identification. Low-level audio features in themselves cannot tell us much about music; they encode information at too fine a tem-poral scale to represent perceptually salient information. It is usual in MIR research to collect audio frames into one of several aggregate representations. Table 4 describes this second-stage processing of low-level audio features which encodes more information than individual audio frames. An aggregate feature is ready for similarity measurement whereas individual low-level audio feature frames are not. The chosen time scale for aggregate features depends on the specificity and temporal acuity of the task.
These low-level audio features and their aggregate representations are used as the first stage in bottom-up processing strategies. The task is often to obtain a high-level representation of music as a next step in the processing of music content. The following section gives a summary of some of the approaches to bridging the gap between low-level and high-level music tasks such as these.
Fig. 4.Beat tracking a music file with beatroot tool. Lower portion of graph shows audio power and upper portion shows spectrogram. Dark vertical lines are beat positions. Numbers running along top of graph are inter-beat intervals in milliseconds.
I I I .
AUD I O A NA L Y SI S
In contrast to speech recognition and text IR systems, most music has several streams of related information occurring in parallel. As such, music is organized both horizontally
(in time), and vertically (in frequency). Furthermore, the information in music is constructed with hierarchical schemas. Systems for analyzing and searching music content must seek to represent many of these viewpoints simultaneously to be effective.
As discussed in Section II-B, one of the intermediate goals of MIR is to extract high-level music content descriptions from low-level audio processes. The following sections describe research into extracting such high-level descriptions with a view to transforming musical audio content into representations that are intuitive for humans to manipulate and search. We begin the discussion with the related high-level music description problems of beat tracking, tempo estimation, and meter tracking.
A. Beat Tracking
Automatic estimation of the temporal structure of music, such as musical beat, tempo, rhythm, and meter, is not only essential for the computational modeling of music understanding but also useful for MIR. Temporal pro-perties estimated from a musical piece can be used for content-based querying and retrieval, automatic classi-fication, music recommendation, and playlist generation. If the tempo of a musical piece can be estimated, for example, Table 4Frame Aggregation Methods for Low-Level Audio Features
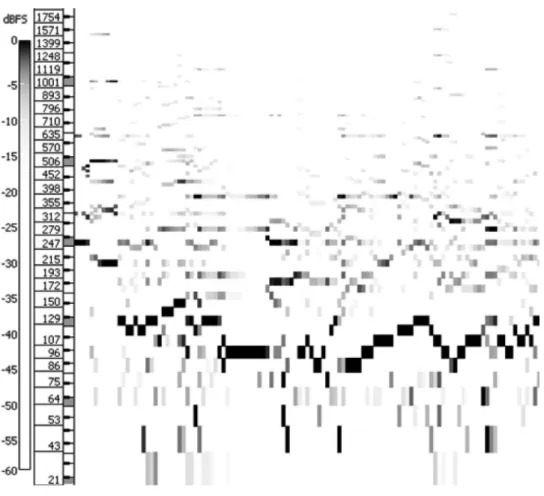
Fig. 5.Predominant f0 trajectory of Charlie Haden jazz track shown in SonicVisualiser. Darker regions are maxima of this time versus logarithmic frequency spectrogram. Vertical axis is laid out as a piano keyboard for musical pitch reference.
it is easy to find musical pieces having a similar tempo without using any metadata. Once the musical beats are estimated, we can use them as the temporal unit for high-level beat-based computation instead of low-level frame-based computation. This facilitates the estimation of other musical descriptions, such as the music struc-ture and chorus sections [22]. Since the estimated beats can also be used for normalizing the temporal axis of musical pieces, the beat-based time alignment facilitates time-scale invariant music identification or cover song identification [28], [29].
Here, we define beat tracking (including measure or bar-line estimation) as the process of organizing musical audio signals into a hierarchical beat structure [30]. The typical beat structure comprises the quarter-note level (the tactus level represented as almost regularly spaced beat times) and the measure level (bar lines). The basic nature of tracking the quarter-note level is represented by two parameters.
Period: The period is the temporal difference between the times of two successive beats. The tempo (beats per minute) is inversely proportional to the period.
Phase: The phase corresponds to actual beat positions and equals zero at beat times.
On the other hand, the measure level is defined on beat times because the beat structure is hierarchical: the begin-nings of measures (bar-line positions) coincide with beat times. The difficulty of beat tracking depends on how explicitly the beat structure is expressed in the target music: it depends on temporal properties such as tempo changes and deviations, rhythmic complexity, and the presence of drum sounds.
1) Tracking Musical Beats (Quarter-Note Level):The basic approach of estimating the period and phase of the quarter-note (tactus) level is to detect onset times and use them as cues. Many methods assume that a frequently occurring inter-onset interval (IOI), the temporal difference be-tween two onset times, is likely to be the beat period and that onset times tend to coincide with beat times (i.e., sounds are likely to occur on beats).
To estimate the beat period, a simple technique is to calculate the histogram of IOIs between two adjacent onset times or cluster the IOIs and pick out the maximum peak or the top ranked cluster within an appropriate tempo range. This does not necessarily correspond to the beat period, though. A more sophisticated technique is to calculate a windowed autocorrelation function of an onset-time se-quence, power envelope, or spectral flux of the input signal, or continuous onset representation with peaks at onset positions, and pick out peaks in the result. This can be considered an extended version of the IOI histogram be-cause it naturally takes into account various temporal dif-ferences such as those between adjacent, alternate, and every third onset times. Another sophisticated technique is to apply a set of comb-filter resonators, each tuned to a
possible period, to the time-varying degree of musical accentuation [31].
For audio-based beat tracking, it is essential to split the full frequency band of the input audio signal into several frequency subbands and calculate periodicities in each subband. Goto [30] proposed a method where the beat-period analysis is first performed within seven logarith-mically equally spaced subbands and those results are then combined across the subbands by using a weighted sum. Scheirer [31] also used the idea of this subband-based beat tracking and applied a set of comb-filter resonators to the degrees of musical accentuation of six subbands to find the most resonant period. To locate periodicity in subband signals, Sethares and Staley [32] used a periodicity transform instead of using comb-filter resonators.
After estimating the beat period, the phase should be estimated. When onset times are used to estimate the period, a windowed cross-correlation function is applied between an onset-time sequence and a tentative beat-time sequence whose interval is the estimated period. The result can be used to predict the next beat in a real-time beat-tracking system. On the other hand, when the degrees of musical accentuation are used, the internal state of the delays of comb-filter resonators that have lattices of delay-and-hold stages can be used to determine the phase [31]. To estimate the period and phase simultaneously, there are other approaches using adaptive oscillators [33].
2) Dealing With Ambiguity: The intrinsic reason that beat tracking is difficult is due to the problem of inferring an original beat structure that is not expressed explicitly. This causes various ambiguous situations, such as those where different periods seem plausible and where several onset times obtained by frequency analysis may corre-spond to a beat.
There are variations in how ambiguous situations in determining the beat structure are managed. A traditional approach is to maintain multiple hypotheses, each having a different possible set of period and phase. A beam search technique or multiple-agent architectures [30], [34] have been proposed to maintain hypotheses. A more advanced, computationally intensive approach for examining multi-ple hypotheses is to use probabilistic generative models and estimate their parameters. Probabilistic approaches with maximum likelihood estimation, MAP estimation, and Bayes estimation could maintain distributions of all parameters, such as the beat period and phase, and find the best hypothesis as if all possible pairs of the period and phase were evaluated simultaneously. For example, Hainsworth and Macleod [35] explored the use of par-ticle filters for audio-based beat tracking on the basis of MIDI-based methods by Cemgil and Kappen [36]. They made use of Markov chain Monte Carlo (MCMC) algo-rithms and sequential Monte Carlo algoalgo-rithms (particle filters) to estimate model parameters, such as the period and phase.
3) Estimating Beginnings of Measures (Measure Level): Higher level processing using musical knowledge is ne-cessary to determine the measure level of the hierarchical beat structure. Musical knowledge is also useful for selecting the best hypothesis in the above ambiguous situations.
Various kinds of musical knowledge have been studied. Goto [30] used musical knowledge concerning chord changes and drum patterns with a focus on popular music. By estimating the chord changes using signal processing technique, for example, the beginnings of measures can be determined so that chords are more likely to change on those positions. On the other hand, Klapuriet al.[38] used musical knowledge concerning temporal relationship among different levels of the hierarchical beat structure and encoded this prior knowledge in HMMs that could jointly estimate periods at different hierarchical levels and then separately estimate their phases.
4) Conclusion: The topic of beat tracking still attracts many researchers because it includes fundamental issues in understanding temporal aspects of music, contributes to a number of practical applications, and it is difficult to achieve perfect beat tracking for various kinds of music. Therefore, new approaches are proposed every year, including holistic beat tracking [39] where information about music structure estimated before beat tracking helps to track beats by adding a constraint that similar segments of music should have corresponding beat structure. B. Melody and Bass Estimation
Automatic estimation of melody and bass lines is important because the melody forms the core of Western music and is a strong indicator for the identity of a musical piece, see Section II-B, while the bass is closely related to the harmony. These lines are fundamental to the percep-tion of music and useful in MIR applicapercep-tions. For example, the estimated melody (vocal) line facilitates song retrieval based on similar singing voice timbres [41], music retrieval/classification based on melodic similarities, and music indexing for query by humming which enables a user to retrieve a musical piece by humming or singing its melody. Moreover, for songs with vocal melody, once the singing voice is extracted from polyphonic sound mixtures, the lyrics can be automatically synchronized with the singing voice by using a speech alignment technique and can be displayed with the phrase currently being sung highlighted during song playback, like the Karaoke display [42].
The difficulty of estimating melody and bass lines depends on the number of channels: the estimation for stereo audio signals is easier than the estimation for monaural audio signals because the sounds of those lines tend to be panned to the center of stereo recordings and the localization information can help the estimation. In general, most methods deal with monaural audio signals
because stereo signals can be easily converted to monaural signals. While a method depending on stereo information cannot be applied to monaural signals, a method assuming monaural signals can be applied to stereo signals and can be considered essential to music understanding, since human listeners have no difficulty understanding melody and bass lines even from monaural signals.
Here, melody and bass lines are represented as a con-tinuous temporal-trajectory representation of fundamen-tal frequency (F0, perceived as pitch) or a series of musical notes. It is difficult to estimate the F0 of melody and bass lines in monaural polyphonic sound mixtures containing simultaneous sounds of various instruments, because in the time-frequency domain the frequency components of one sound often overlap the frequency components of simultaneous sounds. Even state-of-the-art technologies cannot fully separate sound sources and transcribe musical scores from complex polyphonic mixtures. Most melody and bass estimation methods therefore do not rely on separated sounds or transcribed scores but directly estimate the target melody and bass lines from music that has distinct melody and bass lines, such as popular songs.
1) Estimating Melody and Bass Lines by Finding the Predominant F0 Trajectory: Since the melody line tends to have the most predominant harmonic structure in middle-and high-frequency regions middle-and the bass line tends to have the most predominant harmonic structure in a low-frequency region, the first classic idea of estimating melody and bass lines is to find the most predominant F0 in sound mixtures with appropriate frequency-range limitation. In 1999, Goto [43], [44] proposed a real-time method called PreFEst (Predominant-F0 Estimation method) which detects the melody and bass lines in monaural sound mixtures. Unlike most previous F0 estimation methods, PreFEst does not assume the number of sound sources.
PreFEst basically estimates the F0 of the most predo-minant harmonic structureVthe most predominant F0 corresponding to the melody or bass lineVwithin an in-tentionally limited frequency range of the input sound mixture. It simultaneously takes into consideration all possibilities for the F0 and treats the input mixture as if it contains all possible harmonic structures with different weights (amplitudes). It regards a probability density function (PDF) of the input frequency components as a weighted mixture of harmonic-structure tone models (represented by PDFs) of all possible F0s and simulta-neously estimates both their weights corresponding to the relative dominance of every possible harmonic structure and the shape of the tone models by maximuma posteriori probability (MAP) estimation considering their prior distribution. It then considers the maximum-weight model as the most predominant harmonic structure and obtains its F0. The method also considers the F0’s temporal continuity by using a multiple-agent architecture.
Because this original PreFEst simply estimates the predominant F0 trajectory every moment and does not distinguish between sound sources, Fujihara et al. [45] extended it to discriminate between vocal and nonvocal sounds with the focus on songs with vocal melody. This method evaluates theBvocal[probabilities of the harmonic structure of each F0 candidate by using two Gaussian mixture models (GMMs) for vocal and nonvocal. This extension resulted in improvement of the estimation accuracy. In addition, the original PreFEst inevitably detects the F0 of a dominant accompaniment part in the absence of a melody line. Fujiharaet al.[45] extended it to identify vocal sections where the vocal melody line is actually present by using a two-state Hidden Markov model (HMM) with vocal and nonvocal states.
Marolt [46] also used another implementation of the PreFEst with some modifications to represent the melody line as a set of short vocal fragments of F0 trajectories. The advantage of this method is that F0 candidates are tracked and grouped into melodic fragments, which are then clustered into the melody line. The melodic fragments denote reasonably segmented signal regions that exhibit strong and stable F0 and are formed by tracking temporal trajectories of the F0 candidates.
Paivaet al.[47] proposed a method of obtaining MIDI-level note sequence of the melody line, while the output of PreFEst is a simple temporal trajectory of the F0. The basic idea is the same as the PreFEst concept that the F0 of the most predominant harmonic structure is considered the melody. The method first estimates predominant F0 candidates by using correlograms, quantizes their fre-quencies to the closest MIDI note numbers, and forms temporal trajectories of the F0 candidates. Then, the trajectories are segmented into MIDI-level note candi-dates by finding a sufficiently long trajectory having the same note number and by dividing it at clear local minima of its amplitude envelope. After eliminating inappropriate notes, the melody note sequence is finally obtained by selecting the most predominant notes according to heuristic rules.
Li and Wang [48] proposed a method of detecting the vocal melody line. It first uses a 128-channel gammatone filter bank and splits these channels into two subbands at 800 Hz. To extract periodicity information, an autocorre-lation is calculated on the filter output of each channel in the low subband while this is done on the output envelope of each channel in the high subband. Plausible peaks are then selected in both autocorrelation results and are used to score a collection of F0 hypotheses. The method finally tracks the most probable temporal trajectory of the predominant F0 in the scored F0 hypotheses.
2) Knowledge-Based or Classification-Based Estimation of Melody Lines: Eggink and Brown [49] proposed a knowledge-based method of detecting the melody line with the emphasis on using various knowledge sources to
choose the most likely succession of F0s as the melody line. Unlike other methods, this method is specialized for a classical sonata or concerto, where a solo melody instru-ment can span the whole pitch range, so the frequency-range limitation is not feasible. In addition, because the solo instrument does not always have the most predomi-nant F0, additional knowledge sources are indispensable. The knowledge sources include local knowledge about an instrument recognition module and temporal knowledge about tone durations and interval transitions. Those sources can both help to choose the correct F0 among multiple concurrent F0 candidates and to determine sections where the solo instrument is actually present.
Poliner and Ellis [50] proposed a classification-based method that uses a set of support vector machine (SVM) classifiers. Each classifier is assigned to a particular F0 quantized to the semitone level (i.e., a different MIDI note number) and is trained on polyphonic sound mixtures with correct melody annotations so that it can judge whether each audio frame has the melody of the assigned F0. The overall melody trajectory is finally smoothed by using an HMM. The advantage of this method is that it does not make any assumptions beyond what is learned from its training data.
3) Conclusion:Although even state-of-the-art technolo-gies for automatic transcription or sound source segrega-tion have had significant difficulty dealing with complex polyphonic sound mixtures containing singing voices and sounds of various instruments (even drums), most above-mentioned state-of-the-art technologies for automatic melody/bass estimation can deal with such music record-ings and are useful in many applications. This practical sub-(or reduced) problem (so-called predominant melody/F0 estimation/detection) that was first proposed by Goto [43], therefore, has attracted a lot of researchers since 1999 and has resulted in various approaches. In a recent interesting approach by Ryynanen and Klapuri [51], even a multiple F0 estimation method designed for poly-phonic music transcription is used as a front-end feature extractor for this problem; comparisons of various methods are discussed in [56].
C. Chord and Key Recognition
Musical chords and key information are an important part of Western music and this information can be used to understand the structure of music. Currently, the best performing chord- and key-recognition systems use HMMs to unify recognition and smoothing into a single probabi-listic framework.
In an HMM, a musical performance is assumed to travel through a sequence of states. These states are hidden from the recognizer because the only thing we can see is the acoustic signal. Thus, an HMM consists of a transition matrixVa probabilistic model of the state sequenceVand an output modelVa probabilistic distribution that encodes
the probability that one of the states produces the signal that we measure. In a chord-recognition system there are, typically, 24 or 36 chords, each represented by one state. The acoustic signal is represented as a set of chromagram frames so the output model represents the probability that each state (chord) produces any given chromagram signal. The beauty of an HMM is that it is relatively easy to evaluate this model and find the sequence of states that best fits the observed data. By training different chord-recognition systems for each key, we can simultaneously recognize a musical key and the best chord sequence.
Sheh and Ellis [52] proposed the first HMM-based chord recognizer, and this idea was refined by Bello and Pickens [53]. Both of these systems were hampered by a shortage of labeled training data, so Bello and Pickens built part of their model using human knowledge. A system by Lee and Slaney [54] used a large database of symbolic musical scores to obtain chord ground truth (via symbolic musical analysis) and acoustic waveforms (via synthesis) and match their performance. About the same time, Harteet al.[55] proposed a new 6-D feature vectorVcalled tonal centroidVbased on harmonic relationships in western music. This feature proved to have even better performance in Lee’s system, and the switch was
straightforward because the system is entirely based on training data. This machine-learning based solution is promising because speech recognition has taught us that it is always better to have more data, and learning from symbolic music data is more cost effective.
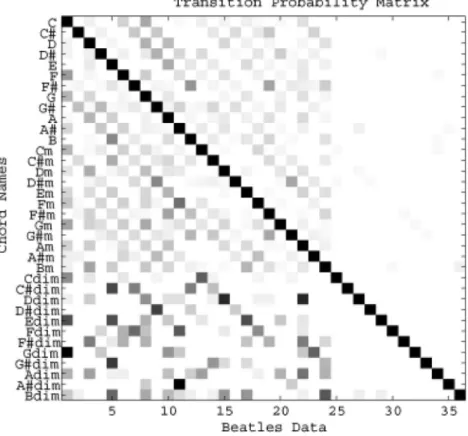
The results of a chord-recognition model are shown in Figs. 6 and 7. Fig. 6 shows the transition matrixVthe probability of moving from any one chord to any other chord on a frame-by-frame basis. Thus, when starting with a C chord (the top row of the figure) one is most likely to move to a F chord in Lee’s classical music or a G chord in Beatles music. The resulting musical segmentation is shown in Fig. 7, which shows a sequence of chords over 22 seconds.
D. Music Structure
Segmentation in MIR is both an end in itself and a means to improve performance in some other task; indeed, we have already discussed two kinds of segmentation (beat tracking and chord recognition) in Section III-A, where the segments are chords, and III-C, where the segments ex-tracted are the temporal regions between beats or the du-ration of a chord. Beat-based segmentation has been found to improve performance in cover song identification [28]
Fig. 6.A 36!36 transition probability matrices obtained from 158 pieces of Beatles’ music. For viewing purposes, we show logarithm of original matrix. Axes are labeled in the order of major, minor, and diminished chords. Right third of this matrix is mostly zero because a musical piece is unlikely to transition from a major or minor chord to a diminished chord; bottom left third of matrix shows that once in a diminished chord, music is likely to quickly transition back to a major or minor chord. Reprinted with permission from Lee [54].
by enabling matching between tracks that is invariant to both tempo and, more relevantly for this section, re-ordering of musical structure; for example, verse-chorus-verse in one version matches verse-chorus-verse-verse-chorus-verse-chorus-verse-chorus-verse in another. Recently, automatic structure extraction has been used to facilitate editing of audio in recording workflows [57].
Audio similarity, discussed further in Section IV, also benefits from segmenting the tracks beforehand; even a simple segmentation, removing the starts and ends of tracks as in [58], allows a similarity measure based on audio signal analysis to improve in performance by remov-ing unrepresentative material (intro and outro) from consideration; a segmentation of the form outlined below allows this removal of unrepresentative content in a less ad hoc manner. This has implications for recommender systems, as in the SoundBite system [59], which uses a structural segmentation to generate representative thumb-nails for presentation and search.
A segment, in music information, is a region with some internal similarity or consistency. Segments include both regions that are approximately homogeneous in a feature space, such as timbre or instrumentation, and those which have some relationship with other regions either in the same or different musical works. With this definition, a segment implies that it has temporal boundaries at its start and end; however, a pair of boundaries does not neces-sarily imply that there is a segment between them, as segments in general may overlap or have gaps between them, and there is no one single hierarchical arrangement for all segments.
The scales of interest for musical segments range from the region between successive onsets in a track (of the order of 100 ms) to entire movements (thousands of seconds) within a large, monolithic audio recording, a complete opera for example. There are tasks relating to all timescales between these extremes, such as segmenting a track into beats at the tactus level or musical phrases; performing a structural segmentation of a popular music track into sections which can be identified as the verse, chorus, or bridge; and separating speech from audio or distinct tracks from each other (for example, within a streaming broadcast [60] for royalty distribution or within a large archive such as archive.org for detection of copyright infringement).
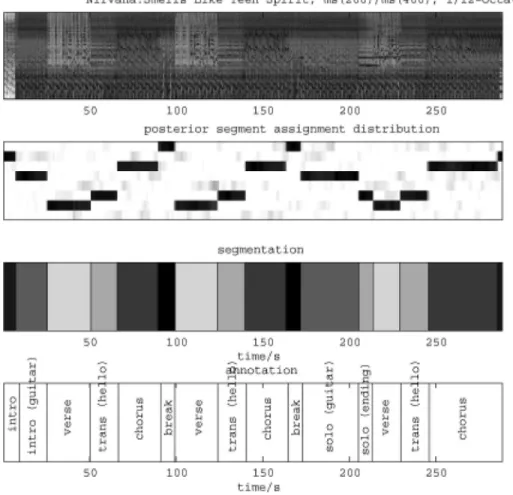
1) Structural Analysis: One segmentation task is to ex-tract the high-level structure of a track from just the audio; applications for this include chorus-detection for music sales kiosks [61] or retrieval result presentation [62]. An important component of these tasks is how knowledge of the kind of music being analyzed, and the kind of segments being retrieved, affects the features and algorithms used.
Fig. 8 shows an automatic segmentation using the method detailed in [63] of a pop track, along with an ex-pert’s annotation of segments from the same track. Note that the segmentation matches the annotation closely: apart from the identification of the solo ending and the transition, each annotation is algorithmically given a dis-tinct label. However, despite the close match between algorithmic segmentation and human annotation in Fig. 1,
Fig. 7.Recognition results for Bach’s Prelude in C Major performed by Glenn Gould. Below 12-bin chromagram are ground truth and recognition result using a C major key HMM trained on classical symbolic music. Reprinted with permission from Lee [54].
care must be taken in evaluating the performance of a segmentation method for segment retrieval.
It is not sufficient to compare the output of a segmenta-tion method against single, unambiguousBground truth,[
because many different divisions of music tracks can be consideredBcorrect.[Different expert listeners will differ in their judgments, for instance segmenting at different hierarchy levels [64] or with different criteria for seg-ment boundaries. Rather than a direct comparison with a single ground truth, it may be useful to elicit responses to segmentations using a forced-choice [65] or recognition-memory [66] paradigm, or else to ask several experts for quantitative ratings of segmentations in a manner similar to [67].
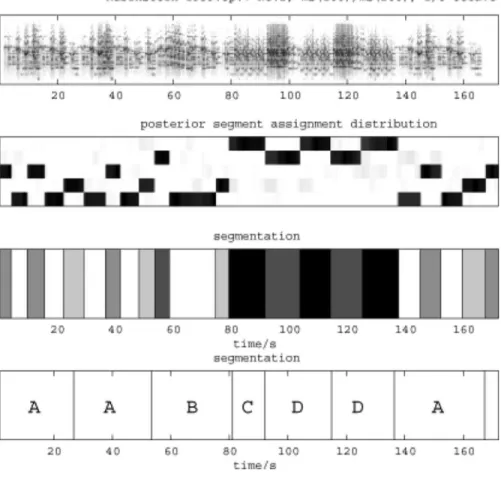
2) Smoothing: Fig. 9 shows a segmentation using the same algorithm and textural feature type as in Fig. 8. In this case, the machine-generated segmentation does not directly reflect the ground truth structural annotation; indeed, it would be surprising if it did, as sections in classical music are not generally associated with a single texture. Nevertheless, there is a clear correspondence
be-tween the segmentation and the annotation, and it is possible to recover the repeated structure labels from this segmentation, even given the expressive performance [68], [69], because the segmentation has acted to smooth over small variations. Again, the subsequent task (for which the segmentation acts as a preprocessing or smoothing stage) will dictate, or at least suggest, a particular segmentation algorithm or set of parameters: for instance, in the task above (detecting repeated structure in classical music) it is important that the segments generated are sufficiently large that the subsequent matching is robust against small variations, while being smaller than the repeated sections being searched for.
3) Application to Content-Based Retrieval: Segmentation additionally allows for control of the characteristics of content-based retrieval applications in two ways: firstly, segmentation of the database allows for indexing to be done over regions of homogeneity, yielding potential space savings over a simple frame-based feature vector with no loss of retrieval performance. Secondly, segmentation of the provided query datum, as well as giving the potential
Fig. 8.Segmentation of Nirvana’s Smells Like Teen Spirit (top panel: spectrogram; segmentation in middle two panels) along with annotation by a human expert (bottom panel).
for direct matching, permits implementation of searches of different specificity, matching the sequence of segments directly, or arbitrarily permuted, or matching a subset of query segments within a single database record; all have application in MIR.
I V .
AUDIO SIMILARITY-BASED RETRIEVAL
The results of the systems described in Sections II and III have been applied to the wide spectrum of tasks collectively
called audio similarity-based retrieval. Fig. 10, adapted from [73], illustrates the specificity spectrum for these tasks as well as the audio/music semantic gap that is in-herent to it. The tasks on the left of the semantic gap are those requiring matching of specific audio content (high-to-mid specificity systems) and those on the right require matching of high-level music content or concepts only (mid-to-low specificity systems).
Work in audio similarity started at the two extremes of the specificity spectrum and is gradually working its way
Fig. 10.Audio similarity specificity spectrum. Tasks on the left of audio/music semantic gap locate specific audio content in a new context. Tasks on the right are invariant to specific audio content but are sensitive to high-level music content. Lower text shows aggregation approach for low-level features.
Fig. 9.Segmentation of Rubenstein’s 1939 performance of Chopin’s Mazurka Op. 7 No. 2. (top panel: spectrogram; segmentation in middle two panels) along with annotation by a human expert (bottom panel).
inwards toward the semantic gap. It would seem that tasks near the audio/music semantic boundary are among the hardest for MIR. Situated on the right-hand side of the specificity spectrum, an often-cited work is Logan and Salomon [19], who conducted experiments on audio simi-larity in a database of 8000 tracks, consisting of popular songs in different genres using histograms of 16 clusters of MFCC features per track with clusters extracted using a k-means algorithm. The distance between two Gaussian distributions can be measured using the Kullback-Leibler divergence but this is not possible between two different sets of probability distributions, as in histograms of per-track clusters. Instead, they used the earth mover’s dis-tance (EMD). Their results reported an average precision of 50% relevant songs in the top five ranked songs for each query.
This work was extended by Aucouturier and Pachet [70] to use Gaussian mixture models (GMM) of MFCC features. Among the evaluation methods used was mea-suring the precision in terms of the number of songs returned that were labeled with the same genre as the query. Relevance was therefore measured by similar cul-tural metadata to the query.
A large number of other studies has explored the idea of retrieving musical tracks by global statistical features, so many, that in 2006 and 2007 the MIREX exchange con-ducted evaluations on low-specificity audio similarity [15], [16]. The task was to produce a similarity ranking between 5000 pop music tracks chosen from two pop music test sets. Each entry was tasked to produce a 5000 !5000 inter-song distance matrix.
Of the totality of 5000 queries, 60 tracks were randomly selected as queries and the first five most highly ranked songs out of the 5000 were extracted for each query. For each query, the returned results from all par-ticipants were grouped and were evaluated by a team of human graders, 24 in 2006. Graders provided a categorical score (not similar, somewhat similar , and very similar) and one fine similarity score (0–10) for pairs of tracks. The performance was evaluated by comparing the system re-sults to the human evaluated similarities. The best per-forming system as evaluated by the human fine-scale similarity judgment scored an average of 0.43 in 2006 and 0.51 in 2007, as shown in Table 3.
On the left-hand side of the audio similarity specificity spectrum are queries for the same audio content. Here, there are audio fingerprinting systems which seek to iden-tify specific recordings in new contexts, as in [60] and [72]; and moving right, towards the center of the spec-trum, there are high-to-mid specificity systems where the correct answers to the audio query are not always from the same recording. In this regard, systems for identifying remixed audio content were introduced in [73] and [75]. The motivation behind such systems is to normalize large music content databases so that a plethora of versions of the same recording are not included in a user search and to
relate user recommendation data to all versions of a source recording including: radio edits, instrumental, remixes, and extended mix versions.
Finally, to the right of the audio/music semantic gap, in the mid-to-low audio similarity specificity range, the user seeks specific musical content of the query audio but not necessarily the same audio content. These are among the most challenging problems for audio similarity-based MIR systems. Examples are: find the same work by the same performer recorded at a different time or place; find the same work by a different performer (cover songs) [28], [29]; find a different work containing similar melodic content (musical quotations); or find a different work containing similar harmonic sequences (musical idioms). The cover song task was studied in MIREX 2006 and 2007 with an average precision of 52% [29] in 2007.
It must be noted that all of the tasks in the mid-specificity part of the audio-similarity spectrum are solved by approaches using sequences of features; the tasks on the far right of the spectrum are solved by bag-of-frames models that disregard sequences of features.
In the following sections we present two use cases for mid-specificity queries: misattribution, where a recording has been accidentally or deliberately given the incorrect factual information, and opus retrieval, where the goal is to retrieve different versions of the same classical work (a form of cover song retrieval).
1) Use Case 1: Apocrypha (Detecting Misattribution): Apocrypha in audio recordings are those works that are falsely attributed to an artist when they have been per-formed or composed by a different artist. A recent com-mercial example of this occurred in the Classical music repertoire, in which a significant number of recordings (100 CDs) were released by the Concert Artists recording label during the 1990s in the U.K. falsely claiming new complete recordings of various Classical composer’s reper-toires (such as Chopin Mazurkas) [76], [77]. It was eventually discovered that these recordings were re-releases of decades-old performances by different artists under the control of different labels.
It took many years for the experts to discover that these recordings were not authentic [77]. This was in part due to the apocrypha recordings’ signal treatment; they were filtered and time-compress/expanded to make them sound slightly different to the originals. The goal of the mis-attribution task, then, is automatic detection by audio similarity on a large collection of recordings of perfor-mances of the same works. Those recordings falling within a predetermined distance threshold, obtained by measur-ing similarities between recordmeasur-ings known to be different, are candidate misattributions orapocrypha. The specificity of this task is similar to that of audio fingerprintingVto establish whether two recordings are acoustically identical, but for some degree of signal transformation and distortion such as filtering or time compression/expansion.
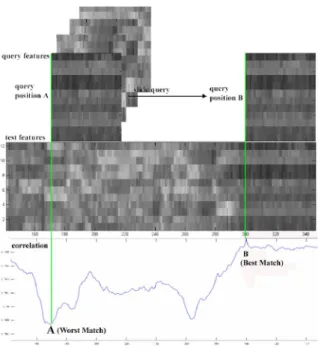
To admit temporally specific similarity, audio features are concatenated into sequences of features called shingles as illustrated in Fig. 11; this is the approach used in [28], [29] and [73]–[75]. Because silent regions between tracks would otherwise match, shingles are ejected from the database if the power falls below a given absolute thresh-old. To compute the similarity of two tracks, invariant to global structural changes, the pair-wise similarity of all the shingles are computed and counts of the number that fall below a distance threshold. This threshold is determined by measuring the PDF of known nonsimilar shingles for the task. For example, those tracks with a high number of shingles in common are likely candidates for Apocrypha. Fig. 12 shows how the decision boundary for similar shingles is calculated from a sample of known nonsimilar shingles. The decision boundary is the point at which the null hypothesisVthat shingles are drawn from the set of nonsimilar shinglesVis rejected. Therefore, distances below this value are due to similar shingles.
Using the statistical test method outlined above, all 49 known misattributed recordings in the database of 2700 Chopin Mazurka recordings by 125 artists were retrieved with rank 1; these were the known apocryphal Joyce Hatto, actually Eugene Indjic, recordings that had been reported in the press. However, in the experiment another 11 mis-attributed recordings were found by a se-cond apocryphal pianist, Sergei Fiorentino, whose work
Fig. 12.Fit of distribution of nonapocrypha shingle distances to a!2distribution using maximum likelihood estimation. Distances belowxmin, here 0.09 which is 1% of the CDF, are from similar shingles. Reprinted with permission from Casey et al. [75].
Fig. 11.Audio shingling; audio features are concatenated into sequences of 1 to 30 seconds duration. Input query sequence is compared with all subsequences of database of the same length. Nearest neighbor search is hence performed by a multidimensional matched filter. NaBBBve implementations have O(n) time complexity but sublinear algorithms, such as LSH [118], [119], are employed in
had been sampled from three different artists. The new mis-attributions were not previously disclosed in the classi-cal music literature. At least four well-known classiclassi-cal music labels’ rights had been infringed in this single collec-tion of Chopin recordings. In each case, the infringement was by the same record label.
2) Use Case 2: Opus Retrieval:Opus retrieval starts with a query performance, in this case of one of the Chopin Mazurkas, and retrieves performances of the same work from a large database containing different performances of the same work. The task is difficult because performances by different artists possess significant differences in expressive interpretation of the music. Furthermore, each performance differs in its structure due to choices in performing repeats. In the Apocrypha task, the audio was in common between similar tracks, in the Opus task, it is the musical content that is in common, not the audio.
A precision-recall graph for the Opus retrieval task is shown in Fig. 13. Overall, the precision was very high for recall rates below 90%. For most of the 49 Mazurkas, there were two to three outliers in the database. On inspection, these were typically early recordings that were transferred from 78 r/min shellac media and contained a high degree of surface noise and extreme wideband filtering; additionally, the cutoff frequency for these tracks was typically much lower than the remaining tracks. These results suggest that a near-perfect score can be obtained for Opus retrieval if outlying recordings are first removed or preprocessed to make them compatible with the retrieval method.
V.
N O T AT E D M U S I C
Representing music as a pointset in a 2-D space has a tradition of many centuries. Since the 13th century on, music has been written as a set of notes, represented by points in a 2-D space, with time and pitch as coordinates. Various characteristics are associated with the notes using different symbols for different note durations, for example. The look of written music has changed some-what over the past centuries, but the basic idea of repre-senting music as a weighted point set has been followed for almost a millennium, and it has served composers and performers well.
In addition to audio analysis and retrieval, MIR on notated music also has applications in commerce, research, and education. Whereas the audio retrieval tasks are primarily useful at the level of genre and specific instances of music, the analysis and retrieval of notated music is more targeted to the level of composers and artists and their works. Because music notation is more symbolic than audio, the feature extraction and analysis are different. However, the matching of derived features can be very similar in both domains.
A. Symbolic Melody Similarity
1) String-Based Methods for Monophonic Melodies: Monophonic music can be represented by 1-D strings of characters, where each character describes one note or one pair of consecutive notes. Strings can represent interval sequences, gross contour, sequences of pitches and the
Fig. 13.Precision-recall graph for Opus retrieval task. Each of 49 works had between 31 and 65 relevant items out of a 2257-track database. Results indicate 88% precision at 80% recall. Rapid falloff in precision is due to outlying recordings made in early 20th century.
like, and well-known string matching algorithms such as algorithms for calculating edit distances, finding the longest common subsequence, or finding occurrences of one string in another have been applied, sometimes with certain adaptations to make them suitable for matching melodies.
Some MIR systems only check for exact matches or cases where the search string is a substring of database entries. For such tasks, standard string searching algo-rithms like Knuth-Morris-Pratt and Boyer-Moore can be used. Themefinder [78] searches the database for entries matching regular expressions. In this case, there is still no notion of distance, but different strings can match the same regular expression. For approximate matching, it can be useful to compute an edit distance with dynamic programming. Musipedia is an example of a system that does this [79]. Simply computing an edit distance between query strings and the data in the database is not good enough, however, because these strings might represent pieces of music with different lengths. Therefore, it can be necessary to choose suitable substrings before calculating an edit distance.
More recently, Cilibrasiet al.[80] have suggested using an approximation to Kolmogorov distance between two musical pieces as a means to compute clusters of music. They first process MIDI representation of a music piece to turn it into a string from a finite alphabet. Then, they compute the distance between two music pieces using their normalized compression distance (NCD). NCD uses the compressed length of a string as an approximation to its Kolmogorov complexity. The Kolmogorov complexity of a string is not computable, but the compressed length approximation gives good results for musical genre and composer clustering.
For finding substrings that match exactly, the standard methods for indexing text can be used (for example, inverted files, B-trees, etc.). The lack of the equivalent of words in music can be overcome by just cutting melodies
into N-grams [81], where each N-gram is a sequence of N pitch intervals. For most edit distances that are actually useful, the triangle inequality holds. Therefore, indexing methods that rely on the triangle inequality property of the distance measure can be used, for example metric trees, vantage point trees, or the vantage indexing method described in [82].
2) Geometry-Based Methods for Polyphonic Melodies: Unlike string-based methods, set-based methods do not assume that the notes are ordered. Music is viewed as a set of events with properties like onset time, pitch, and duration. Clausenet al.[83] propose a search method that views scores and queries as sets of notes. Notes are defined by note onset time, pitch, and duration. Exact matches are supersets of queries, and approximate matching is done by finding supersets of subsets of the query or by allowing alternative sets. By quantizing onset times and by segmenting the music into measures, they make it possible to use inverted files.
Since weighted point sets seem to be so well suited to representing music, it feels natural to measure melodic similarity directly by comparing weighted point sets instead of first transforming the music into 1-D abstract representations.
Fig. 14 shows two melodies compared by matching the distribution of weighted points. Typkeet al.[82] also view scores and queries as sets of notes, but instead of finding supersets, they use transportation distances such as the EMD for comparing sets. They exploit the triangle in-equality for indexing, which avoids the need for quantizing. Distances to a fixed set of vantage objects are precalculated for each database entry. Queries then only need to be compared to entries with similar distances to the vantage objects. This approach was very successful in the symbolic melodic similarity track of the MIREX 2006 evaluation.
Ukkonenet al.[84] propose a number of algorithms for searching notated music. One method finds translations of
Fig. 14.Melodies of Handel and Kerll compared as we weighted point sets. Upper point set represents upper melody, lower point set the lower melody. Arrows indicate weight flow that minimizes transportation cost, i.e., corresponding to EMD.
![Fig. 8 shows an automatic segmentation using the method detailed in [63] of a pop track, along with an ex-pert’s annotation of segments from the same track](https://thumb-us.123doks.com/thumbv2/123dok_us/1039751.2637678/13.864.76.784.717.1067/shows-automatic-segmentation-using-method-detailed-annotation-segments.webp)