Factors Affecting Reuse Intention on Mobile
Shopping Application
Nadia Afira
1and Elevita Yuliati
1Abstract―Mobile apps have become a game changer in retail business. Consumers can shop anything through their smartphones anytime and anywhere. In Indonesia, various of online marketplaces such Tokopedia, Lazada, and Shopee have emerged giving customers many options to shop and they tend to switch channel easily to another shopping apps. This study tested a conceptual model describing the relationships among Technology Acceptance Model (TAM), flow, attitude towards mobile shopping apps and intention to reuse mobile shopping apps. The sample of this research is consumers who have experienced online shopping using mobile shopping apps. The data were collected from 181 respondents via online questionnaire survey. Structural Equation Modeling (SEM) was used for data analysis using AMOS version 22. The results show that perceived usefulness is significantly has a positive impact to flow while perceived ease of use is not significantly related to flow. Flow is positively related to attitude. In addition, the results indicated that attitude is one of the main predictors of consumers reuse intention towards mobile shopping apps and has a greater impact than the direct relation of perceived usefulness to reuse intention. This study extends the research scope of mobile shopping behavior and provided implications for mobile app retailing.
Keywords―Perceived Usefulness, Perceived Ease of Use, Flow, Reuse Intention.
I. INTRODUCTION1
Technology has changed how consumers shop. Nowadays, consumers have easy and flexible access to shop using their mobile devices since many retailers and providers offer online services as a way to expand their market share. Through mobile technology, consumers can utilize fragmented time, shop online anywhere, and obtain instant satisfaction [1]. Now that many retailers are being driven towards digital development, they are not only developing websites as a platform to meet consumer demand, but also applications (apps). As Indonesia is amongst the countries with the highest mobile adoption rates globally, and due to the increasing importance of the millennial population, apps have become part of everyday life. There is a high dependency amongst millennials on mobile devices when doing research such as product searches or price comparisons. Consumers also uses mobile devices and apps for purchasing. This is because in Indonesia, retailers usually offer extra promotions when
1Nadia Afira and Elevita Yuliati are with Department of Magister
Management, Universitas Indonesia, Jakarta, 10430, Indonesia. E-mail: [email protected]; [email protected].
purchases are made in apps, which leads consumers to purchase with mobile devices instead of via PCs or desktops.
Shifting consumer behavior into the digital world in conducting activities, making more companies and businesses start to move towards m-commerce to reach more market share, they not only launch websites for consumers looking for products or services but also start developing applications. Consumers feel that using mobile commerce especially shopping applications can provide several benefits such as product information, reviews, and store locations [2], [3]. In addition, according to Grewal (2012) mobile applications can provide services or products that are in accordance with the wishes of consumers [4]. This can be seen with shopping applications using a search history of products that consumers often search for.
Most shopping applications will provide or bring up similar products so consumers can search more easily. However, numerous of mobile shopping apps made consumers switch channel easily from another application to another.
As consumers are evolving along with advancement of mobile technology and proliferation of digital shopping channels, timely research is needed for understanding the consumer m-commerce adoption behavior. Theory to predict consumer intention to adopt is developed by Davis called Technology Acceptance Model (TAM). Similar with Davis, TAM is employed to describe users’ acceptance of a particular technology and their usage behaviors [5] TAM is the most frequently applied model in research regarding online shopping. Perceived usefulness and perceived ease of use are two essential factors in the evaluation of a technology.
In addition, according to a study conducted by [6] in an online context, researchers have theorized that flow experiences can attract consumers and significantly influence attitudes and subsequent behavior. Flow itself has the definition of a pleasant optimal experience intrinsically related to strong engagement, forgetting time, and increasing motivation [7]. Furthermore, the researchers revealed that experience is a significant determinant of consumer attitudes towards websites, thus increasing the intention to revisit or use a website and spend a longer time. As so many online marketplaces emerging, this study wants to find out how the relationship between TAM is a functional factor so that consumers use technology and
flow which are variables in terms of the experience of users in shopping which is described as one of the factors that can increase intention to reuse mobile shopping applications.
The past research showed that both perceived usefulness and perceived ease of use were significantly related to flow. While flow functioned as a full mediator between perceived usefulness and attitude. Flow was significantly related to attitude and purchase intention [1].
Based on the discussion above, this study aims to investigate the relationship among Technology Acceptance Model (TAM), flow, attitude towards mobile shopping apps and intention to reuse mobile apps. Online marketplace in Indonesia such Tokopedia, Bukalapak, Blibli, Lazada, and Shopee will be the object of this study as they offer almost the same service that can affect consumers choice on the mobile shopping platform.
II. LITERATUR REVIEW
A. Perceived Ease of Use and Perceived Usefulness in Technology Acceptance Model
The theory of Technology Acceptance Model was first introduced by Davis in 1989 and after that many other researchers began to develop TAM [5], [8]. TAM is an adaptation of Theory of Reasoned Action (TRA) theory by Fishbein and Ajzen in 1975, this theory states that the most important determinant of a person's behavior is from the intention to behave. Technology Acceptance Model (TAM) links technology user acceptance with the behavior of technology use. According to this model, the use of technology products is used depends on the intention to use which also makes consumers begin to behave and start using the technology.
The intention of consumers to use or adopt a technology is influenced by two main factors, namely if the emergence of perceived ease of use and perceived usefulness when using it. Perceived usefulness is described when technology provides benefits to users where an individual believes that a web can improve its performance such as taking less time or providing information in a timely manner. Whereas the perceived ese of use is when the user feels that the web used does not require a lot of effort. Several studies have shown that web quality has a positive impact on how users receive perceived usefulness and perceived ease of use [9].
In a study conducted by Davis (1989) it was found that perceived usefulness was the main predictor in consumer behavior intention to use a technology or system, while perceived ease of use greatly influenced the perceived usefulness level. Perceived usefulness is influenced by perceived ease of use because, the more users feel the ease of use of technology, the more users feel that the technology is useful and the intention to use arises. Another reason is that if the technology used is considered to be easy to use then the user can complete more work in
the same amount of time therefore, users feel the technology is useful. So that perceive ease of use and perceive of usefulness are the main variables in TAM [10]. When consumers feel a technology is useful, they tend to use the technology system. The process of individuals interested in using mobile phones to find shopping information can be described as useful, exciting and fun. This can continue to be a flow condition [11].
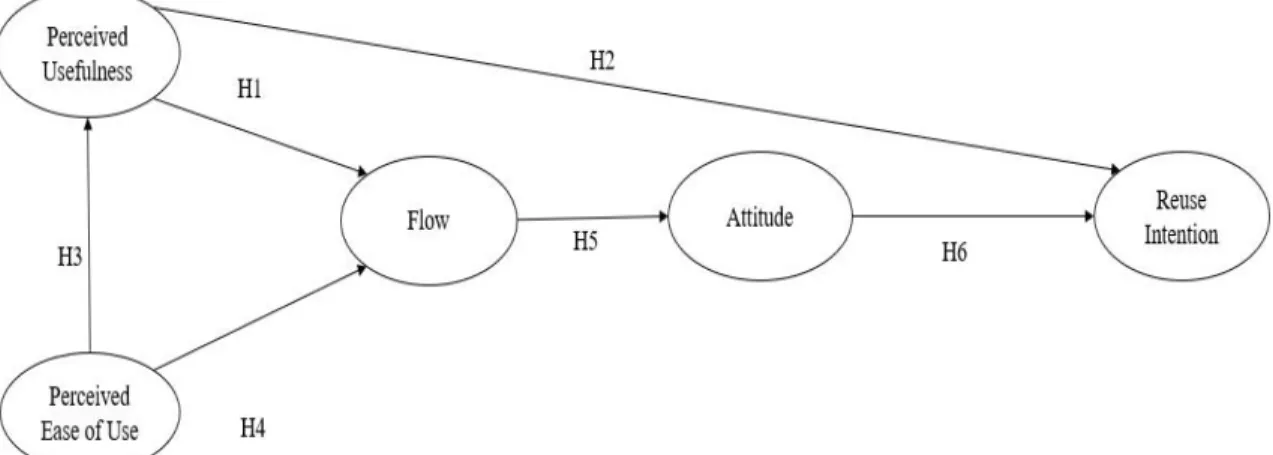
H1: Perceived Usefulness has a positive effect on flow.
H2: Perceived Usefulness has a positive effect on Reuse Intention.
B. Flow
Flow is a cognitive state that is characterized by a pleasant optimal experience intrinsically related to strong engagement, forgetfulness of time, and increased motivation [12]. In flow theory, people are fully absorbed in what they do and are motivated to repeat an activity. Flow can be experienced from various daily activities such as reading books, watching television or playing sports.
Hoffman and Novak (1996) adapted the theory of flow in the environment with computer media. Hoffman and Novak said that flow can be experienced by someone while doing online activities. In a computer-based environment, online flow is used as a centralized process in navigating web users [6], online games, and online shopping [13]. With flow theory, it is expected that with the stimulus given to online shopping environments such as color, design, and web quality, then when consumers shop, they can experience flow which causes positive consumer behavior. In the context of online shopping, existing empirical findings show that flow affects satisfaction [14], intention to buy [14], [15], and site visits [13].
When consumers explore online stores, positive interactions between humans and computers can cause a person to enter a state called flow [13], [14]. In addition, limited time makes consumers concentrate more on mobile devices such as applications or websites from the phase of searching for products to conducting transactions to maximize pleasure. When consumers enjoy the moment, they tend to buy goods or services. Therefore, enjoyment and concentration are used to measure the level of flow experienced by buyers in the mobile context.
H3: Perceived Ease of Use has a positive effect on Perceived Usefulness.
H4: Perceived Ease of Use has a positive effect on flow C. Attitude
Attitude involves a response that is consistent with the likes or dislikes of a person or individual towards an object. In other words, attitude is a representation of the level of preference shown by an individual towards an object [1]. Attitude refers to the evaluation of certain objects that lead to the development of a belief about object attributes. Attitude is an indicator that shows whether consumers like something or object or not. As a determinant of intention to
behave in the Technology Acceptance Model, attitude is a significant predictor in user acceptance of information technology.
Attitude is not only a determinant of whether an information technology is accepted by the user, attitude is also assessed as a sign in showing that there is customer satisfaction. Shiau and Luo, [16] that attitude reflects customer satisfaction with their online shopping experience. Attitude leads to satisfaction is the most significant factor in seeing whether consumers intend to do online shopping. In addition, the research conducted by Pookulangara, Hawley, and Xiao attitude is also a factor that influences consumers' intention to change media or places in shopping. Attitude towards the use of m-commerce positively leads to perceived satisfaction which results in consumers' intention to use m-commerce again. A pleasant online shopping experience produces a positive attitude that can increase self-efficacy and influence consumer intentions going forward [17]. The research conducted by Yang states that consumer attitude positively influences their purchase intention in the context of mobile shopping. Conversely, negative experiences will also have a negative impact [18], [19].
H5: Flow can positively influence attitude in online shopping in mobile apps
D. Intention
According to Ajzen and Fishbein consumer behavior can be predicted or reflected in consumer intentions (intention). So that it will be more effective if the company measures consumer intentions compared to measuring consumer behavior. Furthermore, Fishbein said that purchase intention has a relationship with the actual behavior of consumers.
Reuse intention is a plan or intention of the consumer who is consciously made to reuse a technology. While according to [20] Reuse Intention is a condition where consumers intend to re-make a purchase. Some studies say that in the online context, Reuse Intention is the possibility
of consumers returning to shop on the web because of shopping experiences [20], [21]. According to Hausman and Siekpe [15] the main factors that drive intention on consumers are consumer ratings of website quality, product information search, and product evaluation. Furthermore, the entertainment value provided by the web is positively related to reuse intention [22].
H6: Attitude in shopping online at mobile apps can positively affect Reuse Intention.
The model research can be seen in Figure 1. This research examined how TAM affect flow as the mediator of attitude towards Reuse Intention.
III. METHODOLOGY
A. Sampling and Data Collection
The sample of this research is online shoppers who use mobile shopping apps such Tokopedia, Lazada, Shopee, Blibli and Bukalapak. Online survey questionnaire was used to collect data. The questionnaire was pretested by 30 students who had experience online shopping via mobile shopping apps. Following pretest data collection, validity and reliability test was run using SPSS. The result of validity and reliability test indicated that the questionnaire was valid and reliable and can be used for the main test.
B. Measures
The measures scales were using likert scale from 1 to 6 as 1 reflects strongly disagree to 6 strongly agree with the statements given. The statement items and constructs were adapted from two articles which are [1], [21]. A pre-test was performed to identify unclear questionnaire words, using sample of 30 respondents who were selected among the students at the university. The pre-test’s result identified all the of the indicators are reliable and valid that can be used for the main test.
C. Data Analysis
Structural Equation Model (SEM) was used as a tool for testing the model. SEM was mainly used for the analysis because its ability to estimate multiple interrelated dependent relationship as in the research model [23]. AMOS 22 were used as statistical tools to carry out different analysis. The measurement model was tested for reliability and validity before SEM analysis was conducted. A measurement model using AMOS 22 with maximum likelihood estimation was used. Confirmatory Factor Analysis (CFA) was conducted to assess reliability and validity of the indicators using average variance extracted (AVE) and composite reliability (CR).
IV. RESULTS AND DISCUSSION
181 respondents were collected in the main test including 30 respondents from the pretest. The demographics of the respondents is shown in the appendix 1.
A. Reliability and Validity Measurement
To assess the reliability and validity of the measurement model CFA model was conducted. All of the items were
used and the results of CFA are reported in table 1. The result showed Composite Reliability (CR) and Average variance extracted (AVE) from the model, with threshold of acceptance for CR ≥ 0,7 and AVE ≥ 0,50 (Malhotra, 2010).
CR in this study ranged from 0,808 to 0,934 and AVE ranged from 0,586 to 0,780. In this CFA Analysis the final measurement for model fit showed that the overall model was good fit (goodness of fit index (GFI)= 0.891; normed fit index (NFI)= 0.860; incremental fit index (IFI)= 0.928; comparative fit index (CFI) =0.927; and root mean square error of approximation (RMSEA)=0.071). CFA results indicate that all items are related significantly (p<.001) to their hypothesized factors. Besides this, all the standardized loadings are greater than 0.5 [24] and the average loadings per factor are greater than 0.7 [23].
B. Hypothesis Testing
From Table 3 can be seen that 5 out of 6 hypotheses were supported. Six of them were H1, H2, H3, H5, H6. The rejected hypothesis was H4 that shows perceived ease of use doesn’t affect flow positively.
TABLE 1.
TABLE 2.
RESULT OF FIT MODEL
The results of hypothesis 1 test show that (𝛽 = 0.664, p-value is 0,000) so that it can be said that there is a positive relationship between Perceived of Usefulness and flow. This means that there is a connection between the perceived benefits of shopping application users and flow. This is supported by the results of the research of Hsu, Wu, & Chen showing that there is a positive relationship between Perceived of Usefulness towards flow. In addition, according to Oinas-kukkonen, when a technology is increasingly challenging, consumers feel the system is useful and can flow.
Based on the table the p-value value of the hypothesis 2 test is 0.093 so that hypothesis 2 is acceptable and there is a positive relationship between Perceived of Usefulness to Reuse Intention. According to [15] the main factors that drive Reuse Intention on consumers are consumer valuation of website quality, product information search, and product evaluation. This is related to how consumers feel the application used is useful in providing product information and a shorter time in finding the information sought. This can be seen from the descriptive statistics analysis where respondents feel that using their shopping application is faster in shopping. The results of testing hypothesis 3 state that Perceived ease of use has a positive effect on Perceived of Usefulness. Judging from the p-value that has a p-value of 0.000. This associates that when consumers use shopping applications and find it easy to use, consumers tend to feel the shopping application is useful without having to spend more effort. According to [9], that increasing ease of use will result in improved performance, ease of use will also have a direct effect on the benefits felt by consumers.
In the results of hypothesis 4 test it was found that the value of p-value was 0.619, so it can be concluded that there was no positive influence between perceived ease of use and flow. Although in some previous studies showed that perceived ease of use had an effect on flow, but in this study there was no significant effect. According to Hsu and Lu, mobile shopping services with a higher level of perceived ease of use tend to produce pleasant emotions, thereby encouraging consumers to enter flow conditions. Therefore, consumers consider technology and platforms to be easy to use as antecedents of flow in online shopping. In this study, the ease of shopping online is not a factor in the occurrence of flow conditions but when consumers feel the usefulness of the application, they will feel happier and
concentrate in finding products. There is a positive influence on the attitude of consumers in shopping online using the application. In flow conditions, positive emotions gradually affect consumers' buying attitudes and intentions in using shopping applications [17]. In addition, flow is an important factor in influencing consumer attitudes toward sites and companies. This study shows that when consumers from the online marketplace feel happy and forget the time when shopping online, they will tend to form a good attitude towards the online marketplace.
The results of the hypothesis test show that the P-value of H6 is 0,000. So that there is a positive effect of attitude on Reuse Intention. As in the research conducted by Yang, it was proven that consumer attitudes positively influenced their buying intention in the context of mobile shopping. Conversely, negative experiences produce the opposite effect [18], [19]. In addition, according to Ajzen and Fishbein an individual who believes that doing certain behaviors will produce most positive results will have a positive feeling towards a behavior which in this study is intention to reuse mobile shopping application.
V. CONCLUSION
A. Conclusion
Perceived of Usefulness has a positive effect on flow. This means that the fun and concentration when shopping online will be even higher if consumers feel the shopping application is useful in shopping. Perceived of Usefulness has a positive effect on Reuse Intention. So that when consumers get higher benefits from online marketplaces in Indonesia, they have the intention to re-use the application to shop. Perceived Ease of Use has a positive effect on Perceived of Usefulness. This shows that when the convenience perceived by consumers in using the shopping application, they will simultaneously feel the benefits of the shopping application. Because when consumers are easy to run shopping applications, they can be faster in finding information related to the product.
Flow has a positive effect on attitude. It can be concluded that the pleasure generated when flow conditions will increase consumer attitudes towards the shopping application they use. Attitude has a positive effect on Reuse Intention. This shows that a good attitude from consumers will lead to the intention to re-use the application to shop. Consumer Reuse Intention is higher if
it passes a positive attitude compared to directly influenced by Perceived of Usefulness.
Based on the information and results of the research conducted, there are several things that can be suggested to companies that provide online marketplaces and to retailers who want to develop shopping applications so that companies can increase the effectiveness of this channel. The suggestions that can be given are
It is very important for companies that want to make a shopping application to focus on the convenience of users in using the application. Companies can provide a simple display with many menu buttons that can make it easier for consumers to return to the previous menu, see product information, or movements that can make it easier for consumers to use the application, for example sliding screen to return to the previous menu without having to click the menu.
In addition, companies can also provide more concise payment services without having to fill in the data and information themselves or confirm payments manually. Associated with variables perceived ease of use where consumers are more concerned with ease of use, so that when consumers more easily use the application, making them shop faster.
B. Limitations and Future Research
Based on Technology Acceptance Model (TAM) previous literature, this research proves that TAM is still a robust and reliable model to predict the behavioral intentions in the field of mobile shopping applications. Perceived usefulness factor plays a major role in the Reuse Intention on mobile shopping apps. The implications of this research can benefit the current organizations to a great extent and the ones to come in the mobile shopping
applications market by giving insights for planning their marketing strategies and advertising campaigns effectively. We believe that this research model is generalizable across different information systems like e- commerce, mobile payments and mobile commerce. But several limitations of this study have to be acknowledged. The main limitation of this study is that it was confined to only one developing country which is Indonesia. Future researchers can test this model across different cultures based on their cultural traits. This model only covers TAM model and flow and an exploratory study may be necessary to cover other factors that have a significant influence Reuse Intention.
Since this study was only focused on online marketplace applications, it may not be appropriate for other mobile shopping applications that offer different business model. Hence, the result of the main factors of reuse intention may differ.
A longitudinal study of the change in price sensitivity levels of the people over time in using mobile shopping applications is another promising area that can be explored in the future. Other population demographics like age, income levels, product types and location may have moderating effects on the relationships in the model related to Reuse Intention. The change in the behavior of the users with respect to the specifications of devices (screen size, internet speed, processor frequency etc.) that they primarily use for shopping is another area to be studied in the future. People may also use other apps to compare prices between retailers and this can be one factor affecting Reuse Intention since Indonesian people are quite price sensitive future studies should try to address these issues in order to expand the knowledge of this issue
Appendix 1. Profile of Respondents
Characteristics N Percentage Gender Male 55 30.40% Female 126 69.60% Age 17 – 22 23 12.70% 23 - 29 139 76.80% 30 - 36 11 6.10% > 36 8 4.40% Domicile Jakarta 96 53.00% Bekasi 15 8.30% Depok 11 6.10% Tangerang 34 18.80% Padang 8 4.40% Bogor 4 2.20% Yogyakarta 3 1.70% Surabaya 2 1.10% Bandung 3 1.70% Others 5 2.80%
Profession Student 52 28.70% Employee 89 49.20% PNS 15 8.30% BUMN employee 7 3.90% Housewife 4 2.20% Self employed 4 2.20% Others 10 5.50% Education Bachelor 140 77.30% Diploma 22 12.20% School 10 5.50% Post graduate 9 5.00%
Frequent Mobile Apps Shopee 93 51.40%
Tokopedia 57 31.50%
Bukalapak 16 8.80%
Lazada 13 7.20%
Blibli 2 1.10%
Frequency of Using Mobile Apps < 1 time/month 43 23.80%
1 - 2 times/month 96 53.00%
3 - 4 times/month 28 15.50%
> 4 times/month 14 7.70%
REFERENCES
[1] Y. M. Chen, T. H. Hsu, and Y. J. Lu, “Impact of flow on mobile shopping intention,” J. Retail. Consum. Serv., vol. 41, pp. 281– 287, 2018.
[2] P. J. Danaher, M. S. Smith, K. Ranasinghe, and T. S. Danaher, “Where, when, and how long: Factors that influence the redemption of mobile phone coupons,” J. Mark. Res., vol. 52, no. 5, pp. 710–725, 2015.
[3] K. F. Fong and C. K. Lee, “Performance analysis of internal-combustion-engine primed trigeneration systems for use in high-rise office buildings in Hong Kong,” Appl. Energy, vol. 160, pp. 793–801, Dec. 2015.
[4] D. Grewal, A. L. Roggeveen, L. D. Compeau, and M. Levy, “Retail value-based pricing strategies: New times, new technologies, new consumers,” J. Retail., vol. 88, no. 1, pp. 1–6, 2012.
[5] S. Agrebi and J. Jallais, “Explain the intention to use smartphones for mobile shopping,” J. Retail. Consum. Serv., vol. 22, pp. 16–23, 2015.
[6] D. L. Hoffman and T. P. Novak, “Flow online: Lessons learned and future prospects,” J. Interact. Mark., vol. 23, no. 1, pp. 23– 34, 2009.
[7] M. Csikszentmihalyi, Beyond Boredom and Anxiety; The Experience of Play in Work and Games. Francisco, CA: Jossey-
Bass San, 1975.
[8] K. Arning and M. Ziefle, “Understanding age differences in PDA acceptance and performance,” Comput. Human Behav., vol. 23, no. 6, pp. 2904–2927, 2007.
[9] V. Venkatesh, “Determinants of perceived ease of use: Integrating control, intrinsic motivation, and emotion into the technology acceptance model,” Inf. Syst. Res., vol. 11, no. 4, pp. 342–365, 2000.
[10] F. D. Davis, “Perceived usefulness, perceived ease of use, and user acceptance of information technology,” MIS Q. Manag. Inf. Syst., vol. 13, no. 3, pp. 319–339, 1989.
[11] H. P. Lu and P. Y. J. Su, “Factors affecting purchase intention on mobile shopping web sites,” Internet Res., vol. 19, no. 4, pp. 442–458, 2009.
[12] M. E. P. Seligman and M. Csikszentmihalyi, “Positive psychology: An introduction,” in Flow and the Foundations of Positive Psychology: The Collected Works of Mihaly Csikszentmihalyi, vol. 9789401790, Dordrecht, Netherlands: Springer Netherlands, 2014, pp. 279–298.
[13] M. Koufaris, “Applying the technology acceptance model and flow theory to online consumer behavior,” Inf. Syst. Res., vol. 13, pp. 205–223, 2002.
[14] L. Gao and X. Bai, “Online consumer behaviour and its relationship to website atmospheric induced flow: Insights into
online travel agencies in China,” J. Retail. Consum. Serv., vol. 21, no. 4, pp. 653–665, 2014.
[15] A. V. Hausman and J. S. Siekpe, “The effect of web interface features on consumer online purchase intentions,” J. Bus. Res., vol. 62, no. 1, pp. 5–13, 2009.
[16] W. L. Shiau and M. M. Luo, “Factors affecting online group buying intention and satisfaction: A social exchange theory perspective,” Comput. Human Behav., vol. 28, no. 6, pp. 2431– 2444, 2012.
[17] M. L. Korzaan, “Going with the flow: Predicting online purchase intentions,” J. Comput. Inf. Syst., vol. 43, no. 4, pp. 25–31, 2003.
[18] A. Bandura, “Self-efficacy: Toward a unifying theory of behavioral change,” Adv. Behav. Res. Ther., vol. 1, no. 4, pp. 139–161, 1978.
[19] P. A. Dabholkar and X. Sheng, “The role of perceived control and gender in consumer reactions to download delays,” J. Bus. Res., vol. 62, no. 7, pp. 756–760, 2009.
[20] P. A. Pavlou and M. Fygenson, “Understanding and predicting electronic commerce adoption: An extension of the theory of planned behavior,” MIS Q. Manag. Inf. Syst., vol. 30, no. 1, pp. 115–143, 2006.
[21] Y. Lee and H. Y. Kim, “Consumer need for mobile app atmospherics and its relationships to shopper responses,” J. Retail. Consum. Serv., vol. 51, pp. 437–442, 2019.
[22] R. H. Ducoffe and E. Curlo, “Advertising value and advertising processing,” J. Mark. Commun., vol. 6, no. 4, pp. 247–262, 2000.
[23] F. Hair, W. C. Black, B. J. Babin, and R. E. Anderson, Multivariate Data Analysis. Upper Saddle River, New Jersey: Pearson Education International, 2010.
[24] R. B. Kline, “Exploratory and Confirmatory Factor Analysis,” in Applied Quantitative Analysis in Education and the Social Sciences, Y. Petscher, C. Schatschneider, and D. L. Compton, Eds. New York: Routledge/Taylor & Francis Group, 2013, pp. 1–376.