Accounting
Methodology
Document
2
1.1 REGULATORY REPORTING REQUIREMENTS ... 4
1.2 INTRODUCTION TO THE AMD ... 4
1.3 STRUCTURE AND PURPOSE OF THE AMD ... 4
2. BUSINESS OVERVIEW ... 7
2.1 BTGROUP AND REGULATORY REPORTING ... 7
2.2 ASSYSTEMS AND THE REPORTING HIERARCHY ... 7
3. OPENREACH REPORTING ... 10
3.1 INTRODUCTION ... 10
3.2 OPENREACH PRODUCT GROUPS ... 10
3.4 FORMAT OF THE OPENREACH INFORMATION STATEMENTS ... 11
3.5 DISAGGREGATING SMP DEFINED INFORMATION INTO OPENREACH REGULATORY STATEMENTS ... 11
3.6 RECONCILIATION OF OPENREACH INCOME STATEMENT... 11
4. ACCOUNTING POLICIES ... 13
4.1 BASIS OF PREPARATION OF THE RFS ... 13
4.2 PRINCIPLES OF VALUATION OF NON-CURRENT ASSETS. ... 14
4.3 PROPERTY,PLANT AND EQUIPMENT AND SOFTWARE INTANGIBLE ASSETS ... 14
5. SYSTEM ... 16
5.1 SYSTEM OVERVIEW ... 16
5.2 SYSTEM PROCESS AND PROCESSING LEVELS ... 17
5.3 CONTROLS ... 20
5.4 TRANSFER CHARGES AS A BASIS FOR COST ATTRIBUTION ... 20
6. VALUATION METHODOLOGIES ... 22
6.1 INTRODUCTION ... 22
6.2 DETAILED VALUATION METHODOLOGY ... 26
7. ATTRIBUTION METHODS ... 33
7.1 INTRODUCTION ... 33
7.2 CONCEPTS OF ATTRIBUTION ... 33
7.3 GROSS ADJUSTED COSTS ... 34
7.4 CONCEPTUAL MODEL ... 35
8. LINE OF BUSINESS ORGANISATIONAL UNIT CODES ... 37
8.1 LINE OF BUSINESS ORGANISATIONAL UNIT CODES ... 37
9. USE OF SYSTEM GENERATED BASES ... 39
9.1 INTRODUCTION TO SYSTEM GENERATED BASES ... 39
9.2 BASES APPORTIONED TO SPECIFIC COST POOLS ON THE BASIS OF PREVIOUSLY APPORTIONED COSTS PAN-DIVISIONALLY .... 39
9.3 BASES APPORTIONED ON THE BASIS OF PAY COSTS ... 40
10. BASE METHODOLOGIES – OUC DRIVEN BASES ... 42
10.1 INTRODUCTION TO OUC DRIVEN BASES ... 42
10.2 BASE METHODOLOGY DICTIONARY –OUC DRIVEN BASES ... 43
11. BASE METHODOLOGIES – OTHER BASES ... 62
12.2 ACTIVITY GROUP DICTIONARY ... 125
13. PLANT GROUPS ... 138
13.1 INTRODUCTION TO PLANT GROUPS ... 138
13.2 PLANT GROUP DICTIONARY ... 139
14. COMPONENTS ... 224
14.1 INTRODUCTION TO COMPONENTS ... 224
14.2 COMPONENT TO SERVICE ATTRIBUTION ... 224
14.3 COMPONENT TO SUPER COMPONENT MAPPING AND USAGE FACTOR CALCULATIONS ... 226
14.4 COMPONENT TO SERVICE MAPPINGS INCLUDING USAGE FACTORS EMPLOYED IN THE ATTRIBUTION PROCESS ... 268
15. TRANSFER CHARGES ... 269
15.1 INTRODUCTION TO TRANSFER CHARGING ... 269
15.2 TRANSFER CHARGES – CHARGES WHICH DO NOT NET TO NIL ... 271
16. EQUIVALENCE OF INPUT SERVICES ... 273
17. DATA SOURCES ... 285
17.1 INTRODUCTION ... 285
17.2 21CN VOLUMES AND CAPITAL ... 285
17.3 HIGH LEVEL SUMMARY OF SYSTEMS ... 287
17.3 DETAILED SUMMARY OF SYSTEMS ... 288
18. GLOSSARY ... 310
ANNEX 1. SECTORS ... 326
A.1.1 SECTORS INTRODUCTION ... 326
A.1.2 OPERATING COST SECTORS ... 326
A.1.3 BALANCE SHEET SECTORS ... 331
A.1.4 SECTOR TO F8 MAPPING TABLE ... 340
ANNEX 2. ELECTRICITY PRICE REPORTING ... 341
A.2.1 DIRECTION ... 341
A.2.2 BT ELECTRICITY CHARGE CALCULATION ... 341
A.2.3 CONTRACT INFORMATION AND BREAKDOWN ... 341
A.2.4 COST ATTRIBUTION PROCESS FOR LLU RELATED ELECTRICITY COSTS ... 342
ANNEX 3. DETAILED VALUATION METHODOLOGY BIBLIOGRAPHY ... 343
ANNEX 4. STUDIES AND DATA SOURCES IN CURRENT COST ACCOUNTING VALUATIONS ... 344
ANNEX 5. INDICES AND TRENDS USED IN CURRENT COST ACCOUNTING ... 345
ANNEX 6. ASSET MOVEMENT STATEMENT PROCESS FOR THE DERIVATION OF NET REPLACEMENT COST INCLUDING UNDERLYING CURRENT COST ACCOUNTING MOVEMENTS ... 347
ANNEX 7. LINKAGE OF DVM ASSET CATEGORIES TO ACTIVITY AND PLANT GROUPS... 351
4
1.
Introduction
1.1
Regulatory reporting requirements
In the UK, the telecommunications industry is regulated by Ofcom (the UK’s independent communications regulator) and through various European Union directives, the Communications Act 2003 (the Communications Act), and other regulations and recommendations.
Regulatory financial reporting obligations are imposed by Ofcom to monitor and enforce other ex-ante obligations. We are required to demonstrate compliance with these obligations in certain markets in which we have Significant Market Power (SMP). This document demonstrates our compliance with the SMP conditions that apply to BT and serves as the basis for the RFS’ Properly Prepared in Accordance With (PPIA) audit opinion.
1.2
Introduction to the AMD
The Regulatory Financial Statements (RFS) are prepared in accordance with this Accounting Methodology Document (AMD) and its separate annex, the Long Run Incremental Cost Relationships and Parameters (LRIC R&P) document.
A Wholesale Catalogue, which describes the wholesale services included in the Wholesale SMP markets and technical areas where BT has a regulatory financial reporting obligation, is separately published. The AMD is a newly created document for 2014/15 and comprises the content of what in 2013/14 would have been the following documents: the Detailed Valuation Methodology (DVM), the Primary Accounting Document (PAD), the Detailed Attribution Methodology (DAM), and the LRIC R&P.
The AMD follows a similar framework and includes all the content from the previous accounting methodology documents that we consider to be necessary to explain our Regulatory Accounting process and methodologies.
1.3
Structure and purpose of the AMD
The AMD is used to:
Describe the legal and accounting frameworks under which the accounting statements are prepared;
Describe the costing principles used by BT to prepare the RFS on a fully allocated cost (FAC) basis;
Describe the methods used in the Accounting Separation (AS) process to attribute revenue, costs and capital employed to the Markets and Technical Areas in the RFS; and
Outline the systems and processes used by BT to support AS.
The AMD is structured into sections explaining the different stages of the AS process. AS is the attribution of costs, revenues and capital employed to the defined Markets and Technical Areas of BT.
Section 1Introduction. This section provides an introduction and guide to the AMD and its content.
Section 2 Business overview. This section provides an overview of the BT business, an
introduction to AS, and describes how the underlying financial transactions supporting the business activities and functions recorded in the financial ledgers are grouped to provide the starting costs, revenues, assets and liabilities used by the AS system. This provides the starting
categories (sectors). The term cost pool is used as a generic term referring potentially to a pool of cost, revenues, assets or liabilities. The AS system attributes the costs, revenues, assets and liabilities to defined Products and Components that form the Services which aggregate into the Markets and Technical Areas to create a view of BT’s financial position and results against SMP Markets.
Section 3 Openreach reporting. This section provides an overview of our Openreach obligations
which are required by the Undertakings.
Section 4 Accounting policies. This section provides an introduction to the basis of the
presentation of the RFS and highlights any differences between current cost (as used in the RFS) and historic cost policy (as set out in BT’s Annual Report). It describes the specific accounting policies employed in the valuation of our non-current assets when preparing the RFS.
Section 5 System. This section provides an overview of the AS solution, and the REFINE system
we use to implement it, in terms of the underlying costing principles and the conceptual flow of costs and revenues from source financial systems to the separated Markets and Technical Areas to create a view of BT. It sets out the main types of cost pool used by the solution, in terms of F8 items, activity groups, plant groups, components and products, and explains the flow of costs and revenues across the different types of cost pool.
Section 6 Valuation methodologies. This section describes in detail the specific valuation methodologies used to value our non-current assets when preparing the RFS.
Section 7 Attribution methods. This section introduces the concept of cost attribution and how
the process flows from high level ledger costs through to Products (which are not presented in the markets in which we have SMP and AS requirements) and Services.
Section 8 Line of Business Organisational Unit Codes. This section provides an overview of the
Lines of Business (LoBs) that exist within BT Group, the Organisational Unit Codes (OUCs) which we use to represent these LoBs and the general basis of attribution which applies to each LoB.
Section 9 Use of system generated bases. This section introduces the concept, and provides a
dictionary, of system generated basis and the principles of attribution which we use to attribute costs using such bases.
Section 10 Base methodologies – OUC driven bases. This section introduces the concept of OUC driven bases (for example Except bases) and how and why these are used in the attribution process. It includes a methodology dictionary which gives a complete description of the material attribution methodologies used at this stage in the attribution process (bases to Activity Groups, Plant Groups or Products). This attribution stage is undertaken in conjunction with Other Bases, below.
Section 11 Base methodologies – Other bases. This section introduces the concept of Other
Bases and how and why these are used in the attribution process. It includes a methodology dictionary which gives a complete description of the material attribution methodologies used at this stage in the attribution process (bases to Activity Groups, Plant Groups or Products). This attribution stage is undertaken in conjunction with Except Bases, above.
Section 12 Activity Groups. This section introduces the concept of Activity Groups and how and
why these are used in the attribution process. It provides an overview of all material activity groups, and includes a high level summary of the methodology that is applied to attribute the costs to the next cost pool (Activity Groups to Plant Groups or Products). The Activity Group Dictionary provides a complete description of the attribution methodologies applicable to the Activity Groups based on the current year profit and loss accounts and closing balance sheet.
6 are used in the attribution process. It provides an overview of all material Plant Groups, and includes high level summary of the base methodology used for each Plant Group to attribute the costs to the next cost pool (Plant Groups to Components, Products).
Section 14 Components. This section introduces the concept of Components and their usage
factors and how these are used in the attribution process. It provides an overview of all material components and the usage factors, and the basis for these usage factors, applied to components in order to attribute the costs on to services and part services.
Section 15 Transfer charges. This section expands upon the concepts of transfer charging and
how internal trades are treated within the cost attribution process. It provides a list, with descriptions, of transfer charges which do not exactly contra-eliminate each other within the attribution process, and final destination of these attributed costs.
Section 16 Equivalence of input charges. This section introduces the concept of Equivalence of
Input (EoI) charging and the services which we use for this process. It provides a dictionary of certain Openreach charges which impact the Wholesale Broadband Access (WBA) markets.
Section 17 Data source. This section provides a dictionary of data sources.
Section 18 Glossary. A glossary of commonly used terms.
Annex 1 Sectors. A complete list and description of key REFINE sectors involved in the cost allocation process.
Annex 2 Electricity price reporting. A description and explanation of our methodology for
setting the electricity charges that are used in the cost attribution process.
Annex 3 Detailed valuation methodology bibliography. A bibliography of documents used as
part of preparing our non-current asset valuation methodologies.
Annex 4 Studies and data sources in current cost accounting valuations. A list of studies and
data sources used as part of our Current Cost Accounting (CCA) valuations.
Annex 5Indices and trends used in current cost accounting. A list of indices and trends used in
CCA.
Annex 6 Asset movement statement process for the derivation of net replacement cost
including underlying current cost accounting movements. A description of the Asset
Movement Statement (AMS) process used to derive Net Replacement Cost (NRC) including underlying CCA movements.
Annex 7Linkage of DVM asset categories to Activity and Plant Groups. A mapping of DVM
asset categories to Plant Groups and Sectors.
Annex 8 Key destinations. The key destinations table identifies the key destinations of all the
bases described in the RFS. This is based on the current year Profit and Loss account and closing Balance Sheet.
2.
Business overview
This section provides: A brief overview of our business and our regulatory financial reporting obligations.
A description of how the underlying financial transactions supporting the business activities recorded in BT Group’s financial ledgers are grouped into cost pools (‘F8 groups’) to provide the input costs, revenues, assets and the liabilities used by the AS system.
2.1
BT Group and regulatory reporting
We are subject to regulatory financial reporting obligations for Markets and Technical Areas where we are deemed to have SMP.
We prepare the RFS which show our costs, revenues, assets and liabilities against regulatory Markets and Services as defined by Ofcom in their market reviews. The statements are prepared via the AS process and comprise a financial performance summary, review of financial performance by groupings of markets and by individual markets, other information including the network activity statement and the calculation of FAC based on component costs and usage factors statement and reconciliation statements. For regulatory reporting purposes, revenue is derived from and recorded against a range of services which BT provides. Costs associated with operational and support activities undertaken to support the provision of these services are recorded against sectors such as planning and development, provision and installation, maintenance and plant support. A list and description of all of our reporting sectors is available in Annex 1.
2.2
AS Systems and the reporting hierarchy
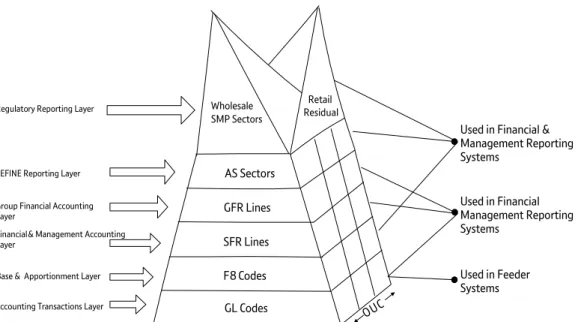
Our financial and reporting system, REFINE, uses a hierarchical pyramid coding structure to support the data capture and information summation at the LoB and activities level. This is explained below.
GL Codes F 8 Codes SFR Lines AS Sectors Wholesale SMP Sectors Retail Residual GFR Lines
Accounting Transactions Layer Base &Apportionment Layer Financial & Management Accounting Layer
Group Financial Accounting Layer
Regulatory Reporting Layer
REFINE Reporting Layer
Used in Feeder Systems Used in Financial Management Reporting Systems
Used in Financial & Management Reporting Systems
Diagram: BT’s SMP Reporting and Coding Structure
8 The diagram above shows the grouping of financial accounting information from general ledger cost accounts to F8 codes and sectors. The different levels of the hierarchy are discussed below.
Accounting Transaction (GL Codes) Layer
The costs, revenues, assets and liabilities of our main business activities (within the operating businesses of BT Consumer, BT Business, BT Wholesale, BT TSO, BT Global Services, Openreach and other parts of the BT Group organisation) are recorded in the group General Ledger (GL) system.
Base Apportionment (F8 codes) Layer
General ledger codes are grouped into ‘F8 codes’, which represent groups of similar general ledger codes. One or many GL Codes are aggregated to an F8 code. The costs, revenues, assets and liabilities associated with an individual F8 code (for a given Organisational Unit Code - see OUC description below) will be attributed to Products, Plant Groups (PGs) and/ or Activity Groups (AGs) using a base methodology appropriate to the OUC that records.
The Regulatory Reporting system REFINE receives general ledger feeds summarised at the F8 code level and attributes costs, revenues, assets and liabilities to the regulatory Markets and Services.
Financial and Management Accounting (SFR Lines and Reports) Layer
General ledger codes are aggregated to Standard Financial Report (SFR) Lines. One or many GL Codes are aggregated to a SFR line which form the basis of BT’s Financial and Management Reports used internally. The SFRs form the basis of both Financial and Management reports. There are approximately 100 SF Reports and approximately 8,200 SFR Lines. These are not used for the production of the RFS.
Group Accounting (GFR Lines and Reports) Layer
SF Lines aggregate to Group Financial Reporting (GFR) Lines. One or many SFR Lines are aggregated to a GFR line. GFR lines form the basis of BT’s Group Financial Reports, from which, BT’s external Financial Reports are produced.
Self-accounting Units (SAUs) not using the BT Group General Ledger (GL) system provide summarised details of their financial accounts on a Group Financial Return (GFRet), with line items from the GFRet mapped to GL codes for use in the AS system.
Regulatory Reporting (AS Sectors and SMP Sectors) Layer
One or many F8 codes are grouped into similar functional categories called AS sectors to make regulatory reporting more manageable. Although sectors contain functionally similar categories of cost, an individual sector is likely to use multiple attribution base methodologies. AS sectors are grouped into two broad categories, Income Statement and Balance Sheet.
All AS sectors point to SMP sectors. One or many AS sectors can map to a SMP sector. The AS sectors are grouped in to SMP reporting sectors to produce the Wholesale SMP Reports.
Organisational Unit Codes (OUCs) and Sectors
OUCs provide a horizontal, organisational cut of the financial data in the vertical ‘GL-F8-sector’ pyramid. Costs/ revenues/assets/liabilities are recorded by OUC, at the class of work (CoW) /general ledger account level. CoWs specify a type of activity or asset type on which engineers are engaged at an F8 code level. The codes for OUCs follow a hierarchical structure, with the first level of the OUC code defining the highest level of the organisation unit and the subsequent letters of the OUC code representing the more detailed sub-divisions within the top-level organisation unit. For example, OUC code K, represents BT Wholesale, and code KB represents a subsidiary organisational unit within BT Wholesale.
A sector is represented by a series of F8 codes, with OUCs showing the financial values of their revenue, costs, assets and liabilities against the different F8 codes. Each sector can be represented by a matrix of
base attribution methodology to attribute the costs, revenues, assets and liabilities.
F8-OUC combinations are the lowest level at which discrete costs pools are defined for the purpose of the AS System.
2.2.1 Attribution of financial information to Markets and Services
The AMD explains how the costs, revenues, assets and liabilities of the BT Group business are attributed to the products of the defined regulatory Markets and Services.
The AMD sets out for each sector the component F8/OUC codes and the attribution methodologies that are applied to each F8/OUC code to flow them through to products (and/or intermediate cost pools). Several F8-OUC combinations may share the same base, if they have similar cost behaviour.
Our attribution methodologies are described in detail in the Methodology Dictionaries in Sections 9 to 14.
2.2.2 Scope of document
The dictionary sections within the AMD have been written specifically to describe substantially all of the attribution of the total ledger value, ensuring that for any market we describe the methodologies of at least 90% of the attributions in absolute terms.
The document follows this principle of identifying only those material items, rather than the total population of items that is relevant to a methodology. Key destination tables specify the destinations of at least 90% of the costs being attributed by a methodology in Annex 8.
10
3.
Openreach reporting
3.1
Introduction
On 22 September 2005, we entered into legally binding undertakings with Ofcom in lieu of a reference under the Enterprise Act 2002 (“the Undertakings”). In accordance with section 5.311 of the Undertakings, the RFS separately present the financial results of Openreach2 and include a reconciliation of Openreach’s revenue, operating profit (and other items agreed between us and Ofcom) with the financial information about Openreach as shown in BT Group plc’s Annual Report. This financial information is subject to an independent audit.
This section outlines the methodologies used to present the financial results of Openreach (‘Openreach Information’) within the RFS and the reconciliation of that statement to the Openreach segmental financial information as shown in BT’s Annual Report.
As required in the Undertakings, the form, content and basis of preparation of the Openreach Information follows that used in the preparation of the RFS.
3.2
Openreach product groups
In accordance with section 5.31 of the Undertakings we have broken down the Openreach Information into the broad product groups that Openreach provides. The product groups that we use are the same as the relevant markets we have used in the main RFS except for “Other Openreach Markets & Activities (with no SMP reporting obligation)”.
The following is a list of our product groups. The mapping of services into these product groups can be found in the Wholesale Catalogue, with the exception of “Other Openreach Markets & Activities (with no SMP reporting obligation)”:
Wholesale analogue exchange line services
Wholesale ISDN2 exchange line services
Wholesale ISDN30 exchange line services
Wholesale local access
Low bandwidth AISBO Non-WECLA
Low bandwidth AISBO WECLA
MISBO Non-WECLA
Other Openreach Markets & Activities (with no SMP reporting obligation). These activities include MISBO
WECLA and some services only sold internally such as element-Partial Private Circuits (ePPCs).
All of these services, with the exception of ePPCs, are described on Openreach’s website: www.openreach.co.uk. ePPCs are an internally supplied service that provides the access network and backhaul network elements necessary for the rest of BT to provide Partial Private Circuits (PPCs). ePPC costs, assets and liabilities are included, (together with additional rest of BT costs, assets and liabilities) in the RFS in the following reported markets:
Traditional interface symmetric broadband origination (up to and including 8Mbit/s).
Traditional interface symmetric broadband origination (above 8Mbit/s up to and including 45Mbit/s) not including the WECLA.
1 Refer to Ofcom statement: “Final statements on the Strategic Review of Telecommunications, and undertakings in lieu of a reference under
the Enterprise Act 2002” – Annex A, Part 2: Statement on undertakings in lieu of a reference under Part 4 of the Enterprise Act 2002 2 Referred to in the Undertakings as “AS”, meaning Access Services division.
including the WECLA.
3.4
Format of the Openreach information statements
The format of the Openreach regulatory Income and Mean Capital Employed statements are consistent with the sector analysis in the RFS.
3.5
Disaggregating SMP defined information into Openreach regulatory statements
The basis of disaggregating the SMP defined revenue, associated costs and capital employed into information used to prepare the Openreach regulatory statements is described below.
3.5.1 Openreach revenue
Revenue is based upon published prices multiplied by Openreach volumes, consistent with our RFS. We have used volumes associated with Openreach products. Against the identified volumes we apply the published price, where products are sold externally or internally, to arrive at the reported revenue for Openreach.
For services which are only sold internally and where there is no applicable published price, revenue is calculated on the prices that have been agreed internally between Openreach and the other BT divisions eg for the supply of ePPCs.
3.5.2 Northern Ireland
Volumes, revenues, costs and capital employed relating to Northern Ireland are included in the Openreach element of the service at this stage, and are shown in the production of the reconciliation statements (see below).
3.6
Reconciliation of Openreach income statement
The reconciling differences between the Openreach Information and the Openreach segmental financial information reported in BT’s Annual Report fall into the following main categories:
i. Basis of preparation under Current Cost Accounting (CCA): BT’s Annual Report has been prepared under the historical cost accounting (HCA) basis, modified for the revaluation of certain financial assets and liabilities at fair value. BT’s RFS have been prepared on a CCA basis.
ii. Results relating to Northern Ireland operations: The RFS have been prepared in accordance with the Final Statements and Notifications imposed on us where Ofcom has defined certain markets in which we are deemed to have Significant Market Power (SMP) in the UK. This definition includes our Northern Ireland operations. The Openreach segmental financial information reported in BT’s Annual Report has been prepared based on the definition from the Undertakings. This excludes our operations in Northern Ireland. Accordingly, the results of the access network element of BT’s Northern Ireland operations form part of the reconciliation. The revenues relating to Northern Ireland have been identified from the product revenues ledgered separately for the Northern Ireland line of business, and the underlying volumes derived by dividing these ledgered revenues by their published prices. The associated costs relating only to the access element of BT’s Northern Ireland operations have been identified as the total costs from the BT organisational unit code (OUC) “HM” within the Openreach results within BT’s regulatory accounting system.
iii. Cost of capital adjustment for internal trading: Within the Openreach segmental financial information reported in BT’s Annual Report, there is a charge for an appropriate return on capital where assets are owned by the BT TSO division (eg for line cards, electronics and network features) but are used by Openreach. The Openreach regulatory statements do not include this charge, as the basis for allocation of costs and assets to products in the regulatory accounts is actual costs and assets.
iv. Other reconciling items and trading differences: This adjustment relates to other trading differences that may occur from period to period in attributing costs for the RFS. Internal transfers raised between businesses are ignored within the RFS for both the OUC raising the charge and the OUC receiving the charge so as to reflect the true regulatory end-to-end costs of each unit. The total regulatory cost of each
12 individual reconciliation differences and the sum of the differences incorporated as the total reconciliation difference for trading differences.
v. Non-traded costs: Costs shown separately from the Openreach segmented results in BT’s Annual Report are included as a separate line to enable reconciliation between the accounts.
We do not publish Openreach segmental balance sheet information in our Annual Report and consequently are unable to publish the Reconciliation of Openreach MCE Statement in the RFS.
4.
Accounting policies
This section explains the basis of the presentation of the RFS and highlights any differences between current cost and historic cost policy as set out in BT’s Annual Report.
4.1
Basis of preparation of the RFS
The RFS are prepared under the financial capital maintenance convention in accordance with the principles set out in the handbook “Accounting for the effects of changing prices”, published in 1986 by the Accounting Standards Committee, except where directed by Ofcom to apply alternative valuation methodologies. Under this convention, current cost profit is normally arrived at by adjusting the historic cost profit to take account of changes in asset values and of the erosion in the purchasing power of shareholders’ equity during the year due to general inflation. Asset values are adjusted to their value to the business, usually equivalent to their net current replacement cost. Changes in asset values are referred to as unrealised holding gains or losses and are not split between price variance and other as we do for the RFS.
The Accounting Methodology Documents are made up of the following (listed in order of priority):
i. The Regulatory Accounting Principles (published separately to this document by Ofcom in Annex 1 of their Directions for Regulatory Financial Reporting (30 March 2015))
ii. The Attribution Methods (covered in Sections 8 to 14 of this document) iii. The Transfer Charge System Methodology (Section 15 of this document) iv. The Accounting Policies (this section)
v. The Long Run Incremental Costs Methodology (published as a separate annex to this document) The RFS are required to give primacy to Regulatory Decisions, which are explained in the Attribution Methods. The RFS are reconciled to BT’s Annual Report, which consolidates, on a historic cost basis, the financial statements of the company and all of its subsidiary undertakings. Where the financial statements of subsidiary undertakings, associates and joint ventures do not conform to the Group’s accounting policies, appropriate adjustments are made on consolidation in order to present the financial statements on a consistent basis. The principal subsidiary undertakings’ financial years are all in alignment to those of the company.
The preparation of financial statements in conformity with IFRS requires the use of accounting estimates. It also requires management to exercise its judgement in the process of applying the Group’s accounting policies. We continually evaluate our estimates, assumptions and judgements based on available information and experience. As the use of estimates is inherent in financial reporting, actual results could differ from these estimates. The areas involving a higher degree of judgement or complexity include accounting for long term customer contracts, pension obligations, useful lives for property, plant and equipment and software, provisions and contingent liabilities, current and deferred income tax, goodwill and provision for doubtful debts.
The Group’s accounting policies are detailed on pages 150 to 154 of BT’s Annual Report for the year ended 31 March 2015 which is available from our website: www.BTplc.com, or from our registered office:
BT Group plc BT Centre
81 Newgate Street London EC1A 7AJ United Kingdom Tel: 020 7356 5000 From outside the UK Tel: +44 1793 596 931
14 Assets are stated in the balance sheet at their value to the business, usually equivalent to their Net Current Replacement Cost (NRC). This is generally derived from the asset’s Gross Replacement Cost (GRC) and is the current purchase price of an identical new asset or the cost of a modern equivalent asset (MEA) with the same service potential.
We employed different valuation methods in the RFS for different technology types. These are ‘existing technology’, ‘modern equivalent asset’ and ‘low value/short life’ valuations. The valuation types along with the different ways in which we employ them are explained in Section 6 Valuation methodologies.
4.3
Property, Plant and Equipment and Software Intangible Assets
Property, plant and equipment are stated at current cost less depreciation (also at current cost).
In BT’s Annual Report, property, plant and equipment and software intangible assets are included at historical cost, net of accumulated depreciation, government grants and any impairment charges. On disposal, any difference between the sale proceeds and the net book value at the date of disposal is recognised in other operating income in the income statement.
Included within the cost for network infrastructure, equipment and internally developed software are direct and indirect labour costs, materials and directly attributable overheads. Depreciation is provided on property, plant and equipment on a straight line basis from the time the asset is available for use, to write off the asset’s cost over the estimated useful life taking into account any expected residual value. Freehold land is not depreciated.
4.3.1 Current Cost of Property, Plant and Equipment and Software Intangible Assets
The current replacement cost of categories of assets where major programmes of modernisation are under way is based on the concept of the modern equivalent asset, ie the cost of replacing existing equipment with modern assets of similar service potential. The gross current replacement cost of the major categories of property, plant and equipment and software intangible assets has been assessed on the following basis:
(a) Land and buildings
Property assets (general purpose buildings, specialised buildings, general purpose land and specialised land), are valued at historic cost. Specialised accommodation assets are valued using the indexed historic methodology.
(b) Access – Copper
Copper cable and dropwires are valued using the indexed historic methodology and the Office of National Statistics (ONS) published Retail Price Index (RPI).
(c) Access – Fibre
Access fibre cables are valued using the absolute valuation methodology.
(d) Duct
Duct is either valued using the indexed historic methodology and the ONS published RPI or, for duct used by access cables, a prescribed RAV methodology which Ofcom have directed us to use.
(e) Switch
System X local exchanges are valued using an extrapolation of the absolute valuation as at 31 March 2009. AXE10 local exchanges, UXD5 remote concentrators and main distribution frames are valued at historic cost.
(f) Transmission
Synchronous Digital Hierarchy (SDH) transmission equipment is valued using the indexed historic methodology. Backhaul and core fibre cables and equipment deployed as part of 21st Century network are valued using the absolute valuation. All other Transmission assets are valued at historic cost.
Telecom power equipment is valued using the indexed historic methodology. All other assets, including computers, vehicles, internally developed and externally purchased software and other intangible assets are valued at historic cost.
4.3.2 Depreciation
HCA depreciation is provided on property, plant and equipment on a straight line basis from the time the asset is available for use, to write off the asset’s cost over the estimated useful life taking into account any expected residual value. Freehold land is not depreciated.
The asset lives assigned to principal categories of assets are shown in our accounting policies, described in our statutory accounts Annual Report.
We note that there is one difference between the asset lives used in our RFS and the asset lives as described in BT’s Annual Report. Ofcom have directed that the life of Testing Access Matrix (TAM) assets used for Local Loop Unbundling (LLU) should be 7 years/84 months. In the statutory accounts these assets have a 5 year/60 month life.
16
5.
System
5.1
System Overview
We use a system called REFINE to perform the fully allocated cost attribution for the Regulatory Financial Statements. REFINE takes financial information from our general ledgers and using a series of predetermined rules and bases it attributes the costs, assets and revenues to regulated and non-regulated markets via a series or cost pools.
The diagram below illustrates the types of transaction data entering the REFINE system and processed to form the regulatory financial statements:
Financial Information from our Core General Ledger
We upload financial information relating to costs, revenues, assets and liabilities for the business units that use the general ledger in our central accounting system. This information is uploaded in the form of general ledger codes and organisational unit codes.
Non-core GL feed
We upload financial information relating to cost, revenues, asset and liabilities for the self-accounting business units from the Group Consolidation System. These business units are typically BT-owned subsidiaries and they are included in REFINE in order to reconcile the financial information to that published in our statutory accounts but are allocated to the Retail Residual market.
We also upload central journals that relate to accounting adjustments that have been reflected in the statutory accounts but not processed within the Core Journal
We also upload information relating to our Current Cost Accounting revaluations includes asset values and indices. This information is uploaded from a REFINE CCA module with the underlying data being sourced from our fixed asset register and variety of our sources including indices published on the HMSO website.
We also enter some other journals into REFINE in order to take account of specific regulatory adjustments such as the accounting for Excess Construction Charges and for implementing RAV for duct.
Volumes and Prices for our Network Business
We upload service volumes and prices for our Network Business. In the case of Openreach markets the volumes are sourced directly from Openreach but they are pre-processed in order to input them at the required level of
from BT Wholesale and the internal volumes are derived from the volume of the downstream retail products using a number of different sources.
The prices for all reported services are sourced directly or indirectly from the Openreach and BT Wholesale price lists but in some cases these are aggregations of more than one price.
General Ledger Hierarchy
General Ledger (GL) accounts are the lowest level at which financial information is brought into REFINE. A General Ledger Hierarchy file is also fed into REFINE, which sets out a mapping of GL accounts to F8 codes and assigns a series of markers to provide additional information about the F8 code eg sectors, transaction types etc. This is enables the enable the system to track and report results against a number of views.
F8 code / OUC Hierarchy
This file designates an attribution rule to each F8 code and OUC combination.
Attribution Rules
Some of the attribution rules are processed or calculated by REFINE but other rules need uploaded into the system. These rules are uploaded in the format of % allocations eg Specialised Accommodation costs are apportioned according the floor space occupied and the rule table that is uploaded shows the percentage of floor space occupied by each plant group.
5.2
System process and processing levels
The REFINE system defines different categories of costs, which are treated in a similar manner in the system. At each level of the system processing, a particular category of costs will be attributed to other cost pools resulting in a sequential flow of costs across different categories at each stage of the system. The process of cost pools emptying as the costs are attributed forwards is referred to as ‘exhaustion’.
The diagram below illustrates the main processing stages of the REFINE system for the RFS.
18 to the final level of products (note that costs are allocated to products but the main focus for regulatory reporting is at the Component and Service level as these are what we publish in the RFS for SMP markets). The order of attribution is important because some attributions are made on the basis of previously attributed costs. For example, some costs are attributed on the basis of pay costs.
5.2.1 Processing Level 101
The source cost pools at level 101 attributes the F8/OUC combinations of cost, revenues, assets and liabilities including current cost adjustments.
F8/OUC combinations are attributed to products, activity groups and plant groups using set of rules determined in the F8 code / OUC Hierarchy. These rules are organised into a number of “Rule Types” which are sequenced in a specific order, this order is important since many costs are attributed on the basis of costs already attributed in a previous step.
Rule Types and Sequencing
Order Rule or Table Allocation Basis
1 Rule Type 1 Direct allocation of costs to Plant Groups, Activity Groups and Retail Residual
2 Rule Type 3 % attribution – based on cost allocation models 3 Exceptions % attribution of costs for certain OUCs
4 Rule Type 4 System Generated – Based on costs, including pay (LoB) (incl. Exceptions)
5 Rule Type 6 System Generated – Based on costs, including pay (LoB) (excl. Exceptions)
6 Transfer Charges (RT28) Reallocation of costs between Core OUCs
7 Rule Type 12 System Generated – Based on costs or revenues (Group) Rule Type 1 Allocations
Allocate specific F8/OUC combinations to a specific cost pool eg Openreach (OUC: B) engineering pay costs for the activity of repairing PABXs (Class of Work AMBSB, F8 code: 102911) are allocated to PG981R (Time Related Charges) but pay costs for B T TSO engineers on the same activity are attributed to Retail Residual.
Rule Type 3 Apportionments
Apportions F8/OUC combinations to more than one cost pool using a specific attribution rule eg The depreciation on BT TSO’s AXE10 switch assets F8 code: 455164 / OUC: T) are apportioned to several plant groups using the rule PDTLYX (see Section 11 for more information on PDTLYX).
Exceptions
These attributions are applied to specific OUCs eg the costs in the business unit BT Wholesale Product Management (OUC: KD) are apportioned to plant group based on an activity survey.
Rule Type 4
Rule Type 4 is an attribution rule that is a system generated attribution that apportions costs in proportion to costs that have already been attributed using Rule Type 1, Rule Type 3 and Exception rules. An example of a rule type 4 attribution is FTQ which apportions costs in proportion to previously attributed pay costs. Rule Type 4 attributions only apportion costs in proportion to costs within the same LoB or if the particular OUC is designated as a ‘stand-alone business unit’ then the costs are only attributed in proportion to that business unit.
Example 1: The pay costs of the Openreach Finance team (OUC: BF) are apportioned using Rule Type 4 FTQ. OUC BF is not a stand-alone business unit so the system apportions these costs to activity groups and plant groups in proportion to previously allocated pay in the Openreach LoB. The previously allocated pay would include: all the
Openreach Service Management Centres (OUC BW) attributed using an Exception rule.
Example 2: The costs of Openreach Network Investment (OUC: BL) ‘work manger controls’ are also apportioned using Rule Type 4 FTQ. Network investment has been designated as stand-alone business unit so the system attributes the ‘work manager controls’ costs in proportion to previously allocated pay costs of the engineers in Network Investment team only it would ignore the previously allocated pay costs in other engineering units like Openreach Business and Corporate Delivery (OUC: BD) .
Rule Type 6
Rule Type 6 works in the same way as Rule Type 4 except that it does not include costs that have been previously attributed using Exception rules.
Transfer charges (Rule Type 28)
Transfer charges relate to the attribution of costs between different business units. Each transaction has receipt for one LoB and a payment for another LoB. Rule Type 28 is a system generated base that attributes the transfer charges receipts in proportion to how the transfer charge payments have been apportioned, in this way the two net each other off. Transfer chare are explained more fully in Section 15 Transfer charges.
Rule Type 12
Rule Type 12 is another system generated attribution and it works in the same way as Rule Type 4 and Rule Type 6 except that is attributes costs and assets in proportion to previously attributed costs for the whole of BT Group rather than just the LoB or business unit that incurred the cost. Examples of the type of items processed under rule type 12 include trade creditors, billed debtors and prepayments.
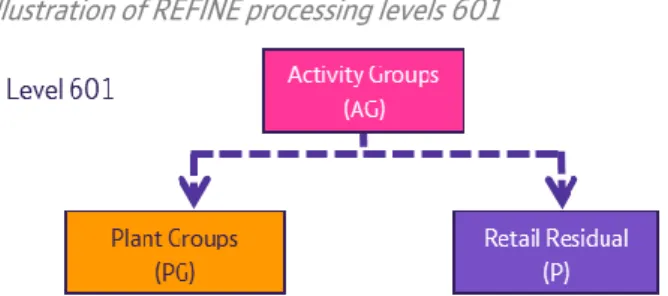
5.2.2 Processing Level 701
The source cost pools at level 701 attribute the combinations of costs and assets which relate to activities such as training, development, facilities management and general corporate costs.
We have summarised this level to show how Activity Groups attribute to Plant Groups. In practice there are sub-stages to this attribution where Activity Groups are attributed in a specific order to accommodate the fact that some of their attributions are to other Activity Groups.
The order of this attribution is as follows (note that more information on Activity Groups is available in Section 12 Activity Groups):
1. AG101 to AG106 and AG401 – AG415; then 2. AG112 and AG113; then
3. AG135, AG148, AG149 and AG161 to AG164.
Activity Groups are attributed to plant groups and retail residual using either defined system rules or methodologies which are appropriate to the types of costs they attribute. Ultimately Activity Groups are attributed to either Retail residual products or Plant Groups; however some of the attributions at this processing level are first from one Activity Group to another.
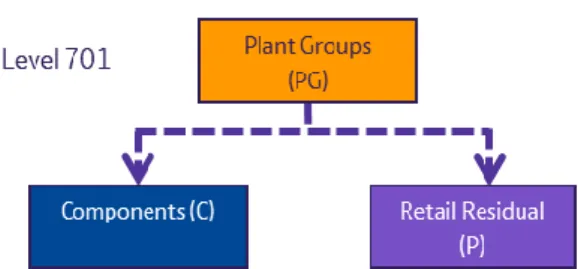
5.2.3 Processing Level 801
The source cost pools at level 701 attribute the combinations of costs and assets which relate to plant (network) overheads, such as accommodation costs for network buildings and costs of providing power to exchanges and transmission assets.
Plant Groups are attributed to components and retail residual using methodologies which are appropriate to the types of costs they attribute. Plant Groups can be attributed to Components on a one-to-one, one-to-many basis, or many-to-many bases. Consequently a Plant Group may contribute costs to many different Components and a Component may receive costs from many Plant Groups.
20 The source cost pools at level 801 attribute the combinations of all costs and assets which make use of BT’s Network (ie those which are not already attributed to Retail residual markets).
Components are attributed to services. Services represent a bundle of Component elements. These services get charged to those who use the network. Network users can be internal (BT Retail) or external (Other Communication Providers). The allocation of Components to Services uses volumes and usage factor data. Details of how this works can be found in Section 14 Components.
5.3
Controls
There are a number of controls in the AS system to ensure the accuracy and completeness of the results. The key controls include:
AS data vetting
All data entry to the REFINE system, except the direct interfaces from the GL, takes place through the DRM (Oracle Data Relationship Manager) scripting process or separate modules in REFINE (eg for CCA). The Operations finance team manages version control data integrity. Data is entered or loaded into REFINE via a bespoke DRM interface and can be managed and reworked in a variety of ways. Once a DRM table has been updated, it cannot then be edited unless a superseding script is loaded to overwrite by an authorised user to help ensure data integrity. Once data has submitted to a REFINE run it cannot be altered until a new run is initiated.
Specification of data sets for runs
Each run of the system is given a unique reference, which dictates the combination of data sets and reference data to be used in the run. These are determined from electronic control sheets to effectively ‘commission’ the run.
Completeness of processing
REFINE produces a series of ‘probity reports’ to show the completeness of processing at each level of the system.
5.4
Transfer charges as a basis for cost attribution
A number of the individual methodology/base descriptions set out in Section 11 Other bases refer to the use of an ‘internal transfer charge destination’ as the basis for attribution of the actual cost underlying the transfer charge, within the AS process. This section explains the rationale for using this basis.
The purpose of transfer charging is to:
Enable customer-facing divisions, which are responsible for their own profitability, to receive a correct allocation of income and expenditure.
Enable support functions to charge for their services to other group units.
Enable control to be exercised over use of key resources.
Maintain proper control in accounting units of certain balance sheet items.
There is a well-established process for the recording of transfer charges between organisational units, and for the monitoring and control by each unit to ensure that the amount of the charge is properly stated in accordance with the transfer charge agreement, and that the amounts are recorded in the correct organisational unit.
Within the AS process, the transfer charge amounts recorded by each unit are replaced with the actual cost underlying the charge, and for which the charge is made. The actual cost is then attributed consistent with the treatment of the transfer charge. This occurs principally in respect of the following types of cost and is attributed on a cost-causal basis:
Motor transport – charged on the basis of the number and types of vehicles used by each OUC.
Computing – charged on a monthly fixed charged, taking account of variations in volumes eg a reduction in volumes will result in lower charges.
the variations in underlying cost (eg a central London office space being charged at a higher rate than an office space in a rural location).
22
6.
Valuation methodologies
6.1
Introduction
In this section we describe the specific valuation methodologies used to value our Non-current Assets in the preparation of the RFS.
BT’s fixed asset register categorises our assets into a range of sub-accounts known as classes of work (CoW). These CoW describe the type of asset in detail and are an appropriate level of granularity for us to make our valuation decisions. In the presentation of the RFS we group them into a smaller number of asset categories. Details of the CoW included under each asset category are provided in Annex 7.
Our fixed asset register also provides some additional detail which allows us to go down to an additional level of detail (known as policy codes) and our financial systems allow us to disaggregate capital expenditure into pay, materials and contracted work. This additional detail is used in the valuation methods where appropriate.
Basis of Preparation of the Regulatory Financial Statements
The RFS are prepared under the financial capital maintenance (FCM) convention using the principles set out in the Report to H. M. Treasury (1986) “Accounting for Economic Costs and Changing Prices” and the handbook “Accounting for the effects of changing prices”, published in 1986 by the Accounting Standards Committee, except where we are directed by Ofcom to apply a different valuation methodology.
Under the FCM convention we include changes in asset values in our income statement as unrealised holding gains or losses. Normally a general inflation adjustment for the erosion in the purchasing power of shareholders’ equity would also be applied, but this adjustment is not included in regulatory reporting.
Principles of Valuation of Non-current Assets
Assets are stated in the balance sheet at their value to the business, usually equivalent to their Net Replacement Cost (NRC). This is generally derived from the asset’s Gross Replacement Cost (GRC) which is the current purchase price of an identical new asset or the cost of a modern equivalent asset (MEA) with the same service potential, except where we are directed by Ofcom to apply a different valuation methodology.
In line with the FCM concept, the effect of the asset revaluation on the income statement is to increase the historical cost profit by any unrealised holding gains (UHG) arising in the year and to decrease it by unrealised losses. Over the life of the asset, CCA and HCA charge the same to the P&L (including supplementary depreciation as a result of CCA changes). Asset life is also the same. We allocate Current Cost Accounting (CCA) adjustments to the income statement and balance sheet to Markets using the same principles and processes as we use for allocating the historic costs for the same assets.
The methods employed for valuing our assets are shown in the table below:
Valuation assumption Valuation method Example (CoW)
Existing technology Absolute valuation Indexation
Extrapolated Absolute
Regulatory Asset Valuation (RAV)
Optical fibre spine cable (LFSC) Copper Dropwires (NWB & NWR) System X exchange switches (LDX) Duct (LDD)
Modern Equivalent Asset (MEA) – see section 1.4(ii)
Absolute valuation 21CN Combi-cards (MSANF and MSANH) Low value, short
residual life and/or minimal impact on regulated areas of BT
The valuation methods used for the various asset categories are reviewed annually to ensure that they are still appropriate and produce robust valuations in the light of changes in technology and levels of investment. For example, when new technology is being introduced, the purchase price will represent its current cost but in later periods’ indexation or an absolute valuation will be introduced as prices change and/or the technology of the assets purchased is no longer the modern technology.
If the technology of the asset in place is still the current technology (subject to section (ii) following), the asset is valued on a like-for-like basis but at current prices rather than the prices when purchased.
(i) Existing technology
Where an asset is being revalued on a direct replacement basis, its replacement cost is usually assessed either by indexation, by absolute valuation or by extrapolated absolute valuation. The choice of method involves a judgement as to which method, given the data available, is likely to give a more accurate and robust valuation. Factors considered include the following:
Indexation This is an appropriate method when there has been little technological change in the asset category and all
the direct costs associated with bringing the asset into service would be incurred if it were to be replaced today. It also requires the production of an appropriate index. Net replacement cost is derived using indexation of the historical net book values – see section 1.8.
The table below shows those assets presently valued on an indexed historic basis as detailed in Annex 5.
Absolute valuation:In using the indexation method there may be difficulties in establishing appropriate indices and
hence it may be more accurate and reliable to use physical volumes and unit prices to derive a full absolute valuation. This method in turn may present difficulties, for example in establishing meaningful current unit prices, so the choice of method for a particular asset depends on individual circumstances.
The table below shows those assets presently valued on an absolute valuation basis.
Asset Description CoW 2013/14 CCA Depreciation Method Section ref. for detailed methodology Access Fibre Cable
Backhaul/ Core Fibre Cable
21st Century Network: Core Nodes Metro Nodes Metro Nodes Metro Nodes Ethernet WDM WDM MSAN MSAN LFSC CJF CORLU METCI METSI METAL ETHER WDMH WDM21 MSANF MMSANH Roll Forward Roll Forward NBV/GBV NBV/GBV NBV/GBV NBV/GBV NBV/GBV NBV/GBV NBV/GBV NBV/GBV NBV/GBV 6.2.4 6.2.7 6.2.7 6.2.7 6.2.7 6.2.7 6.2.7 6.2.7 6.2.7 6.2.7 6.2.7
Asset Description CoW
Copper Dropwires
Synchronous Digital Hierarchy Equipment Backhaul and Core Duct
Access Copper Cable Telecom Power Equipment Specialised Accommodation Assets
NWB & NWR SDH LDD LDC TPC ACPN
24 asset base then a full absolute valuation exercise may not be justified. In these cases we may choose to continue with previous year’s valuation and then extrapolate by adding capital expenditure at cost and applying an index that reflects known price movements.
The table below shows those assets presently valued using an extrapolated absolute valuation method.
Asset Description CoW
Date asset last valued as Absolute Valuation
Section ref. for detailed
methodology
System X Exchange Switches LDX 2008/09 6.2.6
Regulatory Asset Valuation (RAV): In some situations Ofcom have directed us to follow an alternative methodology to make the valuation consistent with that used in charge controls.
The table below shows those assets presently valued Ofcom determined Regulatory Asset Valuations. Asset Description CoW Section ref. for detailed methodology Duct used by copper cables LDD 6.2.5
(ii) Modern Equivalent Asset (MEA)
In situations where there is technological change, existing assets may not be replaced in an identical form. In such cases the replacement cost is based on the cost of a MEA ie the cost of a modern asset with similar service potential. In some cases the rate at which modern assets can be introduced is limited by practical constraints such as manufacturing and installation capacity, or lead times. The mix of technology used as the modern equivalent for valuation is generally taken as that forecast to be in place in three years’ time. The problems of assessing capacity and unit costs are the same as for any absolute valuation, as described above.
Currently the only asset valued as an MEA is that of MSAN combi cards which are valued by using the price of broadband cards. Combi cards were installed to cater for both voice and broadband but the intention is now to only use these combi cards as broadband cards.
(iii) Low value, short residual life or minimal impact on regulated parts of BT
Where assets:
have a relatively low value,
have a short asset life and only modest price movements have been observed,
are virtually fully depreciated,
have been recently acquired (so the current and historic costs are similar), or where
attribution to regulated markets is immaterial,
there will be little impact on the regulatory financial statements as a result of the differences between their historic and current replacement cost. Therefore, these assets will be valued at their historic cost.
Asset Description CoW Section ref. for detailed methodology
(i) Operating Cost Adjustments
If there are material differences in operating costs between the MEA and the existing asset, the MEA valuation is adjusted to reflect these. The differences may arise, for example, due to differing maintenance costs over the whole lives of the assets.
At present, for assets valued using an MEA approach, there are no cases where the differences have been identified as significant and hence no adjustments are required.
(ii) Functionality Abatements
Where existing assets are valued using a MEA, the unit price of the modern asset may reflect a higher level of functionality than that of the existing asset. In such cases the MEA valuations of the existing assets are adjusted downwards to reflect the estimated cost of upgrading these assets to the functionality of the version used in the valuation.
(iii) Surplus Capacity
An asset is considered to have surplus capacity only if there is capacity within the asset that is not in use and not expected to be put into use over BT’s planning horizon. Thus assets that have capacity planned to be brought into use, or which are needed to meet known planning margins or network resilience requirements are considered to be part of the operating capacity.
Where there is modularity in the provisioning of capacity, provided that a part of the modular asset is utilised or will be utilised over the planning horizon, these assets are included within the operating capacity in their entirety.
BT has not identified any material groups of assets that fall within the above definition of surplus capacity that require revaluation.
6.1.3 New Technology and its use as MEA
Emerging replacement technologies are treated as separate asset categories until it is clear that their costs are lower than those of an older technology and that they have become the modern equivalent. For example, fibre cable is being deployed in parts of the access network but its cost is not yet low enough for it to be considered as the MEA for copper cable.
In considering the use of new technology as the MEA it is assumed that there are no changes to BT’s network topology, ie the number of nodes and the links between them are valued in their existing configuration, not as a theoretical optimised network.
6.1.4 Unit Costs
Unit costs applied to capacity for absolute valuations are based on outturn prices where these are considered representative of the costs that would be relevant if the assets were being replaced at a normal rate in the normal course of business. It is possible that the prices currently being paid are unrepresentative, for example when ordering levels are particularly high or low, or at the end of a technology’s life. In such cases an estimate is made of an appropriate current cost with reference to internal and external data.
6.1.5 Choice and application of indices for Indexation Method
We have prepared price indices for each of the CoWs valued under the indexation method. These indices are usually composite indices constructed from Office for National Statistics (ONS) indices such as average earnings and weighted by analysis of elements of BT expenditure eg BT labour, contract, or stores. Annex 5 lists the indices (including their sources).
The year-end valuation for each asset is built up from historical asset data, sourced from the Group’s Fixed Asset Registers plus late registered assets from a late registration journal and WIP from the BT Group annual report. Indices
at 31 March (current year) are used in the year-end valuations in conjunction with the indices at 30 September in the year of registration for the asset being valued, as illustrated below. Use of the mid-year indices reflects the fact that
26 months’ indexation applied to them to derive their CCA value.
Example for an asset being valued at 31 March 2015:
6.1.6 Depreciation
Depreciation is provided on non-current assets on a straight-line (for HCA) basis from the time they are available for use, so as to write off their costs over their estimated useful lives, taking into account any expected residual values. No depreciation is provided on freehold land. The lives assigned are the same under both the current cost and historical cost conventions.
CCA depreciation for those assets valued on an indexed historic basis is calculated using the Indexed NBV/GBV methodology – see Annex 6.
For those assets valued on an absolute valuation basis, the CCA depreciation is derived using either NBV/GBV method or the Roll Forward method – See Annex 6 for more detail. The specific method used for each Class of Work is shown in Section 2.
6.1.7 Disposals, write-outs and write-offs
These are derived from HCA figures and revalued using the most appropriate method for the asset being valued within the overall approach described in Annex 6.
6.2
Detailed Valuation Methodology
6.2.1
Introduction
This section provides details of the methodologies adopted for deriving the gross valuation and CCA depreciation. The studies and data sources utilised in the preparation of the CCA Valuations referred to in this section are described in Annex 4.
A description of the Asset Movement Statement process for derivation of NRC including the underlying CCA movements is provided in Annex 6.
6.2.2
Land & Buildings
PropertyThe majority of property assets (general-purpose buildings, specialised buildings, general purpose land, specialised land and the majority of accommodation plant) are valued at historic cost. This is because only a small number of buildings are owned by BT and the CCA adjustments would be spread across a large number of services, resulting in immaterial adjustments to the individual services.
Year of Registration: GBV additions in the year GRC additions in the year 1990/91 1991/92 2013/15 TOTAL @ 31/3/15 A B Z ________ GBV = Sum of above A x Index @ 31/3/15 / Index @ 30/9/90 B x Index @ 31/3/15 / Index @ 30/9/91 Z x Index @ 31/3/15 /Index @30/9/12 _________ GRC = Sum of above
These assets are all associated with creating a suitable environment for housing network equipment (CoW ACPN). The largest element is for air ventilation and air chilling equipment but also included are fire, flood and gas detection equipment, electric light and power, kitchen equipment, and intruder detection.
We value these assets using the indexed historic principles but in order to better reflect the different types of assets within this CoW we have used different indices for each type. These indices are shown in Annex 5.
6.2.3
Access – Copper
Access Copper CableThis asset includes the overhead and underground copper cables that connect BT’s exchanges to the distribution point.
The valuation is calculated using an indexed historic method. To calculate an absolute valuation for an asset of the size and complexity of the copper network requires a number of significant assumptions and estimates, which would lead to volatility in the RFS.
RPI has been selected as the most the appropriate index for this asset.
Dropwire
This asset includes the copper wire from BT’s distribution point up to and including the main socket on an end-user’s property. The assets are valued using an Indexed Historic method. RPI has been selected for this asset consistent with the valuation of Access Copper Cable.
Other Assets
ISDN2 network terminating equipment (CoW HHB, HHR & NTIS) and broadband ADSL technology (CoW ADSL) are valued at historic cost as these assets are of relatively low value.
6.2.4
Access – Fibre
Access – Fibre CableThis asset includes the fibre cable from BT exchange to the end user’s premises. The assets are valued using the absolute valuation methodology (see below).
Details of Absolute Valuation Methodology used for Access Fibre – including key assumptions and any
models used
Step 1: Input Volumes. We download volumes of cable lengths by fibre size from INS (Integrated Networks
Systems). Since the cables lengths refer to each cable segment we can estimate the number of cable nodes or joints for each cable size.
Step 2: Input Standard Task Times. We use the same work activity units as used by BT’s fibre planners and
adjust them by applying a ratio of total time / total planned time.
Step 3: Input Unit Prices. We use BT’s standard labour rate for engineers’ pay and the latest fibre purchase
prices from BT Procurement.
Step 4: Calculation of Labour Costs. We calculate the total time required to lay the fibre cables and join them
together from the adjusted volumes, adjusted standard task times and a list of detailed activities required for each cable size. We then cost the total time using the input standard labour rate.
Many of the cable sizes present in the network are no longer available commercially so we use the task times required of the closest available cable size.