Effects of Fire Damage on the Structural
Properties of Steel Bridge Elements
FINAL REPORT
April 30, 2011
University of Pittsburgh
COMMONWEALTH OF PENNSYLVANIA
DEPARTMENT OF TRANSPORTATION
CONTRACT # 510601
WORK ORDER # PIT 011
1
Technical Report Documentation Page 1. Report No.
FHWA-PA-2011-009-PIT011
2. Government Accession No. 3. Recipient’s Catalog No.
4. Title and Subtitle
Effects of Fire Damage on the Structural Properties of Steel Bridge Elements
5. Report Date April 30, 2011
6. Performing Organization Code 7. Author(s)
Thomas Brandt, Amit Varma, Brent Rankin, Sorin Marcu, Robert Connor, Kent Harries
8. Performing Organization Report No. CE/ST 41
9. Performing Organization Name and Address University of Pittsburgh
Civil and Environmental Engineering Benedum Hall, Pittsburgh, PA 15261
10. Work Unit No. (TRAIS) 11. Contract or Grant No. 510601 – PIT 011
12. Sponsoring Agency Name and Address The Pennsylvania Department of Transportation Bureau of Planning and Research
Commonwealth Keystone Building 400 North Street, 6th Floor Harrisburg, PA 17120-0064
13. Type of Report and Period Covered Final Report: November 1, 2009 – April 30, 2011 14. Sponsoring Agency Code
15. Supplementary Notes
This study was performed at the Zukrow Laboratory at Purdue University 16. Abstract
It is well known that fire can cause severe damage to steel bridges. There are documented cases where fire has directly led to the collapse or significant sagging of a steel bridge. However, when the damage is less severe, the effects of the fire, if any, are not so clear. Evaluation techniques that can be performed easily in the field, but still provide uniform and meaningful information for this situation are lacking. The objective of this research is to develop simple yet effective guidelines for assessing the potential level of damage sustained during a fire when there are no obvious signs of distress (i.e., sagging, collapse). The guidelines are intended to be used by inspectors and engineers in the field immediately following the fire event to provide general insight into the potential influence the fire may have had on the material properties of the bridge steel, based on the visual appearance of the steel.
A unique testing method is reported in which flange and web sections from a bridge girder are tested in real fire scenarios. The test setup allows for the examination of differences in outcomes due to a variety of paint coatings on the steel, thickness of steel, temperature and duration of fire exposure. Each test is photographed at certain stages that would be seen at a fire affected-bridge. These photographs can then be compared to actual bridge damage and an estimate of surface temperature attained. Following each fire test, material properties may be determined and compared to virgin or unexposed steel and AASHTO specifications to establish whether the material properties have changed or if the material is below minimum standards. Since the test setup and procedures are well defined, the test method can be standardized so that additional data can be collected in a consistent manner and incorporated into the guidelines in the future.
This report, and more specifically the inspection guide provided in Chapter 7, provides a much-needed tool for the inspection and evaluation of steel bridge members exposed to fires where obvious physical damage has not occurred. It will allow uniform and quick initial determination on a bridge’s serviceability after undergoing fire exposures.
17. Key Words fire; steel bridges
18. Distribution Statement
No restrictions. This document is available from the National Technical Information Service, Springfield, VA 22161
19. Security Classif. (of this report) Unclassified
20. Security Classif. (of this page) Unclassified
21. No. of Pages 61
22. Price
2
EXECUTIVE SUMMARY
It is well known that fire can cause severe damage to steel bridges. There are documented cases where fire has directly led to the collapse or significant sagging of a steel bridge. In such cases, the bridges are closed and require major repair if not complete rebuilding. However, when the damage is less severe, the effects of the fire, if any, are not so clear. In these cases, DOT engineers and inspectors are pressed to determine, sometimes onsite, if the bridge can be reopened to traffic. Evaluation techniques that can be performed easily in the field, but still provide uniform and meaningful information for this situation are lacking.
Even when there is limited apparent damage, prior to reopening the bridge, the owner will close the bridge for an indefinite period of time to obtain material samples for testing to determine if the material properties still meet AASHTO specifications. This procedure can take time and severely impact the economy of surrounding municipalities due to bridge closure and result in other greater roadway hazards due to rerouting of traffic. As stated, when a bridge is visually distorted, the recommendations of what must be done to repair the bridge may be intuitive. However, when no apparent deformations are visible, the course of action is unclear. Therefore, the objective of this research is to develop simple yet effective guidelines for assessing the potential level of damage sustained during a fire when there are no obvious signs of distress (i.e., sagging, collapse). The guidelines are intended to be used by inspectors and engineers in the field immediately following the fire event to provide general insight into the potential influence the fire may have had on the material properties of the bridge steel, based on the visual appearance of the steel.
A unique testing method has been developed that allows researchers to take flange and web sections from a bridge girder and test them in real fire scenarios. The test setup allows researchers to examine the differences in outcomes due to a variety of paint coatings on the steel, thickness of steel, temperature and duration of fire exposure. Since the test setup and procedures are well defined, the test method can be standardized so that additional data can be collected in a consistent manner by any researcher and incorporated in the guidelines over time.
Following each test, material properties may be determined and compared to virgin or unexposed steel and AASHTO specifications to establish if the material properties have changed or if the material is below minimum standards. Each specific test is photographed at certain stages that would be seen at a bridge in the field after being involved in a fire. These photographs can then be compared to actual bridge damage and an estimate of surface temperature could be attained. The inspection guide would then give average values for the reduction or increase of tensile strength and toughness for a particular bridge.
This report, and more specifically the inspection guide, provides a much-needed tool for the inspection and evaluation of steel bridge members exposed to fires where obvious physical damage has not occurred. It will allow uniform and quick initial determination on a bridge’s serviceability after undergoing fire exposures.
3
TABLE OF CONTENTS
Section Title Page
1.0 INTRODUCTION 4
2.0 BACKGROUND 4
3.0 PROBLEM STATEMENT, RESEARCH OBJECTIVES, AND
METHODOLOGY
9
4.0 EXPERIMENTAL INVESTIGATIONS 10
4.1 Test Setup 10
4.2 Test Matrix 11
4.3 Specimens and Instrumentation 16
4.4 Post-Fire Evaluation and Material Testing 17
5.0 EXPERIMENTAL RESULTS 18
5.1 Post-Fire Evaluation of Plate Specimens-Part 1 18
5.2 Post-Fire Evaluation of Plate Specimens-Part 2 26
5.3 Post-Fire Evaluation of Plate Specimens-Part 3 34
5.4 Post-Fire Evaluation of Plate Specimens-Part 4 45
5.5 Findings and Conclusions from Post-Fire Evaluations 54
6.0 SUMMARY AND CONCLUSIONS 55
7.0 INSPECTION GUIDELINE 56
4
1.0INTRODUCTION
Steel bridges are occasionally subjected to fire events due to accidents or explosions of vehicles containing flammable materials. Significant bridge fire events have occurred in the recent past. For example:
(i) In Hazel Park, Michigan on July 15, 2009 an out of control car caused a tanker, carrying 13000 gallons of gas and 4000 gallons of diesel fuel, to strike an overpass on I-75. Intense heat and an explosion caused the overpass to collapse within 30 minutes of exposure to approximately 2300°F (1260oC) in temperature (Kodur et al. 2010).
(ii) In Oakland, California on April 29, 2007 a tanker that was traveling too fast overturned, dumping 8600 gallons of gasoline and causing an intense fire on I-880. Collapse occurred after 22 minutes of sustained fire loading. It is believed that temperatures during the fire reached 2000°F (1100°C). Softening of bolts in the connections and the girders caused large deformations resulting in the deck pulling off of its supports (Kodur et al. 2010). (iii) In Birmingham, Alabama on July 5, 2002 a car crashed into a tanker that was carrying
9000 gallons of fuel. This caused an explosion with fire temperatures exceeding 2000°F (1100°C). The resulting damage included seven to ten foot deflections of girders as well as damage to the deck (Hancock et al. 2008).
(iv) In Indianapolis, Indiana on Oct. 22, 2009, a truck hauling a trailer of liquefied propane lost control and crashed beneath the east- and westbound bridges carrying mainline I-465 traffic over a ramp carrying traffic from I-69. As a result of the fire, the steel superstructure was subjected to extreme temperatures. The duration of these temperatures could not be established accurately. The authors were involved with the post-fire evaluation of this bridge. Material coupons and samples were taken from the fire-exposed and unexposed portions of the steel bridge. The experimental evaluations indicated no major differences between the material properties with or without fire exposure damage (Marcu et al. 2011).
2.0BACKGROUND
Limited research has been conducted on the fire behavior and post-fire evaluation of steel bridges. Kodur et al. (2010) and Astaneh-Asl et al. (2009) are two studies which include case studies of bridges that have been exposed to fires, discuss ways to prevent fires and better ways of designing against failure during fire exposures, and express the need for further research in the area of post-fire inspection, evaluation, and fire resistant design.
5
Kodur et al. (2010) cite a study conducted by the New York State Department of Transportation in combination with 17 other states. They reported 1746 bridge failures collectively with a majority of the failures being caused by flooding. They also showed that about three times the number of bridges collapsed because of fire as opposed to seismic issues. Battelle et al. (2001) estimated that annually $139 million in damage is caused by accidents with either fire or explosions occurring during transit. This illustrates the importance of the current research and findings to the bridge engineering and inspection community.
Astaneh-Asl et al. (2009) discuss the effects of elevated temperatures due to fire on the material properties of steel bridges. As shown in Figure 2.1, the tensile yield strength of the steel decreases gradually up to 500oC (932oF). It is reduced to about 50% of its nominal yield strength at 600oC (1112oF). This essentially eliminates any factor of safety, which is usually between 1.5 and 2.0 for bridge calculations. The steel yield strength decreases more rapidly for temperatures greater than 500oC (932oF), and failure may be inevitable if temperatures keep increasing while the loading is sustained.
Astaneh-Asl et al. (2009) also discuss the effects of elevated temperatures due to fire on the material properties of concrete. Concrete undergoes cracking, spalling, and experiences a decrease in stiffness and strength as the temperature increases. Concrete has low thermal conductivity, which allows it to undergo heating for longer durations before the temperature increases significantly and damage occurs. As shown in Figure 2.2, the concrete compressive strength starts decreasing rapidly after its temperature reaches approximately 400°C (750°F). At temperatures of around 500oC (932oF), the concrete compressive strength is reduced to 50% of its nominal strength.
Figure 2.3 shows the reduction in the tensile strength of high strength low alloy (HSLA) reinforcing steel and prestressing steel with elevated temperatures. As shown, the tensile strength of prestressing steel reduces steadily for temperatures greater than 300°C (570°F), and the tensile strength of HSLA bars reduces steadily for temperatures greater than 400°C (750°F). Figure 2.4 shows the reduction in the tensile strength of high strength bolt and weld material at elevated temperatures. As shown, these strengths reduce gradually up to 400°C (750°F), and then reduce more rapidly and steadily for temperatures greater than 400°C (750°F).
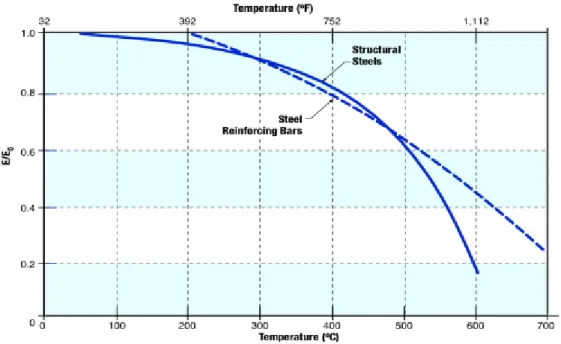
Figure 2.5 shows reduction in modulus with increase in temperature. As shown, the modulus reduces gradually up to 400°C (750°F), and then reduces more rapidly for temperatures greater than 400°C (750°F).
6
Temperature, oC
Figure 2.1. Reduction of steel yield strength with temperature (Astaneh-Asl et al. 2009)
Figure 2.2. Reduction in concrete compressive strength with temperature (Astaneh-Asl et al. 2009)
7
Figure 2.3. Reduction in strength of prestressing steel and high strength alloy bars with temperature (Astaneh-Asl et al. 2009)
Figure 2.4. Reduction in strength of bolts, welds, reinforcing bars with temperature (Astaneh-Asl et al. 2009)
8
Figure 2.5. Reduction in modulus of steel with respect to temperature (SFPE 2000). Astaneh-Asl et al. (2009) indicate that the extent of fire hazard or risk can be assessed for every bridge. These risks can be used to develop different categories of fire protection including: (i) no fire protection, (ii) active protection, and (iii) passive fire protection. The most common types of passive fire protection are panel systems, formed in place systems, spray applied materials (insulators), intumescent coatings, and use of fire resistant steel. It is important to note that the current AASHTO LRFD Bridge Design Specification (5th edition, 2010) does not have specific fire resistance requirements, design guidelines, or assessment and repair strategies for bridges exposed to fire.
Kodur et al. (2010) suggest that bridges should be designed according to a performance-based design approach. Each bridge should be assessed for hazards based on the probability of occurrence of fire considering both life safety and property protection. They suggest using the building fire safety design strategy for bridges since there are no mathematical models for bridge exposure.
Both Kodur et al. (2010) and Astaneh-Asl et al. (2009) identify the need for post-fire inspection and evaluation of bridges. It is relatively easy to inspect bridges that have distortions of several feet and require elements (for example, beams or diaphragms etc.) to be replaced. However, it is much more difficult to perform post-fire evaluation of bridges that have been exposed to fire exposures but have not sustained large deformations. There is a clear need for post-fire evaluation techniques to evaluate the structural integrity and material properties of bridges exposed to fires but having minimal distortions and fire induced deformations since the condition of the bridge is not obvious (i.e., no visible damage).
9
The following four steps are recommended for post-fire assessment (Kodur et al. 2010):
1. On-site Inspection: A quick visual inspection of the bridge elements exposed to fire such as piers, girders, decks and bearings. Member deformations and material discoloration may indicate the extent of damage caused by fire loading. In concrete sections (such as girders and decks), problems may include cracks, spalling, and surface cover delaminations. Steel members exposed to fire may exhibit buckling, lateral drift, bending, and distortion when exposed to high temperatures.
2. Residual strength tests: Concrete cores obtained from damaged bridge elements can be used to determine their compressive strength. Also, petrographic analysis can be performed on the concrete cores to assess the level of microcracking caused by high temperatures, which influences the performance and durability of concrete. Material strength tests should be conducted on coupons taken from fire exposed steel shapes.
3. Loading Rate Analysis: The undamaged areas of the bridges should be analyzed to evaluate the secondary effects of distortions and deterioration of material properties in the fire exposed areas. The shear and flexural strengths of the fire exposed deck and girders should be evaluated based on field inspection reports and fire exposure.
4. Repair Strategies: After the post-fire damage assessment is completed, relevant repair strategies should be implemented. Research may be necessary to develop proper repair strategies. Moderately damaged members may be repaired, while severely damaged ones should be replaced.
3.0PROBLEM STATEMENT, RESEARCH OBJECTIVES, and METHODOLOGY
State highway agencies (for example, Pennsylvania Department of Transportation (PennDOT), Indiana Department of Transportation (INDOT), etc.) must occasionally perform post-fire inspections and evaluations of steel bridges exposed to fires. This poses a significant challenge for bridge inspectors because there are rarely any accurate measurements of temperatures, time duration of fire, sustained loading etc. available during or following the event. The bridge inspectors have very little information available on site, and even less research-based or even experience-based knowledge to draw upon to make decisions regarding the structural integrity and material properties of the fire exposed bridge and its elements.
To assist in the decision making process, the objectives of this research are to develop simple but experimental research-based inspection or evaluation tools that can be used to:
(i) Aid the visual inspection of steel bridges and aid in the estimation of the temperatures, durations, and damage endured by the bridge elements during the event.
(ii) Aid in the estimation of the mechanical properties of the steel bridge elements that are exposed to fire based on the temperatures and fire durations estimated from the visual inspection.
10
(iii) Provide guidance to assist with the decision process regarding the integrity of steel bridges exposed to fire based on the visual inspection and estimated mechanical properties.
The paint coating system used for steel bridge elements is an important parameter in this research. The focus of this report is on the effects of fire exposure on steel bridge elements with old paint coating systems and also with new paint coating systems endorsed by Bulletin 15 issued by the PennDOT.
The research objectives were achieved by conducting controlled fire exposure tests on steel bridge elements with PennDOT endorsed paint coating systems as follows.
The steel bridge elements (plates) with paint coatings were exposed to fires using a specially designed jet flame setup with a sooting fuel type (e.g., ethylene). Two different paint coating systems (Acrolon and Carbothane) were considered in the tests. Additionally, some steel plates from actual steel bridges (decommissioned by PennDOT and as well as coated specimens provided to the researchers) were also evaluated.
The fire exposures were controlled by adjusting the distance from the steel plate to the jet nozzle to achieve different fire temperatures (800, 1000, and 1200 oF (427, 538, and 649 oC)) and exposure durations (20 – 40 minutes) on the steel plates. The steel plate temperatures were measured using thermocouples attached to the surfaces.
After fire exposure, the steel plates were hand brushed with a wire brush (to remove coating debris) and then washed clean. Photographs were taken of both sides of the steel plates: (a) before fire exposure, (b) after fire exposure, (c) after brushing, and (d) after washing. These photographs were used to develop the visual inspection guide for steel bridge elements exposed to fires.
Material coupons were fabricated from the steel plates, and uniaxial tension tests (ASTM E8/AASHTO T68), Charpy V-notch (CVN) fracture toughness tests (ASTM E23/AASHTO T266), and surface hardness tests (ASTM E18/AASTHO T80) were conducted according to applicable ASTM standards to determine the post-fire yield strength, tensile strength, elastic modulus, elongation at rupture, fracture toughness, and surface hardness of the steels. These material properties will be used to develop guidelines for evaluating steel bridge elements exposed to fires.
4.0EXPERIMENTAL INVESTIGATIONS
4.1 Test Setup
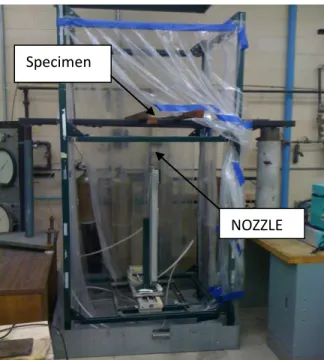
The controlled fire exposure tests were conducted at Zukrow Laboratory, which is an indoor fire testing laboratory at Purdue University in West Lafayette, Indiana. A steel frame superstructure with a flame jet setup within the fixture was used to apply controlled fire exposure to the steel bridge elements (plates). A photograph of the flame jet setup in Zukrow laboratory is shown in
11
Figure 4.1. At the top of the setup is an exhaust fan that discharges the soot and smoke from flame safely to the outside of the laboratory.
Figure 4.1. Photograph of jet flame test set up.
The flame jet consisted of an 8 mm nozzle connected to an adjustable meter, which allowed calibrated mass flow rates to be achieved. Ethylene gas (C2H4) was used to simulate the fire
exposure. This is a sooting fuel with adiabatic flame temperature of 2900oC (5252oF). This temperature assumes a pre-mixed flame and no heat loss. However, in the tests there was heat loss to the specimen and cooling from the ambient surroundings, which was also representative of real bridge fire exposures.
The ethylene fuel was not mixed with air until it exited the nozzle. The flow rate was initially set at 30 mg/s and adjusted with time depending upon the desired temperature. The steel plate specimens were suspended over the flame jet using four fixed tabs, one at each corner of the specimen. The nozzle was attached to a screw jack, which allowed it to traverse along three axes. The steel plate specimens were 10 x 10 in. squares cut from either plate stock or out of web and flange materials provided by PennDOT as described in the following sub-section.
4.2 Test Matrix
The complete test matrix consisted of steel plate specimens that were taken from the flanges and web materials of decommissioned steel bridges or ASTM A709(ASTM A709) plate stock as follows:
1. PennDOT had provided a pallet of beam sections from a steel bridge that had been exposed to a real fire event. It included sections that had been directly exposed to the fire and those
NOZZLE Specimen
12
that were away from the fire (unexposed). The beam sections had ¾ in. thick flanges and ½ in. thick webs with an indeterminate paint coating on them.
2. PennDOT also provided a pallet of steel beam sections from a decommissioned steel bridge of an age similar to that described in 1 (above) that had never been exposed to a fire. The beam sections had ½ in. thick flanges and ½ in. thick webs with an indeterminate paint coating on them.
3. As part of this research ½ in. thick and 1 in. thick A709 plate stock was obtained. Plates with the same thickness (½ in. or 1 in.) came from the same heat. A suite of ½ in. thick and 1 in. thick specimens with Acrolon paint coating for existing steels were prepared. This paint coating system is described below.
4. A suite of ½ in. thick and 1 in. thick A709 steel plate specimens with Carbothane paint coating systems for new steels were also prepared. This paint coating system is also described below.
PennDOT has a list of currently approved coatings in Bulletin 15 for existing and new structural steels. All steels are required to be coated with three-coat zinc-rich paint systems. Existing steels can be coated with systems from both Carboline Company and Sherwin Williams Company. However, new steels can be coated only with systems from the Carboline Company.
For existing steels, Sherwin Williams’ Acrolon coating consists of a primer coat of ZincClad III HS, Macropoxy 646 intermediate coat, and Acrolon 218 HS top coat. This ends up rusty red in color.
For new steels, the inorganic zinc coating system (Carbothane) from Carboline Company must be used. The first coat is Carbozinc 11 HS, followed by an intermediate Carboguard 893 coat, and a finish coat of Carbothane 133. This ends up steel blue in color
Table 4.2 presents the test matrix for the experimental investigations. The Specimen ID consists of the origin of the steel, a letter and a number identifier, and the test condition of the plate. The table consists of 4 parts. The first part is the set of plate specimens made from the beam sections that had been exposed to a real fire event. Four beam sections (PennDOT 1, 2, 3, and 4) were provided, of which PennDOT 1 and 4 were exposed to the fire event, and PennDOT 2 and 3 were not exposed to the fire event.
As shown in Table 4.2, specimens were made from the ¾ in. thick flanges and ½ in. thick webs of the burned (PennDOT 1 and 4) beam sections, and the corresponding control specimens were made from ¾ in. thick flanges and ½ in. thick webs of the unburned (PennDOT 2) section. These plate specimens were used only to conduct material tests, and were not exposed to controlled fires using the flame jet setup.
As shown in Table 4.2, plate specimens were also made from the ¾ in. thick flanges and ½ in. thick webs of the unburned (PennDOT 3) beam section that was not exposed to the fire event. These included a control specimen, and two specimens that were exposed to controlled fires using the flame jet setup to surface temperatures of 800 and 1200 oF.
13
The second part is the set of plate specimens made from the beam sections from the decommissioned steel bridge that had never been exposed to a fire. The beam section (PennDOT 5) had ½ in. thick webs and ½ in. thick flanges. As shown in Table 4.2, three plate specimens were made from both the ½ in. thick flanges and the ½ in. think web. These included a control specimen, and two specimens that were exposed to controlled fires using the flame jet setup to surface temperatures of 800 and 1200 oF.
The third part is the set of plate specimens made from ½ in. thick and 1 in. thick A709 plate stock with the Sherwin-Williams’ Acrolon paint coating for existing steels (rusty red in color). As shown in Table 4.2, a total of five specimens each were tested for the two plate thicknesses (1/2 in. and 1 in.). These included: (i) control specimen (that was not heated), (ii) three specimens that were exposed to controlled fires using the flame jet setup to achieve surface temperatures of 800, 1000, 1200 oF, and (iii) one specimen that was exposed to an uncontrolled fire using the flame jet setup, which resulted in 1200 oF surface temperature also.
The fourth part is the set of plate specimens made from ½ in. thick and 1 in. thick A709 plate stock with the Carboline’s Carbothane paint coating for new steels (steel blue in color). As shown in Table 4.2, a total of four ½ in. thick plate specimens were tested. These included: (i) control specimen (that was not heated), (ii) two specimens that were exposed to controlled fires using the flame jet setup to achieve surface temperatures of 1000 and 1200 oF, and (iii) one specimen that was exposed to an uncontrolled fire resulting in 1200 oF surface temperature also. A total of three 1 in. thick plate specimens were tested. These included two specimens that were exposed to controlled fires using the flame jet setup to achieve surface temperatures of 1000 and 1200 oF, and (iii) one specimen that was exposed to an uncontrolled fire resulting in 1200 oF surface temperature also.
Typical surface temperature-time curves resulting from the heating are shown in Section 5. Generally, heated specimens were brought to their target temperatures and this was maintained for 20 minutes. The “uncontrolled” specimens were exposed to unrestricted heating for 40 minutes.
Thus, the parameters included in the experimental investigations are: (i) effects of real fire events on material properties, (ii) plate thickness, (iii) coating type, (iv) surface temperature achieved, and (v) duration of fire.
14
Table 4.2. Test Matrix
Part Specimen ID
Origin Type or Temperature
Description
1 Penn DOT 2 AA (27) Control PennDOT 2 Control Specimen
½ in. thick web Material tests only 1 Penn DOT 1 Y (25) Burned PennDOT 1 Burned
Specimen
½ in. thick burned web Material tests only 1 Penn DOT 4 EE (31) Burned PennDOT 4 Burned
Specimen
½ in. thick burned web Material tests only 1 Penn DOT 2 BB (28) Control PennDOT 2 Control
Specimen
¾ in. thick flange Material tests only 1 Penn DOT 1 Z (26) Burned PennDOT 1 Burned Specimen ¾ in. thick burned flange
Material tests only 1 Penn DOT 4 FF (32) Burned PennDOT 4 Burned Specimen ¾ in. thick burned flange
Material tests only 1 Penn DOT 3 CC (29) Control PennDOT 3 Control Specimen ½ in. thick web
Material tests only 1 Penn DOT 3 S (19) 800 F PennDOT 3 800 F ½ in. thick web
Flame jet and material tests 1 Penn DOT 3 T (20) 1200 F PennDOT 3 1200 F ½ in. thick web
Flame jet and material tests 1 Penn DOT 3 DD (30) Control PennDOT 3 Control Specimen ¾ in. thick flange
Material tests only 1 Penn DOT 3 V (22) 800 F PennDOT 3 800 F ¾ in. thick flange
Flame jet and material tests 1 Penn DOT 3 W (23) 1200 F PennDOT 3 1200 F ¾ in. thick flange
Flame jet and material tests
Part Specimen ID Origin Type or Temperature
Description
2 Penn DOT 5 KK (37) Control PennDOT 5 Control Specimen
½ in. thick web Material tests only 2 Penn DOT 5 GG (33) 800 F PennDOT 5 800 F ½ in. thick web
Flame jet and material tests 2 Penn DOT 5 II (35) 1200 F PennDOT 5 1200 F ½ in. thick web
Flame jet and material tests 2 Penn DOT 5 LL (38) Control PennDOT 5 Control
Specimen
½ in. thick flange Material tests only 2 Penn DOT 5 HH (34) 1200 F PennDOT 5 1200 F ½ in. thick flange
Flame jet and material tests 2 Penn DOT 5 JJ (36) 800 F PennDOT 5 800 F ½ in. thick flange
15
Part Specimen ID Origin Type or Temperature
Description
3 Acrolon Q (17) Control W A709 Control Specimen ½ in. thick plate Material tests only 3 Acrolon A (1) 800 W A709 800 F ½ in. thick plate
Flame jet and material tests 3 Acrolon B (2) 1000 W A709 1000 F ½ in. thick plate
Flame jet and material tests 3 Acrolon C (3) 1200 W A709 1200 F ½ in. thick plate
Flame jet and material tests 3 Acrolon D (4) Uncontrolled W A709 1200 F
uncontrolled
½ in. thick plate
Flame jet and material tests 3 Acrolon R (18) Control F A709 Control Specimen 1 in. thick plate
Material tests only 3 Acrolon E (5) 800 F A709 800 F 1 in. thick plate
Flame jet and material tests 3 Acrolon F (6) 1000 F A709 1000 F 1 in. thick plate
Flame jet and material tests 3 Acrolon G (7) 1200 F A709 1200 F 1 in. thick plate
Flame jet and material tests 3 Acrolon H (8) Uncontrolled F A709 1200 F
uncontrolled
1 in. thick plate
Flame jet and material tests
Part Specimen ID Origin Type or Temperature
Description
4 Carbothane J (10) Control W A709 Control Specimen ½ in. thick plate Material tests only 4 Carbothane I (9) 1000 W A709 1000 F ½ in. thick plate
Flame jet and material tests 4 Carbothane K (11) 1200 W A709 1200 F ½ in. thick plate
Flame jet and material tests 4 Carbothane L (12) Uncontrolled W A709 1200 F
uncontrolled
½ in. thick plate
Flame jet and material tests 4 Carbothane M (13) 800 F A709 800 F 1 in. thick plate
Material tests only 4 Carbothane O (15) 1200 F A709 1000 F 1 in. thick plate
Flame jet and material tests 4 Carbothane P (16) Uncontrolled F A709 1200 F
uncontrolled
1 in. thick plate
16 4.3 Specimens and Instrumentation
As shown in Figure 4.3, each plate specimen was approximately 10 x 10 in., and was instrumented with two thermocouples. The thermocouples were attached to the center of the specimens on both sides, i.e., (i) the flame side or bottom, and (ii) the non-flame side or top. Two 1/16” holes were drilled just off center in order to allow the thermocouple wires to pass through the plate from the top to minimize flame disturbance on the plate. For the same reason, the holes and the thermocouples are covered with a smooth layer of fiberglass paste.
The thermocouples were connected to a data acquisition unit which recorded temperatures of the surfaces of the plate at user defined time intervals. A thermal imaging camera was also used to visualize the heat intensities in the flame and on the plate surface. The intensity could also be used to determine the highest temperature in the flame and the difference in temperatures in the specimens. An infrared temperature gun was also used to take spot readings of specimen temperatures and compare it with thermocouple measurements.
Figure 4.3. Plate Specimen with Thermocouples.
10” x 10” plate thermocouple location holes for thermocouple wire
17
4.4 Post-Fire Evaluation Procedure and Material Testing
All the plate specimens, except those identified as control specimens in Table 4.2 were subjected to controlled fire exposure using the flame jet setup described in Section 4.1. Photographs of the steel plates surfaces (both flame and non-flame side) were taken: (i) before fire exposure, (ii) after fire exposure, (iii) after brushing clean with a wire brush, and (iv) after washing. These photographs constitute physical evidence regarding the appearance of steel bridge elements (plates) with different paint coating systems exposed to fires, and form the basis of post-fire inspection and evaluation guidelines.
After subjecting the plate specimens to controlled fire exposures, material tests were conducted on coupons fabricated according to applicable ASTM standards. As shown in Figure 4.4, from each plate specimen, three Charpy V-notch (CVN) coupons (ASTM E23) were fabricated from the central 3 in., and another three CVN coupons were fabricated from outside the central 3 in. These six CVN coupons were fabricated parallel to the rolling direction with the CVN notch oriented as shown in the Figure. One tension coupon (ASTM E8) is taken from either end of the specimen parallel to the rolling direction. Figure 4.4 shows a drawing of the locations of the material coupons as they were taken from the 10 x 10 in. plate specimens.
Rockwell hardness (ASTM E18) tests were also conducted on all plate specimens. The Rockwell hardness B scale was used for these tests. Three measurements were taken on all specimens as close to the center of the plates as possible. This ensured that the measurements were in the zone of the plate directly affected by flame impingement. Material tests were also conducted on coupons fabricated from the control plate specimens, i.e., plates that were not exposed to fires. These material coupons were also taken as shown in Figure 4.4. The material properties for the control plates were compared with those obtained for the fire exposed plates to evaluate the effects of fire exposures and other parameters on the yield strength, tensile strength, elongation at rupture, fracture toughness, and surface hardness of the steel materials
Figure 4.4. Layout of Material Coupons Taken From Plate Specimens
tension coupons CVN coupons rolling direction
18
5.0EXPERIMENTAL RESULTS
5.1 Post-Fire Evaluation of Plate Specimens – Part 1
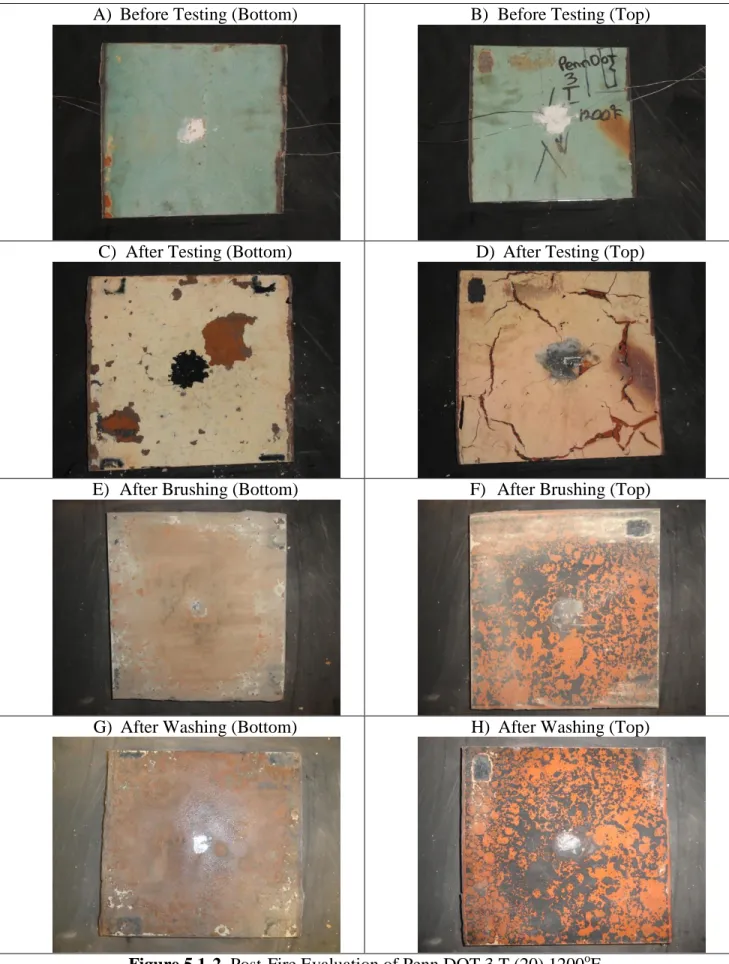
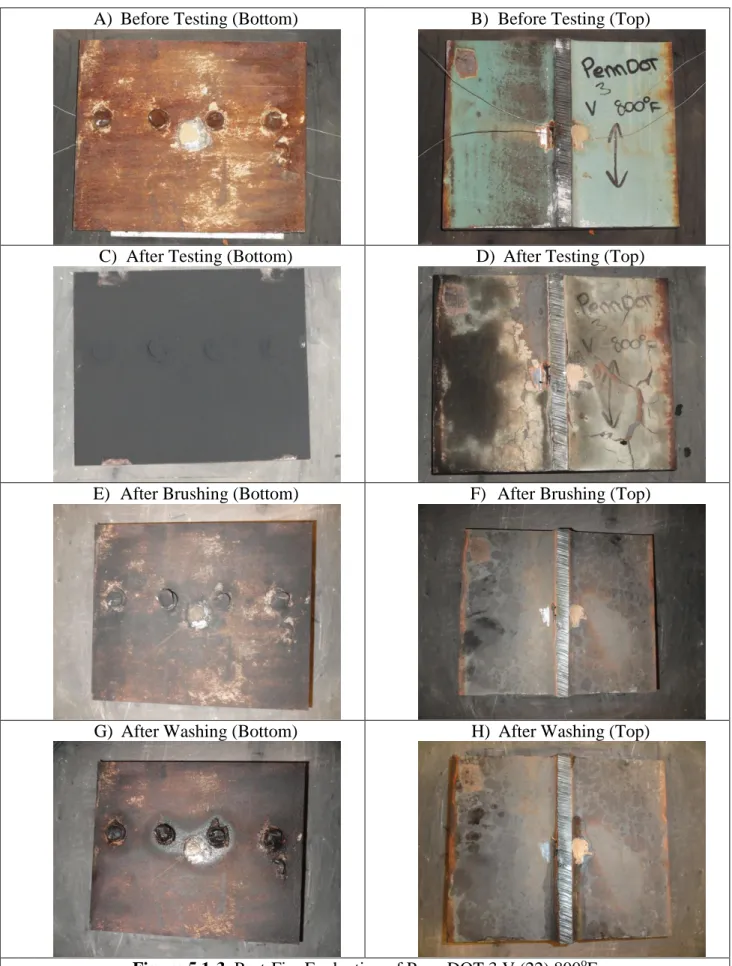
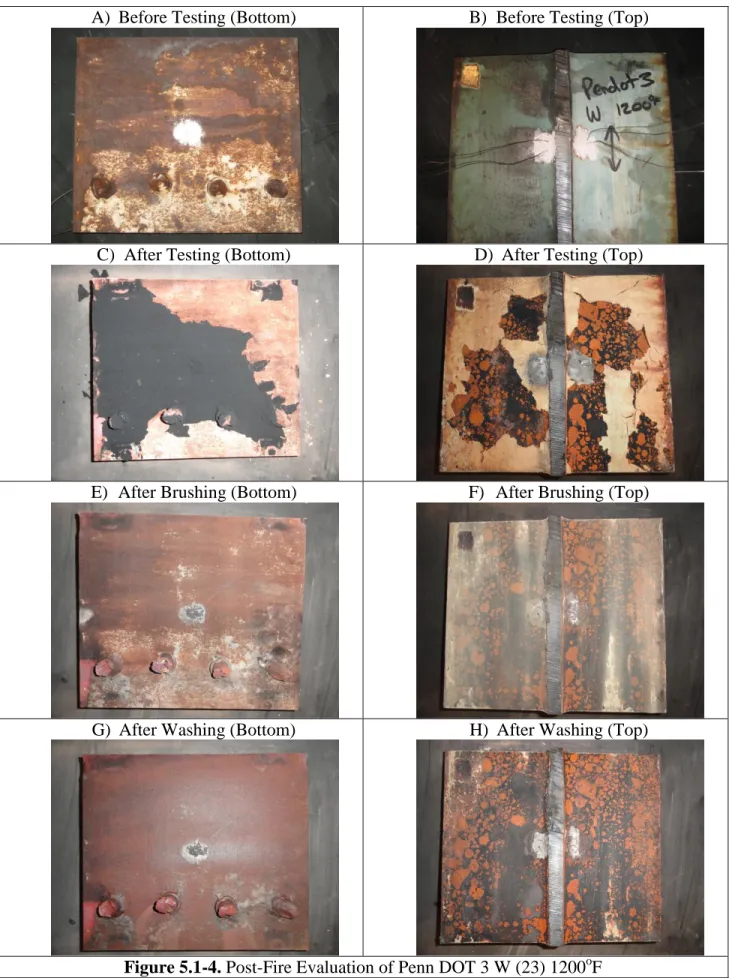
Figures 5.1-1 to 5.1-4 show photographs of the post-fire evaluation of the plate specimens (Part 1) identified in Table 4.2-1 and listed below. These include photographs taken as described in Section 4.4.
Part Specimen ID Origin Type or Temperature
Description
1 Penn DOT 3 S (19) 800 F PennDOT 3 800 F ½ in. thick web
Flame jet and material tests 1 Penn DOT 3 T (20) 1200 F PennDOT 3 1200 F ½ in. thick web
Flame jet and material tests 1 Penn DOT 3 V (22) 800 F PennDOT 3 800 F ¾ in. thick flange
Flame jet and material tests 1 Penn DOT 3 W (23) 1200 F PennDOT 3 1200 F ¾ in. thick flange
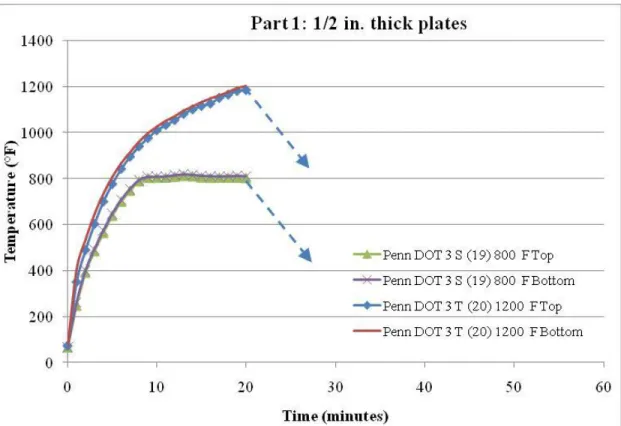
Flame jet and material tests Figures 5.1-5 and 5.1-6 show the measured temperature-time (T-t) curves for these plate specimens with ½ in. and 3/4 in. thickness, respectively. As shown the target temperatures were achieved and maintained for 20 minutes before cooling. The target time of 20 minutes is representative of the typical fire duration that can cause collapse of a bridge; for example, consider the Oakland, California bridge discussed earlier in Section 2.0.
Additionally, Table 5.1-1 includes the standard material test results obtained from testing the coupons fabricated from the plate specimens identified in Table 4.2-1. These material test results included the results from tests conducted on coupons from plates that were already burned by the real fire event, and hence not subjected to additional fire exposure.
As shown in Table 5.1-1, fire exposures have only a minor effect on the steel yield strength, ultimate strength and elongation, and surface hardness. This is irrespective of the steel surface temperature achieved during the fire exposure tests and the steel plate thickness. Additionally, as shown in Table 5.1-1, the fire exposures result in only a slight reduction in the CVN fracture toughness values for the steels. The reduction is slightly higher for the thicker (3/4 in. thick) steel plates.
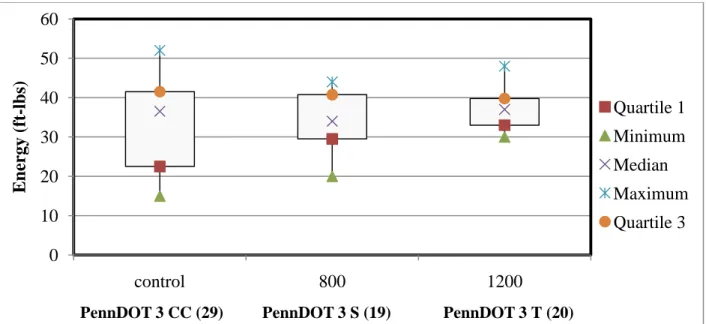
Figures 5.1-7 and 5.1-8 shows box plots that can be used to more comprehensively evaluate the effects of fire exposure on the CVN fracture toughness of steels. These figures focus on ½ in. thick and 3/4 in. thick steel plates that had been subjected to controlled fire exposure using the flame jet setup. The box plots include for each plate specimen: (i) the minimum, maximum, and median values of fracture toughness, and (ii) the first and third quartile fracture toughness values. The first quartile means that 25% of the values will be lower than this value, and third quartile means 75% of the values will be lower than this value. These Figures 5.1-7 and 5.1-8 show that the fire exposures do not have a statistically significant effect on the CVN fracture toughness of steels, which numerically still satisfies the 15 ft-lb limit for Zone 2 (AASHTO 2010 §6.6.2).
19
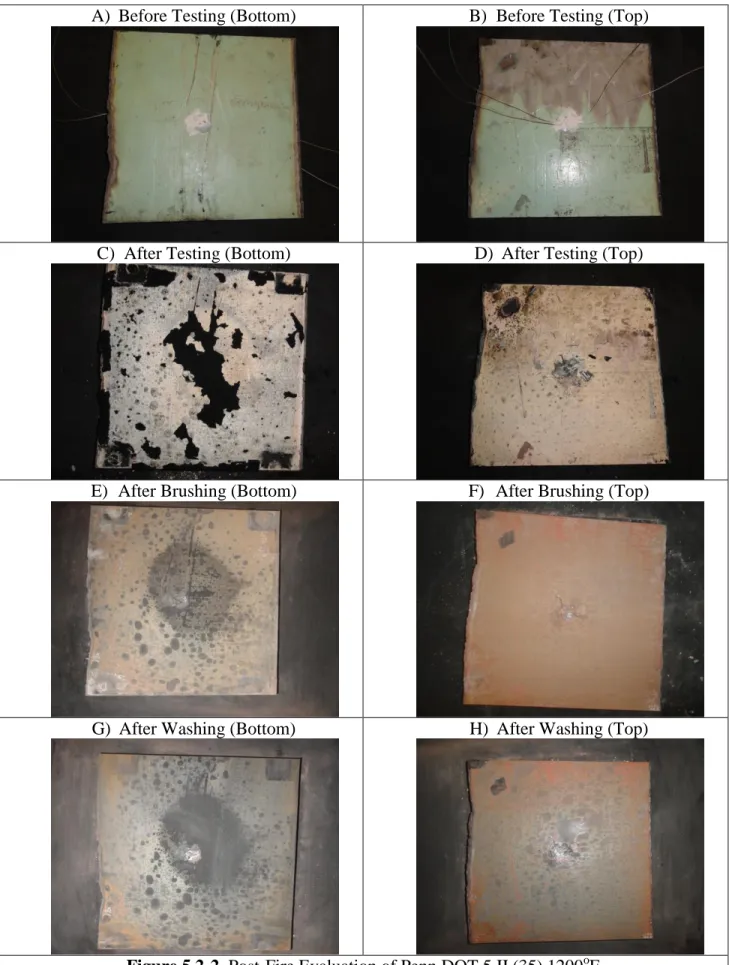
A) Before Testing (Bottom) B) Before Testing (Top)
C) After Testing (Bottom) D) After Testing (Top)
E) After Brushing (Bottom) F) After Brushing (Top)
G) After Washing (Bottom) H) After Washing (Top)
20
A) Before Testing (Bottom) B) Before Testing (Top)
C) After Testing (Bottom) D) After Testing (Top)
E) After Brushing (Bottom) F) After Brushing (Top)
G) After Washing (Bottom) H) After Washing (Top)
21
A) Before Testing (Bottom) B) Before Testing (Top)
C) After Testing (Bottom) D) After Testing (Top)
E) After Brushing (Bottom) F) After Brushing (Top)
G) After Washing (Bottom) H) After Washing (Top)
22
A) Before Testing (Bottom) B) Before Testing (Top)
C) After Testing (Bottom) D) After Testing (Top)
E) After Brushing (Bottom) F) After Brushing (Top)
G) After Washing (Bottom) H) After Washing (Top)
23
Figure 5.1-5 Measured Temperature-Time Curves for ½ in. Thick Part 1 Plate Specimens
24
Table 5.1-1 Material Test Results for Coupons from Plate Specimens (Part 1)
Specimen ID σy σu %e CVN results AVG Hardness Test AVG
Penn DOT 2 AA (27) Control ½ in. thickness
Coupon 1 36.3 64 42 Inner 3 42 47 52 47.0 Top 71 70.5 70 70.5 Coupon 2 40.4 64 41 Outer 3 53 42 54 49.7 Bottom 70 71.5 71 70.8
Penn DOT 1 Y (25) Burned ½ in. thickness
Coupon 1 40.6 64.5 44 Inner 3 29 44 43 38.7 Top 69 70.5 70.5 70 Coupon 2 34.8 64.5 41 Outer 3 34 20 30 28.0 Bottom 71 72 73 72 Penn DOT 4 EE (31) Burned
½ in. thickness
Coupon 1 40.3 63 43 Inner 3 32 40 29 33.7 Top 67 71 70 69.3 Coupon 2 35.9 62 43 Outer 3 21 41 36 32.7 Bottom 64.5 65.5 66 65.3
Penn DOT 2 BB (28) Control ¾ in. thickness
Coupon 1 36.1 63 50 Inner 3 42 67 60 56.3 Top 62 58.5 64 61.5 Coupon 2 37 62 48 Outer 3 43 52 65 53.3 Bottom 55 62 71 62.6
Penn DOT 1 Z (26) Burned ¾ in. thickness
Coupon 1 36.5 64.5 50 Inner 3 61 45 62 56.0 Top 68 71.5 70 69.8 Coupon 2 36.9 64 50 Outer 3 32 45 66 47.7 Bottom 70 69.5 69 69.5 Penn DOT 4 FF (32) Burned
¾ in. thickness
Coupon 1 36.4 62.5 50 Inner 3 44 57 40 47.0 Top 60 65 66.5 63.8 Coupon 2 63 41.1 50 Outer 3 53 54 64 57.0 Bottom 65.5 66.5 68.5 66.8
Penn DOT 3 CC (29) Control ½ in. thickness
Coupon 1 38.4 61 42 Inner 3 36 37 43 38.7 Top 68 68 70 68.6667 Coupon 2 36.5 60.5 45 Outer 3 52 15 18 28.3 Bottom 68.5 68 67.5 68
Penn DOT 3 S (19) 800°F ½ in. thickness
Coupon 1 41.5 62.5 44 Inner 3 29 44 43 38.7 Top 71 71 71 71 Coupon 2 34.2 61.5 34 Outer 3 34 20 30 28.0 Bottom 70.5 70.5 70.5 70.5 Penn DOT 3 T (20) 1200°F
½ in. thickness
Coupon 1 40.7 62 45 Inner 3 35 40 39 38.0 Top 63 68 69.5 66.8 Coupon 2 37.1 61.5 42 Outer 3 30 48 31 36.3 Bottom 65 68 70 67.6
Penn DOT 3 DD (30) Control ¾ in. thickness
Coupon 1 38.9 63.5 47 Inner 3 71 62 56 63.0 Top 66.5 67 67 66.8 Coupon 2 36.3 63 45 Outer 3 46 66 60 57.3 Bottom 74 73 76 74.3
PennDOT 3 V (22) 800°F ¾ in. thickness Penn DOT 3 W (23) 1200°F
¾ in. thickness
Coupon 1 36.5 62.5 49 Inner 3 34 14 40 29.3 Top 75.5 73 72 73.5 Coupon 2 39.3 63 50 Outer 3 41 43 43 42.3 Bottom 76 77 75 76.0
25
Figure 5.1-7. Statistical Evaluation of CVN Fracture Toughness Values for 1/2 in. thick Plate Specimens (Part 1)
Figure 5.1-8. Statistical Evaluation of CVN Fracture Toughness Values for ¾ in. thick Plate Specimens (Part 1) 0 10 20 30 40 50 60 control 800 1200 E n er gy (f t-lb s) Quartile 1 Minimum Median Maximum Quartile 3
PennDOT 3 CC (29) PennDOT 3 S (19) PennDOT 3 T (20)
0 10 20 30 40 50 60 70 80 control 800 1200 E n er gy (f t-lb s)
Fire Exposure Temperature
Quartile 1 Minimum Median Maximum Quartile 3
26 5.2 Post-Fire Evaluation of Plate Specimens – Part 2
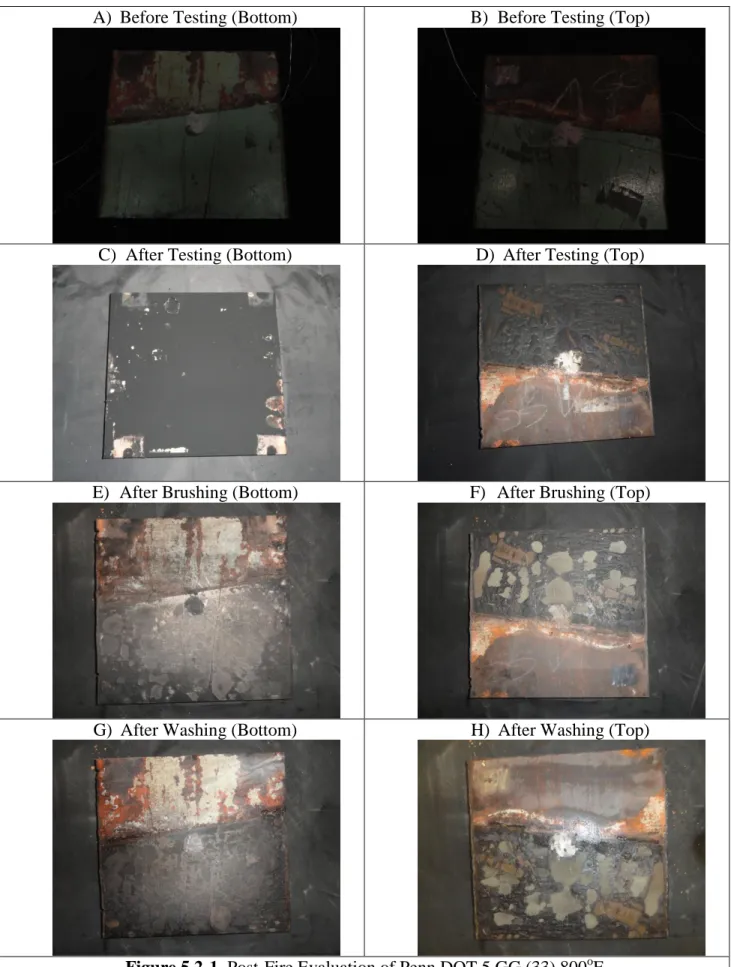
Figures 5.2-1 to 5.2-4 show photographs of the post-fire evaluation of the plate specimens (Part 2) identified in Table 4.2-1 and listed below. These include photographs taken as described in Section 4.4.
2 Penn DOT 5 GG (33) 800 F PennDOT 5 800 F ½ in. thick web
Flame jet and material tests 2 Penn DOT 5 II (35) 1200 F PennDOT 5 1200 F ½ in. thick web
Flame jet and material tests 2 Penn DOT 5 HH (34) 1200 F PennDOT 5 1200 F ½ in. thick flange
Flame jet and material tests 2 Penn DOT 5 JJ (36) 800 F PennDOT 5 800 F ½ in. thick flange
Flame jet and material tests
Figures 5.2-5 and 5.2-6 show the measured temperature-time (T-t) curves for these plate specimens with ½ in. thick webs and flanges, respectively. As shown the target temperatures were achieved and maintained for 20 minutes before cooling.
Additionally, Table 5.2-1 includes the standard material test results obtained by testing the coupons fabricated from the ½ in. thick plate specimens identified in Table 4.2-1. As shown in Table 5.2-1, fire exposures have only a minor effect on the steel yield strength, ultimate strength and elongation, and surface hardness. This is irrespective of the steel surface temperature achieved during the fire exposure tests. Additionally, as shown in Table 5.2-1, the fire exposures result in only a slight reduction in the CVN fracture toughness values for the steels.
Figures 5.2-7 and 5.2-8 shows box plots that can be used to more comprehensively evaluate the effects of fire exposure on the CVN fracture toughness of steels. These figures focus on ½ in. thick webs and the 1/2 in. thick flange steel plates that had been subjected to controlled fire exposure using the flame jet setup. The box plots include for each plate specimen: (i) the minimum, maximum, and median values of fracture toughness, and (ii) the first and third quartile fracture toughness values. The first quartile means that 25% of the values will be lower than this value, and third quartile means 75% of the values will be lower than this value. These Figures show that the fire exposures do not have a statistically significant effect on the CVN fracture toughness of steels, which numerically still satisfies the 15 ft-lb limit for Zone 2 (AASHTO 2010 §6.6.2).
27
A) Before Testing (Bottom) B) Before Testing (Top)
C) After Testing (Bottom) D) After Testing (Top)
E) After Brushing (Bottom) F) After Brushing (Top)
G) After Washing (Bottom) H) After Washing (Top)
28
A) Before Testing (Bottom) B) Before Testing (Top)
C) After Testing (Bottom) D) After Testing (Top)
E) After Brushing (Bottom) F) After Brushing (Top)
G) After Washing (Bottom) H) After Washing (Top)
29
A) Before Testing (Bottom) B) Before Testing (Top)
C) After Testing (Bottom) D) After Testing (Top)
E) After Brushing (Bottom) F) After Brushing (Top)
G) After Washing (Bottom) H) After Washing (Top)
30
A) Before Testing (Bottom) B) Before Testing (Top)
C) After Testing (Bottom) D) After Testing (Top)
E) After Brushing (Bottom) F) After Brushing (Top)
G) After Washing (Bottom) H) After Washing (Top)
31
Figure 5.2-5 Measured Temperature-Time Curves for ½ in. Thick Part 2 Plate Specimens (Web)
Figure 5.2-6. Measured Temperature-Time Curves for ½ in. Thick Part 2 Plate Specimens (Flanges)
32
Table 5.2-1 Material Test Results for Coupons from Part 2 Plate Specimens
Specimen ID σy σu %e CVN results AVG Harndness Test AVG Penn DOT 5 KK (37)
Control
½ in. plate thickness (web)
Coupon 1 48.3 71.5 44 Inner 3 65 54 46 55.0 Top 75 74.5 75 74.8333 Coupon 2 45 71.5 40 Outer 3 65 34 37 45.3 Bottom 73.5 75 72.5 73.6667
Penn DOT 5 GG (33) 800°F ½ in. plate thickness (web)
Coupon 1 48.2 71.5 37 Inner 3 64 60 50 58.0 Top 75 73.5 75 74.5 Coupon 2 42.3 72.5 39 Outer 3 67 30 32 43.0 Bottom 76 76 71 74.3333 Penn DOT 5 II (35) 1200°F
½ in. plate thickness (web)
Coupon 1 47.8 71 41 Inner 3 50 60 64 58.0 Top 72.5 73 73 72.8333 Coupon 2 43.3 71.5 42 Outer 3 30 69 65 54.7 Bottom 69.5 73 75.5 72.6667
Penn DOT 5 LL (38) Control
½ in. plate thickness (flange)
Coupon 1 45.4 70.5 29 Inner 3 41 35 29 35.0 Top 70 68.5 70 69.5 Coupon 2 44.2 69 42 Outer 3 47 28 38 37.7 Bottom 67 67.5 68.5 67.6667
Penn DOT 5 JJ (36) 800°F ½ in. plate thickness (flange)
Coupon 1 43 70 39 Inner 3 38 25 34 32.3 Top 65 69 70.5 68.2 Coupon 2 41.8 68.5 41 Outer 3 38 27 48 37.7 Bottom 60 66 62 62.6 Penn DOT 5 HH (34) 1200°F
½ in. plate thickness (flange)
Coupon 1 42.8 67.5 46 Inner 3 10 21 30 20.3 Top 73 74 72.5 73.2 Coupon 2 39.6 66.5 46 Outer 3 48 25 34 35.7 Bottom 70.5 72 69.5 70.6
33
Figure 5.2-7. Statistical Analysis of CVN Fracture Toughness for Part 2 Plate Specimens (1/2 in. thick webs)
Figure 5.2-8. Statistical Analysis of CVN Fracture Toughness for Part 2 Plate Specimens (1/2 in. thick flanges) 0 10 20 30 40 50 60 70 80 control 800 1200 E nergy (f t-lbs) Quartile 1 Minimum Median Maximum Quartile 3
PennDOT 5 KK (37) PennDOT 5 GG (33) PennDOT 5 II (35)
0 10 20 30 40 50 60 control 800 1200 E nergy (f t-lbs) Quartile 1 Minimum Median Maximum Quartile 3
34 5.3 Post-Fire Evaluation of Plate Specimens – Part 31
Figures 5.3-1 to 5.3-8 show photographs of the post-fire evaluation of the plate specimens (Part 3) identified in Table 4.2-1 and listed below. These include photographs taken as described in Section 4.4.
Part Specimen ID Origin Type or Temperature
Description
3 Acrolon A (1) 800 W A709 800 F ½ in. thick plate
Flame jet and material tests 3 Acrolon B (2) 1000 W A709 1000 F ½ in. thick plate
Flame jet and material tests 3 Acrolon C (3) 1200 W A709 1200 F ½ in. thick plate
Flame jet and material tests 3 Acrolon D (4) Uncontrolled W A709 1200 F
uncontrolled
½ in. thick plate
Flame jet and material tests 3 Acrolon E (5) 800 F A709 800 F 1 in. thick plate
Flame jet and material tests 3 Acrolon F (6) 1000 F A709 1000 F 1 in. thick plate
Flame jet and material tests 3 Acrolon G (7) 1200 F A709 1200 F 1 in. thick plate
Flame jet and material tests 3 Acrolon H (8) Uncontrolled F A709 1200 F
uncontrolled
1 in. thick plate
Flame jet and material tests
Figures 5.3-9 and 5.3-10 show the measured temperature-time (T-t) curves for the ½ in. thick and 1 in. thick plate specimens, respectively. As shown the target temperatures of 800, 1000, and 1200 oF were achieved and maintained for 20 minutes before cooling. The uncontrolled fire test reached a maximum temperature of 1200 oF also, and was allowed to continue (burn out) for 40 minutes before cooling.
1
CVN tests for these specimens were delayed and not available at the time of report submission. An addenda and amended report will be issued with these data when they are available
35
A) Before Testing (Bottom) B) Before Testing (Top)
C) After Testing (Bottom) D) After Testing (Top)
E) After Brushing (Bottom) F) After Brushing (Top)
G) After Washing (Bottom) H) After Washing (Top)
36
A) Before Testing (Bottom) B) Before Testing (Top)
C) After Testing (Bottom) D) After Testing (Top)
E) After Brushing (Bottom) F) After Brushing (Top)
G) After Washing (Bottom) H) After Washing (Top)
37
A) Before Testing (Bottom) B) Before Testing (Top)
C) After Testing (Bottom) D) After Testing (Top)
E) After Brushing (Bottom) F) After Brushing (Top)
G) After Washing (Bottom) H) After Washing (Top)
38
A) Before Testing (Bottom) B) Before Testing (Top)
C) After Testing (Bottom) D) After Testing (Top)
E) After Brushing (Bottom) F) After Brushing (Top)
G) After Washing (Bottom) H) After Washing (Top)
39
A) Before Testing (Bottom) B) Before Testing (Top)
C) After Testing (Bottom) D) After Testing (Top)
E) After Brushing (Bottom) F) After Brushing (Top)
G) After Washing (Bottom) H) After Washing (Top)
40
A) Before Testing (Bottom) B) Before Testing (Top)
C) After Testing (Bottom) D) After Testing (Top)
E) After Brushing (Bottom) F) After Brushing (Top)
G) After Washing (Bottom) H) After Washing (Top)
41
A) Before Testing (Bottom) B) Before Testing (Top)
C) After Testing (Bottom) D) After Testing (Top)
E) After Brushing (Bottom) F) After Brushing (Top)
G) After Washing (Bottom) H) After Washing (Top)
42
A) Before Testing (Bottom) B) Before Testing (Top)
C) After Testing (Bottom) D) After Testing (Top)
E) After Brushing (Bottom) F) After Brushing (Top)
G) After Washing (Bottom) H) After Washing (Top)
43
Figure 5.3-9. Measured Temperature-Time Curves for ½ in. Plate Specimens with Acrolon coating (Part 3).
Figure 5.3-9. Measured Temperature-Time Curves for 1 in. Plate Specimens with Acrolon coating (Part 3).
44
Table 5.3-1 Material Test Results for Coupons from Part 3 Plate Specimens
Specimen ID σy σu %e CVN results AVG Hardness Test AVG Arcolon Q (17) Control W Coupon 1 57 82 35 Inner 3 Top 84 84 84 84.0
Coupon 2 58.5 83.5 39 Outer 3 Bottom 83 83 82 82.7
Arcolon A (1) 800 W Coupon 1 58.5 82.5 36 Inner 3 Top 84 84 85 84.3
Coupon 2 59.5 83 36 Outer 3 Bottom 84 85 84 84.3 Arcolon B (2) 1000 W Coupon 1 59.5 82 38 Inner 3 Top 84 84 85 84.3
Coupon 2 58 81.5 38 Outer 3 Bottom 86 86 85 85.7 Arcolon C (3) 1200 W Coupon 1 57.5 81 37 Inner 3 Top 85 85 84 84.7
Coupon 2 58 80.5 37 Outer 3 Bottom 84 84 83 83.7 Arcolon D (4) Uncontrolled W Coupon 1 58.5 81 36 Inner 3 Top 83 83 84 83.3
Coupon 2 58.5 81 34 Outer 3 Bottom 84 83 83 83.3
Arcolon R (18) Control F Coupon 1 56 80 44 Inner 3 Top 86 85 85 85.3
Coupon 2 57 80 51 Outer 3 Bottom 84 84 83 83.7
Arcolon E (5) 800 F Coupon 1 56.5 80.5 50 Inner 3 Top 86 85 85 85.3
Coupon 2 56.5 80.5 49 Outer 3 Bottom 84 84 83 83.7 Arcolon F (6) 1000 F Coupon 1 57 80.5 50 Inner 3 Top 84 85 84 84.3
Coupon 2 57 80.5 50 Outer 3 Bottom 86 86 85 85.7 Arcolon G (7) 1200 F Coupon 1 58 80.5 44 Inner 3 Top 82 83 83 82.7
Coupon 2 58 80.5 44 Outer 3 Bottom 83 83 83 83.0 Arcolon H (8) Uncontrolled F Coupon 1 59.5 80 50 Inner 3 Top 85 85 86 85.3 Coupon 2 59.5 80.5 48 Outer 3 Bottom 84 84 84 84.0
45 5.4 Post-Fire Evaluation of Plate Specimens – Part 42
Figures 5.4-1 to 5.4-6 show photographs of the post-fire evaluation of the plate specimens (Part 4) identified in Table 4.2-1 and listed below. These include photographs taken as described in Section 4.4.
Part Specimen ID Origin Type or Temperature
Description
4 Carbothane I (9) 1000 W A709 1000 F ½ in. thick plate
Flame jet and material tests 4 Carbothane K (11) 1200 W A709 1200 F ½ in. thick plate
Flame jet and material tests 4 Carbothane L (12) Uncontrolled W A709 1200 F
uncontrolled
½ in. thick plate
Flame jet and material tests 4 Carbothane M (13) 800 F A709 800 F 1 in. thick plate
Material tests only 4 Carbothane O (15) 1200 F A709 1000 F 1 in. thick plate
Flame jet and material tests 4 Carbothane P (16) Uncontrolled F A709 1200 F
uncontrolled
1 in. thick plate
Flame jet and material tests
Figures 5.4-7 and 5.4-8 show the measured temperature-time (T-t) curves for the ½ in. thick and 1 in. thick plate specimens, respectively. As shown the target temperatures of 800, 1000, and 1200oF were achieved and maintained for 20 minutes before cooling. The uncontrolled fire test reached a maximum temperature of 1200oF also, and was allowed to continue (burn out) for 40 minutes before cooling.
2
CVN tests for these specimens were delayed and not available at the time of report submission. An addenda and amended report will be issued with these data when they are available
46
A) Before Testing (Bottom) B) Before Testing (Top)
C) After Testing (Bottom) D) After Testing (Top)
E) After Brushing (Bottom) F) After Brushing (Top)
G) After Washing (Bottom) H) After Washing (Top)
47
A) Before Testing (Bottom) B) Before Testing (Top)
C) After Testing (Bottom) D) After Testing (Top)
E) After Brushing (Bottom) F) After Brushing (Top)
G) After Washing (Bottom) H) After Washing (Top)
48
A) Before Testing (Bottom) B) Before Testing (Top)
C) After Testing (Bottom) D) After Testing (Top)
E) After Brushing (Bottom) F) After Brushing (Top)
G) After Washing (Bottom) H) After Washing (Top)
49
A) Before Testing (Bottom) B) Before Testing (Top)
C) After Testing (Bottom) D) After Testing (Top)
E) After Brushing (Bottom) F) After Brushing (Top)
G) After Washing (Bottom) H) After Washing (Top)
50
A) Before Testing (Bottom) B) Before Testing (Top)
C) After Testing (Bottom) D) After Testing (Top)
E) After Brushing (Bottom) F) After Brushing (Top)
G) After Washing (Bottom) H) After Washing (Top)
51
A) Before Testing (Bottom) B) Before Testing (Top)
C) After Testing (Bottom) D) After Testing (Top)
E) After Brushing (Bottom) F) After Brushing (Top)
G) After Washing (Bottom) H) After Washing (Top)
52
Figure 5.4-7. Measured Temperature-Time Curves for ½ in. Thick Carbothane Plates (Part 4).
53
Table 5.4-1 Material Test Results for Coupons from Part 4 Plate Specimens
Specimen ID σy σu %e CVN results AVG Harndness Test AVG
Carbothane J (10) Control W Coupon 1 - - - Inner 3 Top 87 86 87 86.7 Coupon 2 - - - Outer 3 Bottom 87 88 87 87.3
Carbothane I (9) 1000 W Coupon 1 58.5 79 40 Inner 3 Top 85 85 86 85.3 Coupon 2 58.5 79.5 39 Outer 3 Bottom 86 86 85 85.7 Carbothane K (11) 1200 W Coupon 1 59.5 77.5 42 Inner 3 Top 83 82 83 82.7 Coupon 2 59.5 79 41 Outer 3 Bottom 93 83 83 86.3 Carbothane L (12) Coupon 1 60 77.5 43 Inner 3 Top 83 84 83 83.3 Uncontrolled W Coupon 2 59 78 41 Outer 3 Bottom 83 84 84 83.7 Carbothane M (13) 800 F Coupon 1 57.5 82.5 47 Inner 3 Top 87 88 87 87.3 Coupon 2 57.5 82 50 Outer 3 Bottom 85 85 86 85.3 Carbothane O (15) 1200 F Coupon 1 59 81.5 49 Inner 3 Top 85 84 85 84.7 Coupon 2 59 51.5 46 Outer 3 Bottom 84 85 85 84.7 Carbothane P (16) Coupon 1 59 81.5 47 Inner 3 Top 84 85 84 84.3 Uncontrolled F Coupon 2 60.5 82 47 Outer 3 Bottom 83 84 84 83.7
54
5.5 Findings and Conclusions from Post-Fire Evaluations
The post-fire evaluation photographs shown in Section 5.1-5.4 indicate that:
Controlled fire exposures producing steel surface temperatures of 800 °F caused bubbles in the paint surfaces of the decommissioned bridge plates (Parts 1 and 2) and Acrolon coated (Part 3) plates. In some cases these bubbles had popped but the general shape (outline) remained. After brushing the plates, the spots where bubbles were located could still be seen on the surfaces of the plates. Controlled fire exposures producing surface temperatures of 800 °F caused cracking in the paint surfaces of the Carbothane coated plates. A clean gray surface was revealed after brushing and washing the fire exposed plates. It should also be noted that the old paint coatings (on decommissioned bridges) burned off completely, where as the primer coat of the three coat systems remained intact.
For Acrolon coated plates (Part 3) subjected to controlled fire exposures producing steel surface temperatures of 1000 °F, all the bubbles that had formed in the paint surface had popped and cracked to form a desiccated pattern over the steel surface. Even after washing, the spots where the bubbles existed in the paint system could still be seen on the steel surfaces. The Carbothane coated plates (Part 4) remained cracked and continue to reveal the clean gray surface after brushing and washing. It should also be noted that the old paint coatings (on decommissioned bridges) burned off completely, whereas the primer coat of the three coat systems remained intact.
For the old coatings and the Acrolon coated plates exposed to controlled or uncontrolled fires causing surface temperatures of 1200 °F, all the bubbles in the paint surface had popped and cracked leaving a faint pattern over the steel surface. After brushing and washing the plates, the spots were the bubbles existed could still be seen very lightly over the steel surface. It should also be noted that the old paint coatings (on decommissioned bridges) burned off completely, whereas the first (primer) coat of the Acrolon system remained intact. The Carbothane paint system starts to flake off after sustaining uncontrolled burns.
The post-fire material test results and comparisons with material properties from control specimens indicate that:
Fire exposures have only a minor effect on the steel yield strength, ultimate strength, and elongation at rupture, and surface hardness. This is irrespective of the steel surface temperature and duration and steel plate thickness.
Fire exposures have only a slight reduction in the CVN fracture toughness values for the steels. This reduction is slightly larger for thicker steels, but more material test results are needed to verify / confirm this finding.
Fire exposure does not have a statistically significant effect on the CVN fracture toughness of steels, which will continue to numerically satisfy the 15 ft-lb limit for Zone 2 if the control specimen satisfies it.
55 6.0 SUMMARY AND CONCLUSIONS
The experimental investigations were conducted on steel plates (with three-coat paint systems ) using a unique flame jet test-setup with a sooting flame and ethylene fuel. The steel plates were exposed to different fire exposure times of 20 – 40 minutes, and the maximum surface temperatures achieved on the plates were around 1200 oF. As expected, the steel surface temperatures were lower than the flame maximum temperature due to expected thermal losses to the ambiance etc.
Standard ASTM material tests were conducted on coupons taken from the fire exposed steel plates, and used to evaluate the effects of fire exposure on the material properties. The material test results shows that up to steel surface temperatures of 1200 oF, the fire exposed material will satisfy any of the required AASHTO material specifications as long the virgin (or unexposed) material was also satisfying the same specification before fire exposure.
Repair strategies in these cases would require that the fire exposed bridge be brushed clean, pressure washed, and re-painted.
However, when the bridge is visibly distorted (several inches or feet) by the fire it usually implies that the steel surface temperatures exceeded 1200 oF during the fire causing significant (more than 60%) loss in stiffness (elastic modulus) and strength. Repair strategies for these bridges may require heat straightening (if the distortion is only a few inches) or complete replacement of the distorted sections or girders (if the distortion is several feet).
The inspection guide shown in the following section is based on the experimental investigations presented in this report. It is limited to maximum steel surface temperatures of 1200 oF with minor distortions and permanent deformations after the fire. It is expected that there will be excessive distortions or deformations when the steel surface temperatures significantly exceed 1200 oF, and the corresponding section will just have to be replaced.