Commentary
w w w . c d h o w e . o r g N o . 2 3 9 , S e p t e m b e r 2 0 0 6 I S S N 0 8 2 4 - 8 0 0 1
Jack M. Mintz
In this issue...
A new, broadened international survey shows that Canada has the
eighth highest effective tax rate on capital among 81 countries. Our
sta-tus as a high-tax nation raises concerns about the tax system’s effects on
labour, investment and saving. A Pro-Growth Tax Reform plan is
urgently needed.
The 2006 Tax
Competitiveness
Report:
Proposals for Pro-Growth
Tax Reform
The 2006 Tax Competitiveness Report provides a window on how Canada’s tax system ranks against the international competition. While the federal and provincial governments have made progress in reducing marginal income tax rates, the pace of tax reform has been slow, compared to some other developed countries, like Australia, Finland, Ireland and the Netherlands. Several Nordic countries have implemented significant reforms through “dual-income tax systems“ that treat labour and investment income differently.
Meanwhile, Canada’s productivity growth has been slow, and so has income growth. In the years to come, achieving better growth may pose stiff challenges, as population aging begins to pinch labour markets, making capital investment all the more important.
Canada will need to pay attention to its effective tax rate on investment. As this report shows, our marginal rate remains high, and stands at 8th highest among the 81 developed and developing economies we studied. This report therefore proposes a Pro-Growth Tax Reform plan that would improve how taxes treat people and their work effort, and how taxes treat savings and investment. Among other reforms, it proposes five immediate priorities:
• Lowering clawback rates for income-tested benefits to achieve lower marginal rates for low-income
earners and seniors.
• Increasing the limits for contributions to pension and RRSP plans, most importantly raising the
maximum age from 69 to 73 years and the earned income limit from 18 to 25 percent. Limits for deductions to RRSPs or a new Tax Pre-Paid Saving Plan would be increased from $22,000 to $32,000 by 2010.
• Increasing the tuition fee and education tax credit from about 23 to 40 percent and doubling the
amounts transferred to a parent or eligible guardian.
• A further reduction in corporate income tax rates at federal level from 19 to 15 percent by 2010, as well
as action to better match capital cost allowances and economic depreciation rates for assets.
• Removing the withholding tax on arm’s length interest and, in the case of the US-Canada treaty, the
withholding tax on non-arm’s length interest.
Further, provincial governments should aim to lower their marginal tax rates on work, saving and investment, particularly capital taxes on businesses and sales taxes on business intermediate purchases and capital goods. Both federal and provincial governments should also pursue base-broadening measures, such as removing ineffective tax credits, helping offset the revenue cost of tax relief.
The Author of This Issue
Jack M. Mintzis Professor of Business Economics, Rotman School of Management, University of Toronto,
and Fellow-in-Residence, C.D. Howe Institute.
* * * * * *
C.D. Howe Institute Commentary©is a periodic analysis of, and commentary on, current public policy issues. James Fleming edited the manuscript; Diane King prepared it for publication. As with all Institute publications, the views expressed here are those of the author and do not necessarily reflect the opinions of the Institute’s members or Board of Directors. Quotation with appropriate credit is permissible.
To order this publication please contact: Renouf Publishing Company Limited, 5369 Canotek Road, Ottawa, Ontario K1J 9J3; or the C.D. Howe Institute, 67 Yonge St., Suite 300, Toronto, Ontario M5E 1J8. The full text of this publication is also available on the Institute’s website at www.cdhowe.org.
$12.00; ISBN 0-88806-696-1
T
he 2006 Tax Competitiveness Report provides a snapshot of howCanada’s tax system affects labour, investment and saving, which are all critical to prosperity in the future. While federal and provincial
governments have made some progress in reducing high marginal tax rates on incomes, the pace of tax reform has been too slow over the years and far less dramatic than in some countries like Australia, Finland, Ireland and the Netherlands. Canadian federal and provincial governments are not sufficiently concerned about tax reform, even though economic restructuring is fundamentally altering the world’s commerce. As business activity increases in Asia, industrial countries, including Canada, must cope with increased competition from abroad as well as with aging populations within. Tax reform is urgent.
Even the latest federal reforms, which have included introducing or expanding special preferences and reducing the GST rate from 7 to 6 percent, are out-of-step
with the general drift to remove taxes on income in favour of consumption taxes.1
Canadians, especially those with modest and low incomes, face very high marginal tax rates on employment income and saving. As documented below, Canada has the sixth highest effective tax rate on capital investment among 36 industrialized and leading developing countries, as well as the eighth highest effective tax rate on capital when a further 45 developing countries are included in the comparison.
The lack of tax competitiveness is a serious issue since it makes it difficult for Canada to achieve stellar economic growth in the face of labour shortages and low investment rates in many industries. For this reason, this report urges major structural changes in Canada’s tax system through a Pro-Growth Tax Reform Plan that would improve both efficiency and fairness in the tax system. The plan would encompass cuts to high marginal tax rates and introduce a more neutral,
simplified approach by removing the tax penalty on saving and eliminating preferences for specific activities. One approach to consider is the adoption of a version of the Nordic “dual income tax,“ with a sharp reduction in taxes on interest, dividends, capital gains and corporate income to a combined federal-provincial rate of 23 percent. While this is an attractive idea, the approach needs more careful study.
Although a number of recommendations are made for reforms, five fiscally responsible tax reforms could be easier priorities for now at the federal level. These include the following:
* I wish to thank Duanjie Chen, Tina Lee and Finn Poschmann for their assistance with tables and graphs. I am grateful for the many comments received from members of the Tax Competitiveness Council at the C.D. Howe Institute that helped improve the content of the paper, especially from Richard Bird, Yvan Guillemette, Jon Kesselman, John Lester, Bill Molson, Finn Poschmann and Bill Robson. Support for the multi-country comparison of effective tax rates on capital was provided by the Foreign Investment Advisory Service, the World Bank, and Deloitte & Touche, which is gratefully acknowledged.
1 If federal sales tax cuts were used as part of a policy to encourage provinces to convert their retail sales taxes into value-added taxes, typically found in most countries, the reductions could provide a happier outcome in terms of overall tax reform. A further cut in the federal GST from 6 to 5 percent will perhaps help accommodate provincial sales tax reforms.
• The pooling of clawback rates for income-tested benefits to achieve lower marginal rates for low-income earners and seniors.
• Increasing the limits for contributions to pension and RRSP plans, most
importantly raising the maximum age from 69 to 73 years and the earned income limitation from 18 to 25 percent. Limits for deductions to RRSPs or a new Tax Pre-Paid Saving Plan should be increased from $22,000 to $32,000 by 2010.
• Increasing the tuition fee and education tax credit from about 23 to 40
percent and doubling the amounts transferred to a parent or eligible guardian.
• A further reduction in corporate income tax rates at the federal level from
19 to 15 percent by 2010, as well as action to better match capital cost allowances and economic depreciation rates for assets.
• Removing the withholding tax on arm’s length interest and, in the case of
the US-Canada treaty, the withholding tax on non-arm’s length interest. Provincial governments should aim to lower their marginal tax rates on work, saving and investment, particularly with respect to capital taxes on businesses and sales taxes on business intermediate purchases and capital goods. Both federal and provincial governments should also consider several recommended
base-broadening measures that would remove ineffective tax credits, thereby helping to cover the cost of tax cuts.
The Challenge of Economic Growth
Although employment has improved since 1997, increasing annually by 1.6
percent in terms of hours worked, growth in per capita output has been mediocre. Canada’s labour productivity (output per worker) grew by a paltry 1.6 percent annual rate from 2000 to 2004, compared to 3.6 percent in the United States. There, Americans have experienced an overall decline in hours worked (Statistics Canada 2005). Low growth in output per worker translates into a poor performance in Canada’s standard of living. Canada’s growth in per capita GDP has been 24th best of 29 OECD countries (Poschmann 2006). Canadian GDP per capita remains almost US$6,500 per capita below that in the US, which for a family of four individuals implies a differential of $26,000 in income.
If anything, the challenge to achieve better economic growth will be even more difficult in the future. More Canadians will retire as the population ages, making labour shortages potentially greater (Bourgeois and Debus 2006). While Canada will continue to rely on immigration to help grow its labour force, it takes time and cost to integrate immigrants so that they can achieve their full earning potential. Businesses will continue to shift manufacturing and service production to Asia where wage costs are much lower, leaving industrialized countries like Canada the challenge of ensuring their place in worldwide supply chains. Security concerns and protectionism, as reflected in the failed Doha round for trade
liberalization, make it more attractive for businesses to locate in large markets like China, the European Union and the United States, rather than in a smaller country
like Canada, beset with border frictions arising from tariffs, quotas and immigration laws.
Fortunately, a mix of policies can generate higher economic growth through better use of labour and capital resources. Economic polices that encourage greater labour supply, better education and training, infrastructure, capital investment, and the adoption of new technologies can all contribute to better economic performance (Mintz 2001). Canada has had a relatively successful record in many respects, such as improving its quality of education and building good
infrastructure, especially transportation and communication networks. However, one area of poor performance has been with respect to capital investment flows. In Canada, capital investment has been $3,200 and $1,400 per worker less this year than in the United States and the OECD, respectively (Robson and Goldfarb 2006). Without strong business investment, Canada’s growth is restrained, making it more difficult to innovate, create better-paying jobs and provide the resources needed to support retirement and cover contingencies. The cuts in corporate taxes alone, implemented by federal and provincial governments in 2006, will boost capital investment by $45 billion in the next five years (Chen and Mintz 2006), increasing Canadian incomes by over $4.5 billion annually.
As discussed in more detail below, taxation reduces economic gains from work, investment, saving and risk-taking, thereby undermining a country’s overall competitiveness. Non-neutral tax policies that are unevenly applied to various activities encourage Canadians to devote resources to less-taxed activities, rather than to those that generate the greatest economic returns. High marginal tax rates on those who choose to work or improve their skills discourage labour supply and training. Taxes on capital investment and saving reduce the ability of Canadians to create sufficient wealth to fund their future needs.
The Current Picture
Taxing People
Canadian federal and provincial governments levy substantial income, payroll, consumption and other taxes as well as pay out transfers that affect the amount of goods and services that Canadians can buy, either today or, through their savings, in the future. In 1975, the per capita personal income (prior to the payment of taxes and receipt of government transfers) was equal to about $6,000 and per capita disposable income (income net of taxes and including government
transfers) was equal to $4,900, implying a net tax equal to $1,100 per person, or 18 percent of income. Thirty years later, the average personal income of a Canadian is about $31,500 and disposable income is equal to $24,100 (unadjusted for inflation). Taxes net of income transfers as a percentage of personal income are now 24 percent, one-third more than in 1975. This increase reflects the growth of
government spending on goods and services during the period, despite the fact that many public programs such as Medicare and education were already in place by 1975. Given the rise of both tax levels and transfers, economic distortions
associated with them are therefore even more important today than three decades ago.
The increase in disposable per capita incomes over the last 40 years has been due in part to inflation, which once removed, measures the growth of both real personal income per capita and real personal disposable income per capita over time (Figure 1). In 1975, disposable personal income was equal to $14,200 (in 1992 dollars), rising by almost a third to $18,900 (also in 1992 dollars) in 2005. During this period, government spending increased from 40 percent of GDP to over 50 percent by 1992, falling back to about 41 percent today. Total government tax and non-tax revenues grew from about 37 percent in 1975, peaking at 44 percent in 2001, and declining to about 41 percent today.
Even with better fiscal policies in place, as reflected in the slaying of the federal and most provincial deficits, growth in personal incomes and disposable
incomes has been mediocre in the last five years.2In inflation-adjusted terms, both
measures have risen by only $600 per capita from 2001 to 2005, as seen in Figure 1, because taxes net of transfers have remained high as a share of personal incomes. The lack of solid economic growth has therefore affected both people and
governments — neither the private nor public sectors are gaining resources in per capita terms to spend on tangible private and public services (the latter would
Figure 1: Canadian Real Per Capita Personal Income and Personal Disposable Income
12,000 14,000 16,000 18,000 20,000 22,000 24,000 26,000 1975 1976197 7 1978 197919801981 19821983198 4 1985 1986198 7 1988 1989 19901991 19921993199 4 1995 1996199 7 1998 1999 20002001 20022003200 4 2005
Real Personal Income Per Capita Real Personal Disposable Income Per Capita
Source: Statistics Canada, CANSIM.
2 Greater government spending in the past several decades has been accompanied by little change in economic equality as measured by the Gini co-efficient based on after-tax income, inclusive of transfers. (See Mintz 2001.)
1992 Canadian Dollars
include spending by governments on goods and services, but not money transfers like social assistance which are netted from taxes). Thus, inadequate economic growth has important ramifications since it impedes individuals from buying consumer goods and services, and governments from having more money to spend on important public services like education, health and infrastructure. Much more dramatic public policy is needed to improve opportunities for economic growth.
Taxing Work
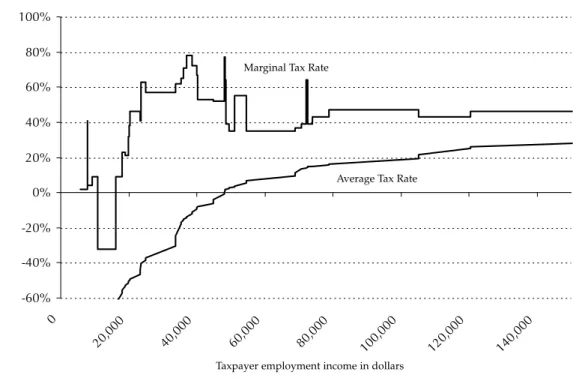
Taxation discourages effort when workers are faced by high marginal tax rates — additional taxes paid on income earned from one more hour worked — that reduce the financial reward for choosing to take on extra work. As shown in the Figures 2(a) and 2(b) for Ontario and flat-tax Alberta, marginal tax rates approach 80 percent for incomes around $37,000 in both provinces. They rarely fall below 60 percent for incomes between $28,000 and $50,000 in Ontario and between $30,000 to $40,000 in Alberta. Marginal tax rates are high due to the combined effect of personal income taxes, payroll tax (EI and CPP) and clawbacks of federal and provincial income-tested programs.
High marginal tax rates reduce the incentive to work by encouraging people to cut back their hours employed in favour of more untaxed leisure or home
production, although this is offset in part by the desire to work harder as a result of having less after-tax pay to spend on goods and services. A recent paper using “meta-analysis,“ bringing together 239 results from studies around the world, suggested that a 10 percent increase in the after-tax wage rate encourages a 1 to 2 percent increase in hours worked by men and a 5 percent increase in hours worked by married women (de Mooij, Evers and van Vuuren 2006). Higher income can also motivate workers to put in more effort for the time they work, a factor which is difficult to observe, especially for entrepreneurs.
High marginal tax rates also encourage individuals to take on tax-planning
activities to avoid tax or to illegally report income.3Recent Canadian analysis on
the sensitivity of reported income to marginal tax rates tends to show that reported income can be quite sensitive to tax cuts, especially for self-employed individuals who have the ability to plan taxes and even evade them (Sillamaa and Veall 2001). Estimates suggest that for employees less than 65 years of age, a 10 percent reduction in marginal tax rates causes only an 8 percent increase in reported income, while for self-employed people, taxable income rises by 13
percent.4Reactions also vary across income groups and age, with high-income,
younger individuals earning more than $100,000 increasing reported income by 17 percent and the high-income elderly increasing reported income by 32 percent in response to a 10 percent decrease in marginal tax rates. Sillamaa and Veall (2001) argue that the top revenue-maximizing marginal tax rate is 45 percent, certainly
3 The tax base can increase due to tax cuts reflecting tax avoidance, tax evasion or simply more hours worked or investment.
4 The increased reporting of employment and self-employment income with cuts in marginal tax rates also reflects a shift in the tax base amongst different sources of income.
Figure 2a:Average and Marginal Effective Tax Rates for a Couple with Two Children in Ontario in 2007 allowing for GST and other Refundable Credits
-60% -40% -20% 0% 20% 40% 60% 80% 100% 0 20,000 40,000 60,000 80,000 100,000 120,000 140,000
Source: Source: Finn Poschmann, C.D. Howe Institute, via Statistics Canada’s Social Policy Simulation Database and Model, Release 14.1
Figure 2b:Average and Marginal Effective Tax Rates for a Couple with Two Children in
Alberta in 2007 allowing for GST and other Refundable Credits
-60% -40% -20% 0% 20% 40% 60% 80% 100% 0 20,000 40,000 60,000 80,000 100,000 120,000 140,000
Source: Source: Finn Poschmann, C.D. Howe Institute, via Statistics Canada’s Social Policy Simulation Database and Model, Release 14.1
A
verage and mar
ginal tax rate (per
cent)
Taxpayer employment income in dollars
A
verage and mar
ginal tax rates (per
cent)
Taxpayer employment income in dollars Marginal Tax Rate
Average Tax Rate
Marginal Tax Rate
well below some of the marginal tax rates once taking into account clawbacks, payroll and sale taxes that impact on overall tax levels.
Such high marginal effective tax rates on income also deter people from investments in education that improve their future earnings, counteracting the effect of government subsidies on education (Mintz 2001, Collins and Davies 2005). While governments have provided significant subsidies towards education, they have undermined their programs with a tax system that takes away the benefits of acquiring more knowledge. Tuition and education costs reduce tax payments of students or their parents by about one quarter. Yet, education
improves incomes that are taxed in later years at marginal rates almost double the marginal rate for tax credits. The income tax system therefore penalizes the
acquisition of education, countering the impact of subsidies.
The steep increase in average tax rates (taxes divided by income received), which rise to almost 33 percent on $30,000 of income, also significantly deters some from participating in the labour force. When average tax rates are high at low income levels, individuals may prefer to stop work altogether, opting instead for EI benefits or untaxed provincial welfare benefits. Alternatively, they may choose to participate in the underground economy to avoid paying tax or take more leisure (which is one gainful activity that is untaxed).
Given the increased labour shortages appearing in many parts of Canada, the steeply rising average and marginal tax rates should set off alarm bells for
politicians to look more deeply at taxation with a view to encouraging greater labour supply.
Taxing Saving
Under the current tax system, income earned from saving is fully taxed in the case of interest and rental income. Dividends are taxed at a lower personal rate because individuals receive a tax credit to offset the corporate tax on profits prior to the distribution of profit. Only one-half of capital gains are subject to personal
taxation, bringing the tax rate on capital gain realizations close to the dividend tax rate. (The one-half exclusion roughly recognizes that business taxes have already been levied on the reinvested profits that cause share values to rise.) Further, investors are able to earn tax-exempt income by investing in pension plans or registered retirement savings plans (RRSPs) on a limited basis. Individuals may also pay no taxes levied on income derived from investments in owner-occupied
principal residences5that are subject to property tax at the provincial or municipal
level.
Canadians who wish to save for their retirement and other contingencies face quite extraordinarily high tax rates on their investments, unless they are able to shelter their income from taxation through pension plans or RRSPs. Even if the amount by which Canadians save is fixed, taxes on investment income reduce the accumulation of wealth simply by lowering the yield that investors receive from
5 In principle, under a comprehensive income tax, homeowners would pay tax on “imputed” rental income that would be a charge to them for leasing a house. The carrying costs of owning the home would be deducted. Several European countries have used this approach for taxing housing under their income tax.
their investments. For example, for a person needing money in 20 years at
retirement time, a 40 percent tax rate on the return on investments (assumed equal to 5 percent), reduces the amount of capital available for retirement after 20 years by 33 percent, in current dollars, and by close to 55 percent, once adjusting for 2 percent inflation. With inflation and taxes, some investors earn a return on their saving that actually reduces the purchasing power of their initial investment — a government bond yielding a 4 percent return, subject to a tax rate of 60 percent, provides a yield of -0.4 percent, once adjusting for 2 percent inflation. When taxes eliminate investment income earned altogether, once adjusted for inflation, the punitive tax rates lead to effective wealth expropriation.
While it is important to keep in mind that taxes lower the amount of wealth available at retirement, they also influence the income Canadians are willing to invest rather than consume. Taxes that reduce the return on saving are unfair to savers who pay more tax over their lifetime than those who consume their earnings immediately. A tax on saving increases the price of future consumption relative to current consumption because investors are rewarded less for their
willingness to postpone consumption to future dates.6Various economic studies
have shown that a 10 percent increase in the return on savings would increase saving by only 4 percent (Engen, Gravelle and Smetters 1997). However, even if saving behaviour may not be too responsive to taxes, the reduction in the
accumulation of wealth for retirement purposes remains substantial given the tax imposed on investment income, unadjusted for inflation.
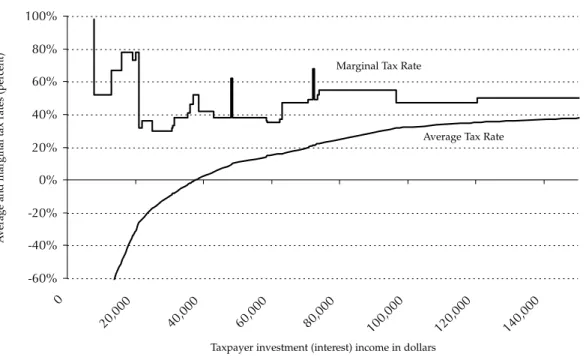
Sadly, marginal tax rates on taxable income from saving, totalling $38 billion in 2002 with roughly one-third earned by those with income less than $50,000 per
year,7are exceptionally high (Figures 3(a) and 3(b)). Federal and Ontario
combined marginal tax rates on investment income rarely dip below 40 percent while federal-Alberta tax rates more typically range from 30 to 40 percent due to the Alberta low-rate provincial flat tax. However, marginal tax rates reach 80 percent for seniors with modest incomes of $15,000, both in Ontario and flat-tax Alberta. Even though Canada has developed a better tax system for seniors in recent years, this potential expropriation of wealth at high marginal tax rates is a blot on the tax system for seniors trying to keep up with inflation.
With pension plans and RRSPs, Canadians can avoid punitive tax rates on their investment income since they need not pay tax on income accruing in the
6 On the other hand, taxes also reduce income available for current and future consumption and therefore encourage people to save more to make up for the loss of future consumption. Target savers looking for a particular level of retirement income could increase savings with higher taxes on investment income since they need more investments to make up for the loss in income. 7 See Income Statistics 2004, Taxable Returns by Income Classes, at www.cra.gc.ca. Taxable income on saving includes $19 billion in taxable dividends (adjusted downward to reflect the gross-up of 125% on dividends), $14 billion in investment income, $3 billion in rental income and $7 billion in taxable capital gains. Amounts were reduced by interest and carrying charges of $3 billion and $2 billion in the capital gains deduction. The amount of net investment, rental and taxable capital gain income earned by those with income less than $50,000 is about $12 billion, roughly one-third of the total net income earned on saving. A puzzle is why so much income from saving is subject to tax when, at the same time, many Canadians do not fully exhaust the contribution room they have to contribute to pension and RRSP accounts. In part, this arises from a desire for more liquidity (since withdrawals are fully taxed if they are needed) and avoiding high marginal tax rates at certain points during their life.
Figure 3a:Average and Marginal Effective Tax Rates for Single Senior in Ontario in 2007, allowing for GST and other Refundable Credits
-60% -40% -20% 0% 20% 40% 60% 80% 100% 0 20,000 40,000 60,000 80,000 100,000 120,000 140,000
Source: Source: Finn Poschmann, C.D. Howe Institute, via Statistics Canada’s Social Policy Simulation Database and Model, Release 14.1
Figure 3b:Average and Marginal Effective Tax Rates for Single Senior in Alberta in 2007,
allowing for GST and other Refundable Credits
-60% -40% -20% 0% 20% 40% 60% 80% 100% 0 20,000 40,000 60,000 80,000 100,000 120,000 140,000
Source: Source: Finn Poschmann, C.D. Howe Institute, via Statistics Canada’s Social Policy Simulation Database and Model, Release 14.1
A
verage and mar
ginal tax rates (per
cent)
Taxpayer investment (interest) income in dollars
A
verage and mar
ginal tax rates (per
cent)
Taxpayer investment (interest) income in dollars Marginal Tax Rate
Average Tax Rate
Marginal Tax Rate
plan. In 2003, about 8 million taxpayers contributed almost $47 billion to pension plans and RRSPs (Canada Revenue Agency). They do pay tax upon withdrawals of interest and principal but they also reduce their taxes when contributing to the plans. So long as the tax rates at times of withdrawal and contribution are the same, the time value of taxes paid on withdrawals is equal to the tax savings on contributions. As Shillington (2003) has demonstrated, however, many low-income seniors suffer extraordinarily high taxes on the returns from their RRSPs or
pensions since the claw back of senior benefits, including the Guaranteed Income Supplement, results in much higher taxes paid on withdrawals relative to the tax savings achieved by making contributions to plans prior to retirement.
Further, many older and upper-middle income Canadians are limited by law when seeking to invest in tax-sheltered savings. Some individuals would like to save more to ensure they have a similar standard of living upon retirement. However, they are unable to contribute more than the limits that are allowed for deductions from income for tax-sheltered savings (the 2006 limits are the least of 18 percent of earned income or $18,000, with the latter rising to $22,000 by 2010). The earned income limitation may make it difficult to achieve their lifetime objectives for retirement income because they are less able to over-save in the good years to make up for bad years in which the 18 percent limitation might apply to their circumstances. Those who are 69 or over — and still need to save for their longer expected lives or to leave some capital to heirs — are altogether
unable to shelter savings from taxation.
While Canada has built up a good system to encourage the accumulation of wealth for retirement purposes, the existing tax system is highly unfavourable to saving that is unsheltered from taxation. The system also limits individuals, in a number of ways, from fully accessing the pension and RRSP system to avoid payment of tax on investment income.
Taxing Investment
Business taxes, in the form of levies on corporate income, assets, net worth, purchases of machinery, structures and their components and security trades, lower the return on capital and, hence, the attractiveness of investments. Taxes on capital investments have the most powerful effect on Canada’s productivity — the ability to produce more with the same resources — compared to all other taxes. Without business investment, companies will not be able to improve wages paid to workers since less production is forthcoming from their efforts. More
importantly, businesses fail to adopt new innovative technologies to improve their products or processes if they do not invest in capital.
As in the 2005 Tax Competitiveness Report, we provide a ranking of 36 industrialized and leading developing economies in terms of their effective tax rates applied to capital investments of multinational corporations. We also provide a ranking of 45 additional developing countries.
The effective tax rate is a summary measure indicating the amount of tax paid as a percentage of the pre-tax returns on investment. The measure is based on the assumption that the amount of capital stock invested in an industry is determined by businesses maximizing their stock market values when investing in machines,
structures, land and inventory. Investment is determined at the level where the risk-adjusted rate of return on capital is at least equal to the cost of capital (Mintz 1995). For example, if the risk-adjusted rate of return to capital is 10 percent, a 40 percent effective tax rate on capital reduces the rate of return on capital to 6 percent. If businesses require at least a 6 percent rate of return (net of risk) to compensate investors for their willingness to invest in the business, then the company will be willing to undertake a new capital project. If the risk-adjusted return on projects is less than its cost of capital of 6 percent — say due to taxation — the project will be rejected.
Our calculations take into account corporate income taxes, capital taxes, sales taxes on capital purchases and other capital-related charges like stamp duties, turnover taxes and security transaction taxes for various countries. We assume that businesses must earn a rate of return on capital sufficient to cover an
international cost of finance, based on the typical returns required by G-7 country investors who are indifferent to holding bond and stock assets, after adjusting for risk and personal income taxes. Investments in each country are assumed to have the same structure of assets, economic depreciation rates and risk-adjusted real rates of return as in Canada. Differences across countries only reflect tax parameters and rates of inflation (that affect nominal interest rates across
countries).8
Economic studies have been quite conclusive in recent years in showing that business taxes significantly affect investment in a country. One recent paper suggests a 10 percent reduction in the cost of capital can increase investment in machinery and equipment by 10 percent in Canada (Iorwerth and Danforth 2004). McKenzie (2005) finds that a 10 percent increase in the incremental cost of
production, inclusive of taxes related to capital and labour, reduces manufacturing establishments by 3 percent. More powerful results have been obtained by studies on foreign direct investment, showing that a 1 percent reduction in the effective tax rate on capital can increase foreign direct capital stock by about 3.3 percent (de Mooij and Enderveen 2003).
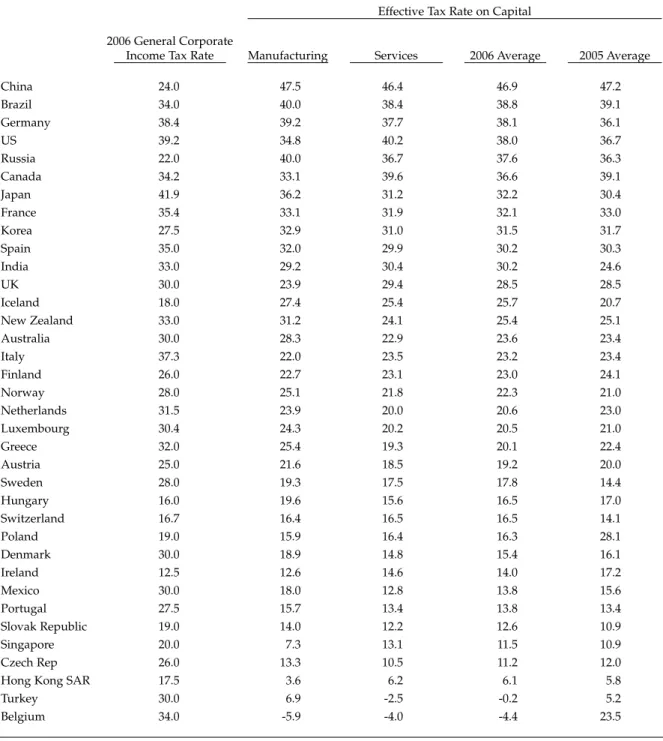
As shown in Table 1a, Canada’s effective tax rate on capital is sixth highest among industrialized and leading developing economies, following China, Brazil, Germany, Russia and the United States. While this is an improvement over 2005 when Canada had the second highest effective tax rate on capital among 36
countries, progress is slow, certainly nothing dramatic compared to Irish or Nordic progress due to tax reforms in recent years (to be further discussed below).
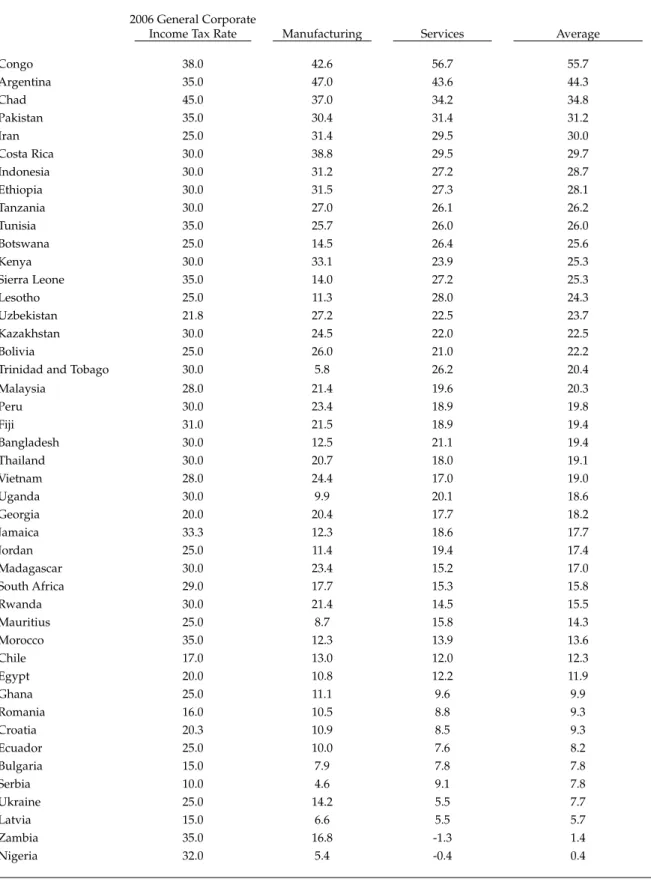
Taking into account the additional 45 countries in Table 1b, only the Republic of Congo and Argentina have higher effective tax rates on capital than Canada, resulting in Canada having the eighth highest effective tax rate on capital in the world. Canada’s effective tax rate of 36.6 percent is over 6 percentage points higher than the average effective tax rate on capital of 30.9 percent, size-weighted across all 81 countries.
8 Our 2005 estimates in Table 1a above somewhat differ from the 2005 report as we have obtained better information on capital cost allowance rates for some countries as well as some additional information on some taxes. We thank Susan Lyons of Global Services, Deloitte & Touche in Washington DC, for assistance in developing better tax information for a number of the countries included in Table 1. Further assistance was also provided by André Patry at Finance Canada.
Effective Tax Rate on Capital 2006 General Corporate
Income Tax Rate Manufacturing Services 2006 Average 2005 Average
China 24.0 47.5 46.4 46.9 47.2 Brazil 34.0 40.0 38.4 38.8 39.1 Germany 38.4 39.2 37.7 38.1 36.1 US 39.2 34.8 40.2 38.0 36.7 Russia 22.0 40.0 36.7 37.6 36.3 Canada 34.2 33.1 39.6 36.6 39.1 Japan 41.9 36.2 31.2 32.2 30.4 France 35.4 33.1 31.9 32.1 33.0 Korea 27.5 32.9 31.0 31.5 31.7 Spain 35.0 32.0 29.9 30.2 30.3 India 33.0 29.2 30.4 30.2 24.6 UK 30.0 23.9 29.4 28.5 28.5 Iceland 18.0 27.4 25.4 25.7 20.7 New Zealand 33.0 31.2 24.1 25.4 25.1 Australia 30.0 28.3 22.9 23.6 23.4 Italy 37.3 22.0 23.5 23.2 23.4 Finland 26.0 22.7 23.1 23.0 24.1 Norway 28.0 25.1 21.8 22.3 21.0 Netherlands 31.5 23.9 20.0 20.6 23.0 Luxembourg 30.4 24.3 20.2 20.5 21.0 Greece 32.0 25.4 19.3 20.1 22.4 Austria 25.0 21.6 18.5 19.2 20.0 Sweden 28.0 19.3 17.5 17.8 14.4 Hungary 16.0 19.6 15.6 16.5 17.0 Switzerland 16.7 16.4 16.5 16.5 14.1 Poland 19.0 15.9 16.4 16.3 28.1 Denmark 30.0 18.9 14.8 15.4 16.1 Ireland 12.5 12.6 14.6 14.0 17.2 Mexico 30.0 18.0 12.8 13.8 15.6 Portugal 27.5 15.7 13.4 13.8 13.4 Slovak Republic 19.0 14.0 12.2 12.6 10.9 Singapore 20.0 7.3 13.1 11.5 10.9 Czech Rep 26.0 13.3 10.5 11.2 12.0
Hong Kong SAR 17.5 3.6 6.2 6.1 5.8
Turkey 30.0 6.9 -2.5 -0.2 5.2
Belgium 34.0 -5.9 -4.0 -4.4 23.5
Table 1a: General Corporate Income Tax and Effective Tax Rates on Capital for 2006 and in
Comparison to 2005 (in percentages) for 36 Industrial and Leading Developing Countries
Note: The general corporate income tax rate is the statutory tax rate applied to taxable profit of corporations in each country that takes into account both national and sub-national tax rates. The effective tax rate on capital is the amount of corporate income and other capital-related taxes paid by a business as a percentage of pre-tax profits for marginal investment projects.
Effective Tax Rate on Capital 2006 General Corporate
Income Tax Rate Manufacturing Services Average
Congo 38.0 42.6 56.7 55.7 Argentina 35.0 47.0 43.6 44.3 Chad 45.0 37.0 34.2 34.8 Pakistan 35.0 30.4 31.4 31.2 Iran 25.0 31.4 29.5 30.0 Costa Rica 30.0 38.8 29.5 29.7 Indonesia 30.0 31.2 27.2 28.7 Ethiopia 30.0 31.5 27.3 28.1 Tanzania 30.0 27.0 26.1 26.2 Tunisia 35.0 25.7 26.0 26.0 Botswana 25.0 14.5 26.4 25.6 Kenya 30.0 33.1 23.9 25.3 Sierra Leone 35.0 14.0 27.2 25.3 Lesotho 25.0 11.3 28.0 24.3 Uzbekistan 21.8 27.2 22.5 23.7 Kazakhstan 30.0 24.5 22.0 22.5 Bolivia 25.0 26.0 21.0 22.2
Trinidad and Tobago 30.0 5.8 26.2 20.4
Malaysia 28.0 21.4 19.6 20.3 Peru 30.0 23.4 18.9 19.8 Fiji 31.0 21.5 18.9 19.4 Bangladesh 30.0 12.5 21.1 19.4 Thailand 30.0 20.7 18.0 19.1 Vietnam 28.0 24.4 17.0 19.0 Uganda 30.0 9.9 20.1 18.6 Georgia 20.0 20.4 17.7 18.2 Jamaica 33.3 12.3 18.6 17.7 Jordan 25.0 11.4 19.4 17.4 Madagascar 30.0 23.4 15.2 17.0 South Africa 29.0 17.7 15.3 15.8 Rwanda 30.0 21.4 14.5 15.5 Mauritius 25.0 8.7 15.8 14.3 Morocco 35.0 12.3 13.9 13.6 Chile 17.0 13.0 12.0 12.3 Egypt 20.0 10.8 12.2 11.9 Ghana 25.0 11.1 9.6 9.9 Romania 16.0 10.5 8.8 9.3 Croatia 20.3 10.9 8.5 9.3 Ecuador 25.0 10.0 7.6 8.2 Bulgaria 15.0 7.9 7.8 7.8 Serbia 10.0 4.6 9.1 7.8 Ukraine 25.0 14.2 5.5 7.7 Latvia 15.0 6.6 5.5 5.7 Zambia 35.0 16.8 -1.3 1.4 Nigeria 32.0 5.4 -0.4 0.4
Table 1b: General Corporate Income Tax and Effective Tax Rates on Capital by Country 2006
(in percentages) for 45 Developing Countries
The 2006 reductions in federal and provincial corporate income and capital tax rates caused the effective tax rate on capital to decline by about 2.5 percentage points and further reductions planned by 2010, as we detailed in June (Chen and Mintz 2006), will result in an effective tax rate on capital equal to 32.6 percent. This will leave Canada with the ninth instead of the eighth highest effective tax rate among 81 countries. Of course, this assumes that no other changes take place in other countries (an assumption that is already highly unrealistic since several countries have announced future business tax reductions).
While Canada’s position has improved relative to a number of other countries, it still has one of most uncompetitive business tax regimes in the world. Although other determinants of capital investment, such as the size of the economy (China, Brazil and the United States), infrastructure, the quality the labour force,
regulatory practice and a strong rule of law, substantially affect investment, taxation plays a significant role, as studies have shown. For example, it is not surprising that very low effective tax rates on capital can be found in countries that have enjoyed high economic growth rates, including Ireland, Singapore and
Hong Kong. China, surprisingly, has a high effective tax rate on capital9but some
provincial governments reduce or negotiate reductions in tax with foreign investors for some non-economic benefits, which is not uncommon in many countries. An example is Canada’s recent support of the auto sector. China’s effective tax rate on capital drops from almost 47 percent to 18 percent when businesses are granted relief from the 17 percent VAT on machinery that is refunded by some provincial governments.
The above estimates of the effective tax rates for 2006 demonstrate some quite important shifts resulting from tax reforms in a number of countries (as well as an upward trend in forecasted inflation). The most significant tax reform has been in Belgium where the government introduced a notional deduction for the cost of equity, based on the EU average government bond interest rate. The Belgian effective tax rate on capital is now negative, implying that the time value of tax deductions for depreciation, inventory costs and nominal financing costs is more than the tax that would be paid on income generated by a marginal investment. Any losses incurred on marginal investments in Belgium would need to shelter taxes on income generated on infra-marginal investments or be carried back or forward to future income earned by the enterprise.
Who Pays the Corporate Tax?
Cuts to business taxes have often been portrayed as unfair, since they are presumed to benefit the rich who are owners of the corporation, even though many lower-income Canadian own corporate equity through pension plans, RRSPs and mutual fund investments. Nonetheless, business taxes could also be part of costs, thereby forcing the companies to raise prices that more heavily fall on lower-income Canadians. The taxes could also be shifted back on workers in the form of lower wages or fewer jobs as the companies are less competitive. With
9 Foreign direct investment in China averaged about 4 percent of GDP from 1997–2004 (World Bank data).
increased international mobility of capital and Canada having a minute share of global markets, the presumption is that business taxes are less likely to be shifted onto owners of capital since investors, facing a lower return on capital in Canada, will move their invested funds to foreign jurisdictions where rates of return on capital are better and they can avoid paying the corporate tax. Instead, it is more likely to be shifted forward to Canadians through higher domestic prices or lower wages paid to workers.
Few economic studies are available to provide a clear picture as to who bears the corporate tax. Some recent analysis suggests that Canadian capital markets are increasingly integrated with international markets — thereby suggesting that corporate taxes are likely to fall more heavily on workers and consumers — although some segmentation still exists whereby Canadian stock prices seem
partly dependent on Canadian saving behaviour.10With segmented international
equity markets, Canadian corporate tax policies could reduce equity prices, thereby being in part shifted onto investors. While some evidence has shown that equity prices of Canadian companies that jointly list on Canadian and foreign stock exchanges seem little sensitive to Canadian tax policy changes, small businesses that are not financed by international markets would be in a better position to shift corporate taxes onto their investors. Certainly, corporate levies on small businesses allow owners to avoid payment of heavier personal income taxes. Further, the incidence of corporate taxes falls to some extent on foreign
governments if foreign-controlled businesses, which tend to be large in size, credit Canadian corporate income tax levies against tax liabilities owing to their
governments upon repatriation of profits.
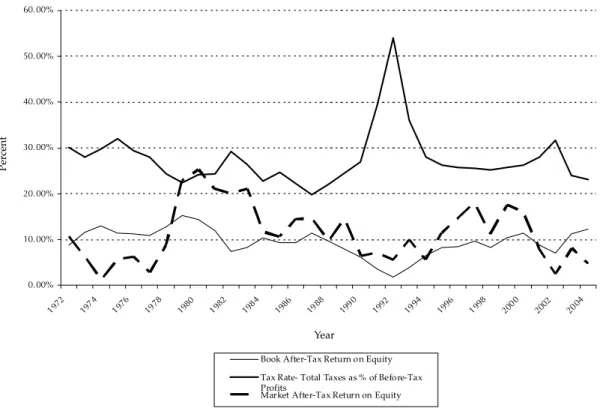
To gain some insight into the incidence of corporate taxes, Figure 4 provides a historical review of the average corporate tax paid as percentage of profits, as well as its relation to after-tax book profits, relying on financial statistics provided by Statistics Canada for consolidated balance sheets of larger companies. The average tax rate differs from the effective tax rates computed above since it calculates taxes paid on all projects, not just the marginal one in the case of effective rates.
From the 1980s until 2003, average corporate tax rates, ranging between 20 and
30 percent,11generally drifted slightly upwards, reflecting tax reform that has led
to broader tax bases and cuts to corporate rates, although the rates are cyclical
with the business cycle.12After-tax profits as a percentage of shareholders’ book
10 For example, cuts to dividend taxes in the 1980s and early 1990s caused Canadian equity prices to increase (McKenzie and Thompson 1996) contrary to a small open economy assumption whereby stock market prices are completely independent of Canadian factors affecting Canadian ownership of equities. The recent growth of income trusts that has allowed businesses to shift the payment of corporate taxes to greater personal taxes on Canadian investors would have been less likely occur if Canadian markets were fully integrated with international markets.
11 In Graph 4, profits include inter-corporate dividends received from non-consolidated
corporations that are exempt from taxation in the hands of the recipient corporation since they have already been subject to tax prior to their distribution. If the average tax rate is calculated as taxes divided by profits net of dividends received from non-consolidated corporations, the average tax rate would be 38.0 percent rather than 26.6 percent during the period 2000–2004. 12 During a downturn, profits are reduced by corporate losses but taxes as a share of profits net of
losses increase since governments do not refund losses unless carried back to reduce taxable income. During booms, loss carry forwards reduce taxes paid even though income rises and the incidence of losses decline.
equity seem to decline when the average corporate tax rate rises, which could be indicative of businesses making use of prior years’ losses to reduce current corporate tax payments during upturns rather than suggesting that corporate
taxes are in part shifted back onto shareholders.13
However, book profit measures are not necessarily related to the market returns that investors receive since market values depend on investor expectations for future profitability (not current profits) and tolerance toward risk. There are also distortions arising from inflation and other factors that influence accounting measures of book profitability. As an alternative, we examine the relationship between corporate tax rates and a market measure of profitability. The latter can be tricky to estimate, but we use a five-year rolling average of returns in the market to smooth out market rates of return to equity. As shown in Figure 4, the after-tax profitability on shares traded on the TSE has actually declined (in
contrast to book profitability) and little relationship can be found between current or five-year average corporate tax rates and market rates of return to shareholders. This lack of correlation between average tax rates and market-based after-tax rates of return on equity suggests that it is unlikely that the corporate tax is shifted back
13 A one-point increase in the average corporate tax rate is estimated to lower book after-tax profit rate by 0.34 percentage points, using these calculations. While this could suggest that 35 percent of the corporate tax is shifted back onto shareholders, the correlation also reflects the impact of business cycles on profit and average tax rates.
Figure 4: The After-Tax Returns on Equity & the Average Corporate Tax Rate
0.00% 10.00% 20.00% 30.00% 40.00% 50.00% 60.00% 1972 197 4 1976 1978 1980 1982 198 4 1986 1988 199 0 1992 1994 1996 1998 200 0 2002 2004
Book After-Tax Return on Equity Tax Rate- Total Taxes as % of Before-Tax Profits
Market After-Tax Return on Equity
Source: Source: Statistics Canada, CANSIM and Canadian Financial Markets Research Centre Database (http://dc1.chass.utoronto.ca/cfmrc).
Per
cent
onto shareholders in a significant way, at least in the case of marketable TSE equity securities.
The Need for Pro-Growth Tax Reform
Canada needs a heavy dose of pro-growth structural tax reform that would
increase Canadians’ standard of living. It is important to not only consider tax cuts but also to improve the structure of taxation. This report highlights structural reforms aimed at the following three objectives:
• Encourage more economic growth:Taxes should be shifted from the current
(heavy) impact on labour, investment and saving to tax bases that are less affected by taxation. Taxes on mobile capital and labour should be reduced in favour of taxes on consumption, property and other less mobile bases.
• Neutrality:Economic activities should bear similar tax burdens in order to
encourage the most profitable use of resources in the economy. Taxes that vary in burden according to type of good, service or investment encourage households and businesses to make decisions that yield inferior economic gains in order to lower tax payments. Tax provisions targeted to specific activities increase administrative and compliance costs for governments and taxpayers respectively. Differential tax burdens may be justified if certain economic activities should be encouraged (such as research) or discouraged (pollution), but only if other alternative policies such as regulations or grants are less effective than tax policy. Otherwise, the best tax system is one that is neutral among taxpayers and various activities to minimize the economic cost of taxation.
• Fairness:Neutral taxes that impose the same burden on taxpayers in similar
positions are most fair. To the extent that some taxpayers have more resources to pay taxes compared to others, higher taxes should be levied on those with greater ability to pay taxes. Taxes related to benefits received from public services are fair to the extent that those who consume the service pay some of the cost associated with the program.
The Pro-Growth Tax Reform plan is consistent with the approach in recent years, which should involve reducing marginal tax rates on labour and investment income, including clawback rates of income-tested programs, removing targeted tax credits, and increasing the use of pension and alternative saving instruments to shelter income from taxation. Corporate taxes should also be reformed by
significant reductions in corporate income tax rates accompanied by a further broadening of the corporate tax base. Greater reliance on consumption-based taxes, including those based on the user-pay principle, such as environmental taxes related to the use of clean air and water, should also be included as part of an overall reform. Tax reform at both federal and provincial levels should aim, therefore, at reducing high marginal tax rates in favour of broader tax bases.
Going Nordic: A Dual Income Tax for Canada?
An innovative but very substantial reform for Canada would be to adopt a dual income tax, such has become the hallmark of European tax reform in Nordic countries and the Netherlands (see Sørensen 1994 and Cnossen 2001). Under the dual income tax, portfolio investment income, capital gains and corporate income would be taxed at a low rate — even at the lowest tax rate applied to personal income in some countries. Income from less mobile tax bases (labour) would be subject to higher progressive rates for middle- and upper-income individuals.
This approach to taxing income derived from investments would be a significant structural change to Canada’s tax system since a major component of income — that derived from investment and capital gains — would be taxed on a separate schedule. It would reduce the need for special preferences like the pension credit, age credit, lifetime capital gains exemption and other preferences for capital income. However, for low-income investors, the tax on capital income could rise unless some special measures are taken to shelter the investment income and capital gains from taxation.
The Nordic countries adopted the dual income tax beginning with a version in Demark in 1987 (with two rates on capital income) and in Sweden (1991). The aim was to encourage investment, reduce the incentive to shift capital income out of the Nordic countries. It was also intended to reduce preferences arising, for
example, from interest deductibility for certain tax-favoured assets such as owner-occupied housing. Interest, dividends, capital gains and corporate income are taxed at a similar rate, roughly 30 percent or below, with some form of integration of corporate and personal income taxes on dividends and capital gains in several of the Nordic countries. Personal tax rates on employment income rise to levels of at least 50 percent in the Nordic countries.
What would be the features of a dual income tax in Canada? Following the Nordic model, the following provisions would apply, based on current income tax rates:
• The progressive rate structure would continue to apply to global income
except for investment income and capital gains that would be subject to a flat tax on a separate schedule.
• The tax rate on investment income and taxable capital gains would be set
at a 15.5 percent federal rate and an average 7.5 percent provincial rate for a total flat-tax rate of 23 percent (provincial variation in rates can be complex to deal with).
• Corporate income tax (using 2010 rates) would be set at an 11 percent
federal rate and a 4 percent provincial rate for a total rate of 15 percent. A single tax rate would apply to all corporate income, regardless of industry or size of business. This would remove the need for the two-tier dividend tax credit scheme recently adopted as a result of differential corporate income tax rates on large and small businesses.
• Corporate and personal income taxes on dividends and capital gains
would be integrated. A single dividend tax credit would be provided to reflect the unified corporate income tax rate of 15 percent. Portfolio
dividends would therefore be taxed at a flat rate of 10 percent and 50 percent of portfolio capital gains would be exempt from taxation. As discussed below, a different tax treatment for “participatory“ dividends and capital gains would be needed for investors closely related to a business.
• Interest and other costs incurred for investments would be deductible only
against investment income and taxable capital gains. Losses from
investments would only be deducted from investment income and capital gains on a carry-forward and carry-back basis.
• New pension and RRSP assets could be treated as part of investment
income. A deduction equal to 23 percent of contributions would be
permitted with a tax on withdrawals equal to 23 percent.14Alternatively,
the pension and RRSP assets could continue to be related to employment income: contributions deductible and withdrawals taxed as part of non-capital income to help average income for tax purposes.
The Achilles’ heel of dual income tax structures is the problem of delineating between employment and investment income. Those investors who also are employed or owner-managers of an unincorporated or closely held incorporated business derive both employment and investment income in the form of salaries, dividends, capital gains, interest and other investment income. The Nordic countries have developed a distinction between employment and investment income by splitting business income into two components: the capital component equal to the government bond rate plus a risk premium times assets invested in the business, with the excess being treated as other business income subject to the progressive rate schedule when paid out to investors and employees. For example, dividends paid to owners from a pool of investment income would be subject to the flat tax of 23 percent, and the balance subject to the progressive rates. With fluctuating incomes and complex corporate tax structures, this approach clearly has its difficulties, including providing scope to defer taxes owing on personal income.
Norway recently has adopted a new approach whereby income is split between capital and employment income for individuals rather than at the corporate level by providing an allowance that is equal to a bond rate multiplied by the investor’s investments, net of borrowings, which would be deducted from employment income and added to the investment income account.
Given the importance of the small business sector in Canada, the tax treatment of unincorporated and incorporated closely held businesses would be a significant issue to consider. One simple approach is to require all income, regardless of source, to be treated as employment income if the taxpayer is an employee or has substantial participation in a company (such as a minimum ownership of 10 percent). An alternative would be the Norwegian approach whereby some investors related to the corporation would split income between the employment and capital income account, although it would require complex record-keeping of
14 This would remove the effect of withdrawals being taxed at either higher or lower rates than the tax rate applied at the time a contribution is deducted from income, effectively removing any tax or subsidy to saving taking into account the time value of money.
assets and liabilities. Individuals with sufficient interest in companies will include dividends and one-half of capital gains as part of employment income with a dividend tax credit based on the uniform corporate income tax rate of 15 percent.
A dual-income tax would be a major restructuring of the tax system in Canada. It would reduce the tax penalty on capital investments quite substantially,
although it would maintain complexity associated with taxing investment income and could result in some taxpayers being more highly taxed than under the
existing system. It is not clear at this time that the dual income tax would be better than simply enhancing the retirement saving system and broadening the amount of savings exempt from taxation while lowering overall rates. It is an idea, however, worthy of study.
Pro-Growth Tax Reform
The current Canadian tax system has some very high marginal tax rates on employment, investment, capital gains and corporate income, especially affecting Canadians with modest income. It is also a hodgepodge of approaches whereby taxpayers can shelter some or all their savings from taxation by investing in pension plan and RRSP assets, or face quite high effective tax rates on investment income when unable to escape the clutches of a government that taxes investment income over and above the sheltered savings. While a dual-income tax as
discussed above would help deal with some of the issues raised in this report, a more comprehensive tax reform is needed.
Reducing Tax Barriers to Work
With increasing labour shortages, tax policies should be aimed at reducing barriers to those wishing to work more, whether in terms of more hours worked, greater participation in the labour force, later retirement or improving the acquisition of skills. As discussed above, the high marginal tax rates and sharp increases in average tax rates at modest income levels especially require more attention.
Several policies could be considered, all of which would reduce tax barriers to work.
• Consolidating Clawback Rates:Reductions in federal and provincial clawback
rates could effectively reduce marginal tax rates that are well in excess of 60 percent. One measure would be to avoid the stacking of clawback rates for different income-tested benefits: the federal GST and child tax credits, as well as those clawbacks that apply at the provincial level. Federal and provincial governments could consider creating a pool of credits that would be clawed back at a single rate. This would reduce some of the peaks in marginal tax rates that arise from too many programs that are subject to different clawback rates, although it would likely spread out clawback rates, albeit at a lower value, for a larger range of incomes.
• Raising the Basic Exemption level:Increasing the basic exemption used to
determine the taxpayer’s credit to a more meaningful amount, such as almost $15,000 in Alberta, would encourage more people to join the
workforce. For example, those taking a part-time job at $25,000 currently face a jump in average tax rates, including payroll taxes, of over 20 percent, which substantially reduces take-home pay.
• More Incentives for Later Retirement:Rules for pension plans and RRSPs
should be revamped to recognize that people expect to live and work longer in their lives. The existing age limit for contributing earned income to RRSPs is 69 years, two years less than what was permitted about decade and a half ago. Given the increase in life expectancy and the need to
encourage people to work longer years in an aging society, it would be appropriate to raise the age after which individuals must cease making contributions to pensions and RRSPs or are required to withdraw funds fromany Registered Retirement Income Fund. For example, a new age of 73 years would be equivalent to the prior limit of 71 years in the 1980s when life expectancies were lower (Mintz and Wilson 2001).
• Reforming Employment Insurance:With recent changes to the Employment
Insurance system, less incentive has been given to workers to remain working. Yet, at a time when jobs go begging in many parts of the country, it is illogical that the EI program is not reformed to create better incentives to keep people engaged in work rather than being laid off. As several studies have recommended in the past (see, for example, the Technical Committee on Business Taxation 1998), partial experience-rating for
determining insurance premiums, already used for workers’ compensation programs, would reduce the incentive to lay off workers and lower
unemployment rates. Those firms with a record of fewer layoffs would pay lower EI premiums. The higher and more-easily claimed benefits paid in some parts of Canada according to the regional rate of unemployment make little sense. The focus for determining benefits should be the level of replacement income during periods of unemployment not the location of the employee. These regionally based benefits should be cancelled, therefore allowing for an overall reduction in EI contributions. As a final point, social programs including compassionate and parental leave, skill development, job-creation partnerships, targeted wage subsidies and labour market partnerships should be evaluated as to their effectiveness, whether they should be funded by the EI payroll tax or some other source of funding, and whether they should be operated outside the EI program to enable self-employed and other Canadians access to the program rather than just those who just qualify for the EI program.
• Reducing the Tax Penalty on Education:Governments should increase the
tuition and education credit rate to a higher level such as 40 percent. This would not be as generous as the charitable donation credit, but it would reduce the unintended income tax penalty on education and training that offsets other government support for education. Further, the amount by which the credit can be transferred to a parent should be doubled to $10,000. The existing $5,000 limitation on transfers of tuition and education costs to a parent is below average provincial undergraduate costs of
degree tuition levels, provinces, and costs for graduate and specialized programs.
The above measures would create greater incentive to work and invest in education to acquire skills. Given the challenge of rising labour shortages, such policies will become increasingly important over time.
Better Treatment of Savings
While federal and provincial governments have been expanding the limits to which Canadians can contribute to RRSPs, the progress has been slow and tentative. Without greater personal savings by individuals for retirement, increased demands will be placed on governments to fund pensions and other retirement benefits with tax dollars that will be more difficult to levy in future years on a relatively smaller working population. A number of initiatives could be considered that would enhance access to the tax-sheltered savings plans and permit investors to accumulate wealth more quickly.
Limits should be expanded to allow taxpayers to ensure that they can invest in sufficient wealth to replace 70 percent of their income at time of retirement. Based on current annuity rates and a 5 percent nominal growth rate of earned income over 35 years, RRSP and pension plan contribution limits would need to be
expanded to about 35 percent of annual income, or about twice the current limit of 18 percent of earned income, to achieve this objective. Indeed, one could argue for not imposing any other annual limit if the intent of the tax system is to shelter sufficient wealth from taxation so that any Canadian, regardless of income, is able to achieve a minimum level of replacement income at time of retirement. For now, annual contribution limits should be boosted from $22,000 in 2010 to $32,000 (which could include the limit for a new form of retirement savings — TPSPs as discussed below) to support greater retirement earnings for upper-income and middle-class Canadians. As well, the earned income limit should be increased to 25 percent. This is especially important to skilled workers who now enter the workforce at income levels that are close to, or above, maximum pensionable earnings eligible for pension or RRSP treatment.
Many Canadians do not fully access their contribution room, implying that they will have insufficient resources to cover their retirement needs. Canadians may be unwilling to invest in pension and RRSP assets since they either do not have sufficient resources to fund current consumption needs, or do not fully anticipate the amount of wealth that they require to fund retirement. Further, the incentive to save through pension plans and RRSPs is reduced by other
restrictions that limit access. Some particular reforms, in addition to the increase in the age limit for contributions to pension and RRSP earnings as mentioned above, should include the following:
• While Canadians are able to carry forward any unused contribution room
for pensions and RRSPs to future years, they are unable to increase their contribution room when withdrawing RRSP funds early to cover
when they withdraw funds from RRSPs in early years when they face a need to do so. To encourage greater use of the retirement system, the unused contribution room should be increased by any withdrawals from pension or RRSP assets.
• Federal and provincial governments should introduce Tax-Prepaid Saving
Plans (Kesselman and Poschman 2001) to encourage more retirement savings. This would allow individuals to better average their tax bases to avoid higher marginal tax rates in the future relative to their current income (this applies not just to low-income but to many middle-income seniors as well). The TPSPs would permit individuals to earn income within the plan exempt from tax. No tax would be paid upon withdrawal and no deduction would be given for contributions to the plan (interest would not be deductible for investments in TPSPs, similar to RRSPs). A limit of $10,000 per taxpayer that would reduce eligible and enhanced RRSP limits, could provide a major boost to saving without a significant upfront revenue cost to governments.
• Low-income Canadians should be encouraged to invest in retirement
savings plans. Withdrawals from plans should not be included in determining the claw back of income-tested benefits, including GIS and old-age security. At present, such benefits are aggresively taxed back by governments through clawbacks.
• While the recent introduction of two dividend tax credits puts corporate
securities on a more equal footing with income trusts that bypass the corporate tax, low-tax-bracket or tax-exempt investors still prefer the income trust structure for investments. For example, when investing within a tax-sheltered RRSP, an investor no longer needs to compare the tax he pays on dividends from a corporation with the tax he pays on income trust distributions, which are fully taxed as interest income. With the personal tax burden out of the equation, he might well prefer the prospects of an income trust that pays no corporate tax on profits over a corporation that does so. To ensure equal treatment of all forms of business organizations, the dividend tax credit should be made refundable to low-income
taxpayers, pension plans and RRSP holders to offset fully corporate taxes
paid prior to the distribution of income.15A number of technical issues
would need to be dealt with, particularly with respect to the tax treatment of foreign owners of income trusts and provincial taxation (Mintz and Richardson 2006).
• Consideration should be given to the introduction of an account that
would permit investors to roll over marketable assets to defer capital gains taxes until funds are taken from the account to consume on goods and services (Mintz and Wilson 2006).
The effect of these provisions would be to boost significantly the amount of investment income sheltered from taxation and help remove the tax penalty on saving.
15 To ensure that the credit is funded, a minimum tax on dividends against corporate tax payments should be imposed on corporations to ensure that the credit is fully funded at the corporate level.
Improving Canada’s Investment Environment
As discussed above, Canada’s taxation of investment remains quite uncompetitive compared to most countries and further improvements are needed in the
corporate tax system. The federal and several provincial governments are reducing corporate taxes, although the progress has clearly been slow. The federal
government will drop its general corporate tax rate from 21 to 19 percent, the small business rate from 12 to 11 percent and eliminate the surtax of 1.12 percent applicable to all businesses by 2010. The federal government has also accelerated the elimination of the large corporation tax, although capital taxes continue to be applied to financial institutions, the latter operating as a minimum tax that reduces corporate income tax payments. Overall, Canada’s corporate income tax will decline to about 31 percent by 2010, which is three percentage points above today’s world average (KPMG 2006).
Further corporate income tax rate reductions are still in order since they would help counteract profit-shifting by business to low-taxed jurisdictions as well as improve the neutrality of the business tax structure. The federal government should consider a reduction in the general corporate income tax rate from 19 to 15 percent. Provincial governments should also reduce corporate income tax rates without any further reductions in small business tax rates. The current business tax structure undermines growth by imposing higher taxes on businesses as they grow. As discussed below, provincial rates should be further reduced as well, so that the overall statutory tax rates would be somewhat better than the world average. This would create a better environment for investment as well as counter the incentive to shift profits to foreign jurisdictions.
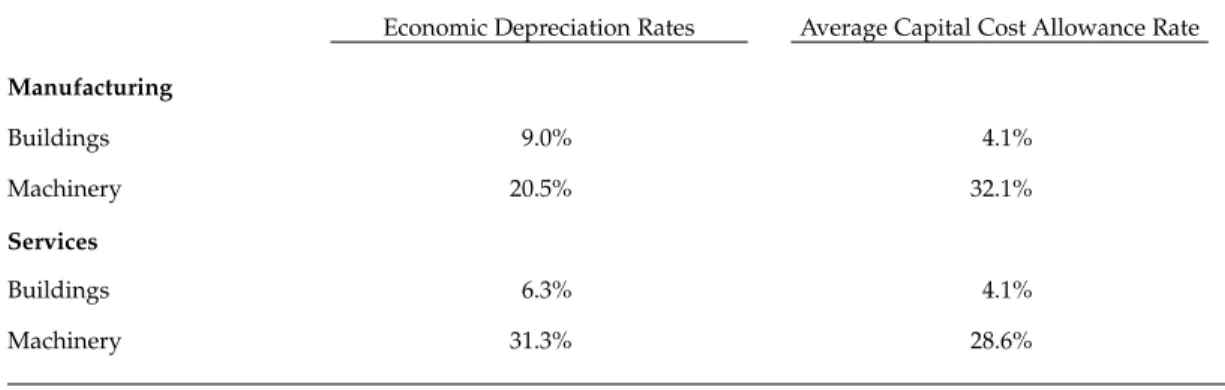
It would also be important, however, to make the corporate income tax base more neutral by aligning capital cost allowance rates with economic depreciation rates. Economic depreciation is the loss in the value of assets from year to year
reflecting wear and tear, obsolescence, uncertainty regarding use and inflation.16
As shown in Table 2, the capital cost allowance rates should be boosted on average for some assets, especially structures, to match economic depreciation rates. On an asset-by-asset basis, some capital cost allowance rates should be increased and others reduced.
The federal government could also make Canada more attractive for foreign investors by cutting withholding taxes on interest and dividends. Immediate action should take place that would remove the withholding tax on arm’s length interest and, in treaty negotiation with the US, the withholding tax non-arm’s length interest. Greater effort should be made to update treaties in light of recent US negotiations that have eliminated withholding taxes on dividends with several European countries. The federal government should also extend withholding tax relief to other forms of business organizations such as limited partnerships in
16 Business income is less taxed under inflation if businesses finance their investments with debt since interest, unadjusted for inflation, is deductible from income. We have shown that, overall, the capital cost allowance rate should be boosted by inflation if debt finance is not too high. For example, for pipelines, the capital cost allowance should be boosted by two percentage points from 8 to 10 percent, reflecting a 50 percent debt-asset ratio and 2 percent rate of inflation for an asset with a life of about 25 years. (Chen and Mintz 2005).