June 2010
Tor Stålhane, IDI
Master of Science in Computer Science
Submission date:
Supervisor:
Norwegian University of Science and Technology
User Acceptance of Information
Technology
An Empirical Study of It's Learning
Problem Description
This task is a continuation of the work from the specialization project about the user acceptance of information technology. The task focuses on an empirical study of the educational platform It's Learning at NTNU. The purpose of the task is to measure the user acceptance of It's Learning by exploring more user groups and other educational establishments which are using the system. Based on this study the problems and improvement areas of It's Learning at NTNU shall be identified.
Assignment given: 15. January 2010 Supervisor: Tor Stålhane, IDI
Abstract
This study continues the work from the specialization project, carrying out the em-pirical study of the educational platform It’s Learning at the Norwegian University of Science and Technology (NTNU). The goal of this study was to measure the user acceptance of It’s Learning at NTNU, performing more surveys with the students at NTNU, but also with other educational establishments for comparison. In addition to this, we wanted more focus on It’s Learning as a multi-user system.
To achieve the goal we did a study of technology acceptance in information systems. In addition to this, we have studied important challenges of developing, introducing and using groupware to get more focus on It’s Learning as a multi-user system. In addition to the survey we performed during the specialization project, three new surveys have been performed in this study. Two surveys were performed with student groups at NTNU, while one survey was performed with a student group at Sør-Trøndelag University College (HiST). In addition to this, we have performed interviews with some of the teachers at NTNU to get an indication of their usage and opinion of It’s Learning.
Instead of using one of the existing technology acceptance models as a framework for the survey, we created a new research model. The new model combines elements from two existing technology acceptance models, and was created to better adapt to It’s Learning. The survey, together with the interviews with the teachers, and the groupware challenge study, created a basis for an evaluation of It’s Learning. The results from the survey in this study clearly contradicted the results from the survey in the specialization project, but even though the results differed, all the student groups identified many of the same topics when it comes to problems with It’s Learning and how to improve the system
The results from the study indicates that two of the main problems with It’s Learn-ing at NTNU is that too few subjects use It’s LearnLearn-ing, and that It’s LearnLearn-ing is not utilized in a good way by the teachers. These two problems represent two im-portant challenges with multi-user systems, the "critical mass" challenge and the "non-standard use" challenge. As opposed to NTNU, HiST has mandatory use of It’s Learning, meaning that they avoid the "critical mass" challenge.
We also found that It’s Learning has an inflexible and cumbersome user interface, and the lack of possibilities for integrating the calendar and message system in It’s Learning with other existing applications affect the utility value of these features. That It’s Learning is a closed system is one of the largest problems for the teachers, in addition to some missing features for administrating exercises in their subjects. From this study we found that general user acceptance models give a good indication on the user’s perception of an information system, but that there is also important to focus on the challenges related to specific types of systems, like the multi-user environment in the case of our study.
Preface
This thesis is the result of the Computer and Information Science Master Thesis and was produced during the spring of 2010. It was written at the Department of Computer and Information Science (IDI) at the Norwegian University of Science and Technology (NTNU).
The purpose of the report is to continue the work from the specialization project, and measure the user acceptance of the educational platform It’s Learning at NTNU. I would like to thank my supervisor Tor Stålhane for great input and helpful guidance throughout the thesis. I would also like to thank the students who participated in the survey and the professors who participated in the interviews.
Trondheim, June 11, 2010 Martin Grønland
Contents
Contents v
List of Tables ix
List of Figures xi
List of Abbreviations xiii
1 Introduction 1
1.1 Motivation and background . . . 1 1.2 Problem definition, research methods and scope . . . 2 1.3 Outline of the report . . . 3
I
Related Technology
5
2 It’s Learning 7
II
Preliminary study
11
3 Technology acceptance 13
3.1 The Technology Acceptance Model . . . 14 3.1.1 Constructs of the original TAM . . . 14
CONTENTS
3.1.2 Constructs of TAM 2 . . . 15
3.1.3 Validity of TAM . . . 17
3.1.4 Shortcomings and limitations in TAM research . . . 18
3.2 Unified Theory of Acceptance and Use of Technology . . . 19
3.2.1 Constructs of UTAUT . . . 19
3.2.2 Validity of UTAUT and limitations in UTAUT research . . . . 21
4 Groupware challenges 23 4.1 Disparity in work and benefit . . . 24
4.2 Critical mass . . . 24
4.3 Disruption of social processes . . . 25
4.4 Non-standard use . . . 25
4.5 Unobtrusive accessibility . . . 25
4.6 Difficulty of evaluation . . . 25
4.7 Failure of intuition . . . 26
4.8 The adoption process . . . 26
III
Research methods
27
5 Survey 29 6 Interview 33IV
Execution and results
37
7 It’s Learning survey 39 7.1 Purpose of the It’s Learning survey . . . 397.2 The research model . . . 39 vi
CONTENTS
7.3 The survey . . . 42
7.4 Execution of the It’s Learning survey . . . 43
7.5 Results from the It’s learning survey . . . 43
7.5.1 Background information . . . 44 7.5.2 Use of functionality . . . 45 7.5.3 Usefulness . . . 47 7.5.4 User-friendliness . . . 48 7.5.5 Social influence . . . 50 7.5.6 Facilitating conditions . . . 51 7.5.7 Total assessment . . . 52
8 It’s Learning interview 55 8.1 Purpose of the It’s Learning interview . . . 55
8.2 Execution of It’s Learning interview . . . 55
8.3 Results from the It’s Learning interview . . . 56
V
Discussion
65
9 It’s Learning survey discussion 67 9.1 Use of functionality . . . 67 9.2 Usefulness . . . 70 9.3 User-friendliness . . . 73 9.4 Social influence . . . 75 9.5 Facilitating conditions . . . 77 9.6 Total assessment . . . 78 9.7 Survey evaluation . . . 81CONTENTS
10 It’s Learning interview discussion 85
10.1 Interview evaluation . . . 90
11 Groupware challenges discussion 93
VI
Conclusion
97
12 Conclusion and further work 99
12.1 Conclusion . . . 99 12.2 Further work . . . 102
Bibliography 103
VII
Appendix
107
A Research model - variables A-1
B It’s Learning survey B-1
C Survey - data distributions C-1
D Survey - box-plot graphs D-1
E Interview guide E-1
F Interview transcriptions (full text) F-1
List of Tables
5.1 Survey errors . . . 32
7.1 Background information . . . 45
7.2 Main reason for dissatisfaction . . . 52
8.1 Answers from the general questions about It’s Learning . . . 57
8.2 Answers from the teacher who do not use It’s Learning . . . 57
List of Figures
2.1 Main page of It’s Learning . . . 7
2.2 Features availiable in It’s Learning . . . 9
3.1 The basic concepts underlying user acceptance models . . . 13
3.2 TAM . . . 14
3.3 TAM 2 . . . 16
3.4 UTAUT . . . 19
4.1 Development and research contexts . . . 23
5.1 Steps in a survey . . . 30
7.1 The research model . . . 40
7.2 Mean results for the usage of functionality . . . 46
7.3 Mean results for usefulness . . . 47
7.4 Mean results for user-friendliness (reversed) . . . 48
7.5 Mean results for user-friendliness . . . 49
7.6 Mean results for social influence . . . 50
7.7 Mean results for facilitating conditions . . . 51
List of Abbreviations
HiST Sør-Trøndelag University College
LMS Learning Management System
NTNU Norwegian University of Science and Technology
SDK Software Development Kit
SRS Simple Random Sampling
TAM The Technology Acceptance Model
TAM 2 The Technology Acceptance Model 2
TRA The Theory of Reasoned Action
URL Uniform Resource Locator
Chapter 1
Introduction
This chapter gives an introduction to the rest of the report. We will start by pre-senting the motivation and the background for the study. We will then describe the problem definition, in addition to the scope of the study and the research methods that are used. At the end of the chapter we will present an outline of the rest of the report.
1.1
Motivation and background
This study is a continuation of the work from the specialization project (Grønland, 2009) which we performed in the autumn of 2009. The specialization project focused on studying the role of usefulness and user-friendliness in technology acceptance of information systems. In this study, It’s Learning was used as a subject for research. We studied the use of It’s Learning at the Norwegian University of Science and Technology (NTNU) and also studied how usefulness and user-friendliness affected the user acceptance of the system. The study was carried out by doing a user acceptance survey of It’s Learning with students at the Department of Computer and Information Science at NTNU. The results indicated a low satisfaction with It’s Learning amongst the students, and both usefulness and user-friendliness received low scores. A total of 65% of the students answered that they were dissatisfied or very dissatisfied with It’s Learning. The survey also revealed that the integration of It’s Learning at NTNU was an important factor when evaluating the system, meaning that a focus on usefulness and user-friendliness alone would not be sufficient when expanding the study. Because of this, we changed the focus on technology acceptance to include not just usefulness and user-friendliness, but also facilitating conditions like the integration of It’s Learning at NTNU. In addition to this, we also focus on the challenges of developing, introducing and using multi-user applications and systems. We will expand the research which was started in the specialization project, and continue the empirical study of It’s Learning.
CHAPTER 1. INTRODUCTION
The background for the study is to explore the research field of technology accep-tance of information systems and understand how user accepaccep-tance can be measured. Technology acceptance is about the conditions in which information systems are ac-cepted and used (Venkatesh and Davis, 2000). These conditions can be used to predict future use of an information system, but also measure the user acceptance of existing system. In the case of It’s Learning we will be measuring the user ac-ceptance of an existing system. As It’s Learning is a multi-user system we will add more focus on this by studying groupware challenges which are important to handle for a multi-user system to be a success.
The reason for choosing It’s Learning as a subject for this study is that there has been expressed a lot of frustration about the lack of functionality and user-friendliness in the system by students and employees at NTNU (Paulsen, 2007). These statements were supported by the specialization project study, were the students were generally dissatisfied with It’s Learning at NTNU. In this study we will further explore the use of It’s Learning by examining more user groups at NTNU, but also other educational establishments that are using It’s Learning as their learning management system (LMS). In this way we will see if the results in this study will support the results from the specialization project. Based on this study we will create a basis for a presentation of the results for NTNU and It’s Learning AS (developers of It’s learning).
1.2
Problem definition, research methods and scope
The problem definition for this study is as follows:
• Use the technology acceptance study to create a basis for measuring the user acceptance of It’s Learning, in addition to focusing more on It’s Learning as a multi-user system.
• Continue the empirical study of It’s Learning by exploring more relevant user groups to see if the results from the specialization project will be supported. • Identify the problems and potential of improvement for It’s Learning at NTNU. The study of technology acceptance in information systems was performed in the specialization project and we supplemented this part of the preliminary study with a study of groupware challenges. We did this study to get focus on specific challenges with multi-user systems, which are important when evaluating It’s Learning as it is a large and complex multi-user system. For expanding the empirical study we decided to do more surveys with student groups at NTNU, and also included a student group from Sør-Trøndelag University College (HiST) for comparison. A new technology acceptance model was created and used as a basis framework for the survey. In addition to this, we performed interviews with three teachers at
CHAPTER 1. INTRODUCTION
NTNU to get their view of It’s Learning. Based on the results from this study we have discussed the surveys, interviews and the groupware challenges to identify the problems and potential of improvement for It’s Learning at NTNU.
The scope of the project is limited to studying the most well known models in tech-nology acceptance research, and to obtain an understanding of important challenges when developing, introducing and using groupware (multi-user) applications and systems. The user acceptance survey with the students will be the main focus of this study, but we will limit the samples to three new user groups. The interviews performed with the teachers at NTNU will be used to get an indication of their opinion and usage of It’s Learning.
1.3
Outline of the report
The report is divided into six main parts. The first part gives a description of the related technology in this study, where It’s Learning is introduced. The second part presents the preliminary study of technology acceptance and groupware chal-lenges. The description of the technology acceptance preliminary study is taken from the specialization project (Grønland, 2009). The third part presents the research methods which are used in this study, including the interview and the survey. The description of the survey is taken from the specialization project (Grønland, 2009). The fourth part presents the execution and results from the empirical study, which were performed as interviews (qualitative study) and surveys (quantitative study). The fifth part presents the discussion of the results from the empirical study, in ad-dition to a discussion of the groupware challenges that are relevant for It’s Learning. Part four and five will also present and discuss the results from the specialization project. The sixth and final part concludes the work.
Part I
Chapter 2
It’s Learning
It’s Learning is a learning management system (LMS) developed by It’s Learning AS, a leading supplier of information technology to educational establishments. It’s Learning is used in all levels of education and is a tool for communication and collaboration, administration of educational resources and evaluation of pupils and students. It’s Learning consists of several educational tools, which can be customized and filled with content by the schools that are using the system (It’s Learning AS, 2010d,a).
It’s Learning was recommended as a LMS for NTNU in 2002, after a two year period of testing several LMSs. The actual use started in the spring semester of 2003, with a gradually introduction of the system (Ramberg, 2002). It’s Learning was offered to all subjects at NTNU in the autumn of 2003 and the contract with It’s Learning AS was renewed in 2005 based on good experiences with the system (Multimediesenteret NTNU, 2006b).
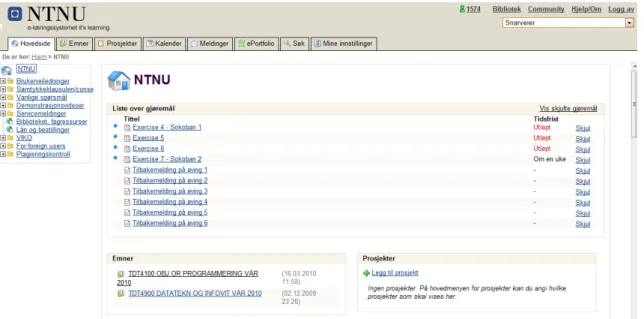
Most of the functionality which is available at NTNU is displayed by the tabs in Figure 2.1. The figure shows It’s Learning from a student’s point of view, but there is also a part of the system which is available for the teachers. A short description of each perspective will be given below.
The main page (See Figure 2.1) consists of several shortcuts to the rest of the system including list of tasks and subjects. The subject tab contains an overview of all the subjects the student attends in the current semester, in addition to all the previous subjects that has been attended. All the subjects that the student attends this semester are also presented on the main page of the system. Within each subject the student can find all the information and material which have been published. The subject functionality in It’s Learning uses an access control system consisting of "administrator", "teacher", "student" and "guest" as standard profiles. It is also possible to create customized profiles if needed. The project tab contains an overview of the projects that the students are a member of. This functionality
CHAPTER 2. IT’S LEARNING
Figure 2.1: Main page of It’s Learning
makes it is possible for the students to create their own project groups. The project functionality offers much of the same features that the teachers have for creating subjects. Similar to the subjects, the projects for the current semester will be presented on the main page of It’s Learning. The calendar gives the students the opportunity to follow the activities in the subjects they are attending, in addition to adding their own personal activities. Today’s activities are displayed both on the main page and the subject or project page where the activity belongs. The message system is a feature that can be used to send and receive messages internally in It’s Learning. The message system has basically the same functionality as an e-mail system. It also offers forwarding of messages to the students e-e-mail account. In addition to this, It’s Learning contains a search function, ePortfolio and other minor functions (Multimediesenteret NTNU, 2006a).
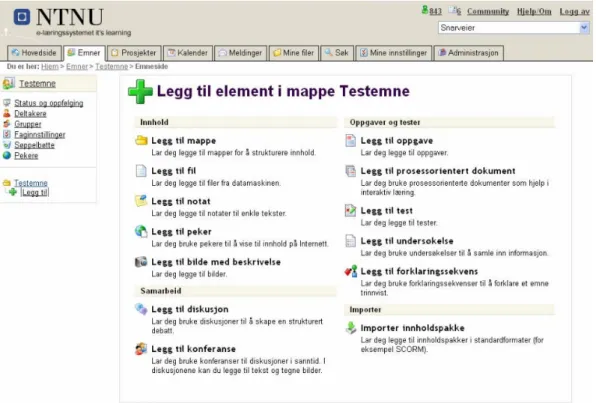
In addition to the functionality described above, the teachers can also administrate the subjects they are responsible for. The teachers can publish information, files and activities/tasks to the students, in addition to communicating with them. Some of the available features for the teachers can be seen in Figure 2.2. The features that are displayed in the upper left corner in Figure 2.2 can be used to administrate the subject. From this menu the teachers can generate status reports on the students, create groups, add pointers to external web pages and arrange net meetings. Figure 2.2 also shows some of the elements that can be added to the subject page. From this menu the teachers can add content like notes and messages on the bulletin board, and add new files and folders for the subject. Activities like tasks, tests or surveys can be added. When a teacher adds a new activity for a subject, the activity will also become available in the students calendar. The teacher can add lecture times in the subject calendar, which also will be available for the students attending the subject. As can be seen in Figure 2.2 the subject functionality also has support for
CHAPTER 2. IT’S LEARNING
Figure 2.2: Features availiable in It’s Learning
collaboration tools like discussion forum and conference (Multimediesenteret NTNU, 2006b).
Recently, It’s Learning AS has introduced a software development kit (SDK), making it possible for users to develop their own applications and tools for It’s Learning. In addition, there will also be possible for the users to extend the existing functionality in It’s Learning. To use the SDK, the user has to have some programming knowledge. It’s Learning is developed in C#1, but applications and tools can also be developed in other programming languages like PHP2 and Java3. The externally developed applications and tools will be connected with It’s Learning through its application programming interface. The SDK is currently a beta version (It’s Learning AS, 2010b). To read more about the It’s Learning SDK, see (It’s Learning AS, 2010c). This chapter has only presented an overview of the features which are available in It’s Learning. To get a more detailed description you can see (It’s Learning AS, 2010d) and (It’s Learning AS, 2010a).
1Read more about C# at: http://msdn.microsoft.com/en-us/vcsharp/default.aspx 2Read more about PHP at: http://php.net/index.php
Part II
Chapter 3
Technology acceptance
In this part of the preliminary study we will take a look at two of the models which have influenced the research field of technology acceptance in information systems. There are many models within this research field, with a varying degree of influence on the evaluation of user acceptance in information technology. We have decided to take a look at the two most well known models, the Technology Acceptance Model (TAM) and The Unified Theory of Acceptance and Use of Technology (UTAUT). It is important to notice that TAM is sometimes referred to as two separate models; TAM which is the original model, and TAM 2 which is an extension of TAM. When various research studies are reviewing TAM they are mostly referring to TAM as one model. We will do the same in this chapter and throughout the report. UTAUT is based on the same principles as TAM, and is by some considered to be an extension of TAM as well (Bagozzi, 2007).
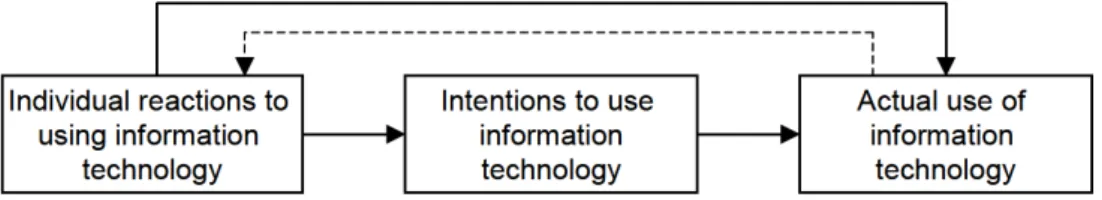
Figure 3.1: The basic concepts underlying user acceptance models (Venkatesh et al., 2003)
The models are based on the same basic concept for user acceptance models which are presented in Figure 3.1. You have a user’s reaction to using an information system, which will form the intentions to use the system, which again lead to actual system use. Thus, the models are based on the concept that intention to use has a significant effect on using information technology, which again leads actual usage (Venkatesh et al., 2003).
CHAPTER 3. TECHNOLOGY ACCEPTANCE
3.1
The Technology Acceptance Model
The Technology Acceptance Model (TAM) was introduced by Fred D. Davies in 1985 (Davis, 1985) and is a model for evaluating user acceptance in information systems. The goal of TAM was to provide theory for developers to successfully design and implement an information system. A second goal was to give developers a model for evaluating planned information systems before implementing them (Davis, 1985). TAM is based on the Theory of Reasoned Action (TRA) by Fishbein and Ajzen (Ajzen and Fishbein, 1980). TRA is a general model from social psychology which was designed to identify what affected human behavior. Davies used TRA as a starting point and developed an adaptation of the model to fit information systems specifically (Davis et al., 1989). Both TAM and TRA are based on finding the un-derlying reasons for a person’s behavioral intention. In TAM this means to discover the underlying reasons for a user accepting or rejecting an information system.
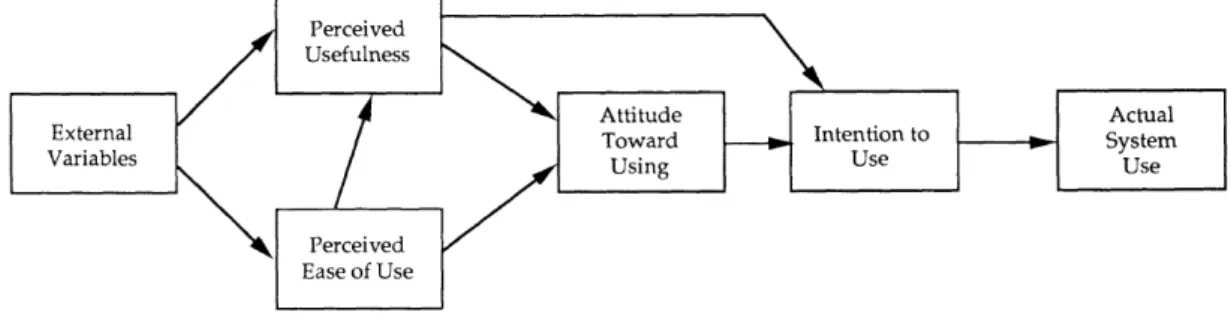
Figure 3.2: TAM (Davis et al., 1989)
3.1.1
Constructs of the original TAM
(Davis, 1989) came up with two determinants which were affecting the intention to using an information system;perceived usefulness and perceived ease of use:
1. Perceived usefulness is defined as "the degree to which a person believes that using a particular system would enhance his or hers job performance" (Davis, 1989, p. 320).
2. Perceived ease of use is defined as "the degree to which a person believes that using a particular system will be free of effort" (Davis, 1989, p. 320).
As can be seen in Figure 3.2 both of these determinants are influenced by several external variables. Variables affecting perceived ease of useare for instance training and documentation (Davis et al., 1989). If an information system is well documented it will be easier for a user to start using it. The same applies for training. If the
CHAPTER 3. TECHNOLOGY ACCEPTANCE
company that is introducing a new information system has good training routines, it will be easier for the user to learn the system and accept the new technology. In TAM, as shown in Figure 3.2, perceived usefulness and perceived ease of use contribute in the creation of anattitude towards using technology. The connection betweenperceived ease of use and perceived usefulness indicates that perceived use-fulness will be affected by the level of user-friendliness in the information system. If the system has high user-friendliness, this will most likely increase the level of satisfaction for the user, and make the system more useful.
Even though perceived ease of use directly affects the attitude towards using the technology, it has no direct effect on theintention to use the technology. Perceived ease of use does not determine whether you will use a new information system or not, but will rather create anattitude towards using it. If an information system has high user-friendliness it will have a positive impact on the user and create a positive attitude towards using the new technology. If a new information system has no real usefulness for the user in doing his1 job, it will not help that the system offers great user-friendliness. This is why perceived ease of use does not affect intention to use directly.
The connection betweenperceived usefulness and intention to use can be explained in the way that actual usefulness of using an information system will directly affect the intention to using it. If a user thinks that a new information system will increase his job performance it will have a positive effect on intention to use. Intention to use is also affected by the user’s attitude towards using the information system.
3.1.2
Constructs of TAM 2
Technology Acceptance Model 2 (TAM 2) was developed by Viswanath Venkatesh and Fred Davies (Venkatesh and Davis, 2000) as an extension to TAM. The goal of TAM 2, according to (Venkatesh and Davis, 2000), was to include additional impor-tant determinants which affectperceived usefulness andintention to use, in addition to understand how the determinants can change over time as the user’s experience increases. The model now includes social influence and cognitive instrumental pro-cesses to explainperceived usefulness and intention to use.
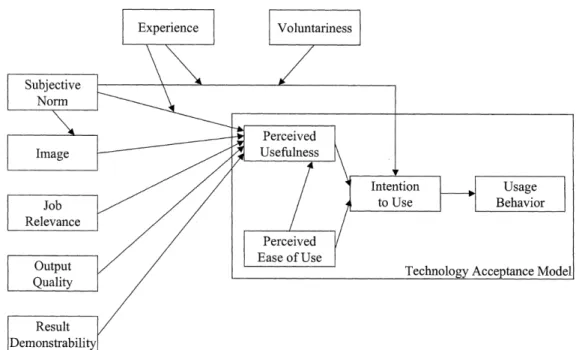
Figure 3.3 shows the structure of TAM 2. Inside the box on the right hand side in the figure we can see a simplified version of the original TAM (Figure 3.2). (Venkatesh and Davis, 2000) found that perceived ease of use appeared to have a direct effect onintention to use, without going throughperceived usefulnessand attitude towards use. Attitude towards using the system was found non-significant and therefore
removed from the model. To read more information about perceived usefulness
and perceived ease of use, see Section 3.1.1. Figure 3.3 also contains all the new determinants, including voluntariness, experience, subjective norm and image as
CHAPTER 3. TECHNOLOGY ACCEPTANCE
Figure 3.3: TAM 2 (Venkatesh and Davis, 2000)
social influence processes, and job relevance, output quality, result demonstrability andperceived ease of useas cognitive instrumental processes. (Venkatesh and Davis, 2000) presents the different determinants in the following way:
Social Influence processes
Subjective norm is what other people think and how they influence others to use, or not to use, an information system. Image indicates how much your social status will increase if you are using a new technology. Subjective norm will affect image as other people’s opinions will have influence on your social status. (Venkatesh and Davis, 2000) says that increased social status will again contribute in greater job performance.
Voluntariness affect subjective norm in different ways depending on the situation. If the use of an information system is mandatory,subjective norm will have a direct effect onintention to use. On the other hand, if the use of the system is voluntary, then subjective norm will have no significant effect on intention to use (Venkatesh and Davis, 2000). That is, if you are using an information system at your own free will, then other people have little influence on your choice. This is in contrast to a mandatory setting, were the information system to use is decided for you, and subjective norm and social influence will play a bigger role. Thus, (Venkatesh and Davis, 2000) concluded thatvoluntariness will be a moderating factor of subjective norm’s effect on intention to use.
Experience works in the similar way as voluntariness and is a moderating factor of 16
CHAPTER 3. TECHNOLOGY ACCEPTANCE
subjective norm’s effect on perceived usefulness and intention to use. (Venkatesh and Davis, 2000) says that increasedexperience will decrease the effect of subjective norm to bothperceived usefulness and intention to use. Subjective norm’s effect on intention to use will apply for a mandatory setting only as voluntariness already has been stated to moderate this connection. This means that the effect of social influence will weaken over time as the user get more experienced in using the infor-mation system. As social influence would have a minor effect from the beginning in a voluntary setting,experience does not affect the connection between subjective normand intention to usein a voluntary setting at all. When it comes tosubjective norm’s effect on perceived usefulness, this effect will decrease with more experience in both a mandatory and a voluntary setting.
Cognitive instrumental processes
Cognitive instrumental processes are the processes of comparing an information system’s capability to what the user need to get done (Venkatesh and Davis, 2000). The system might be capable of doing the job, but it shall also present the results in a good way. Based on this, the cognitive instrumental processes will have a positive effect onperceived usefulness and increase the usefulness of the information system. The cognitive judgement is for the user to take. The cognitive instrumental determinants will be explained below.
Job relevanceindicates to what degree the information system is capable of assisting the user in doing his job. Output quality is an evaluation of how good the system performs its tasks. Result demonstrability indicates how the system presents the result from the task that is performed. A system may present the results needed by the user, but it will still be bad result demonstrability if it does it in a poor way. Perceived ease of use, which is already presented in Section 3.1.1, must also be considered as a congnitive process. This is because it is a cognitive judgement to decide how much effort must be put into completing the task.
What effectexperiencewill have on cognitive instrumental processes over time is also discussed in (Venkatesh and Davis, 2000). In the conclusions, the authors state that they do not have enough theoretical rationale to explain whether or not various effects (e.g. experience) on the cognitive instrumental processes will be affecting eitherperceived usefulness orintention to use.
3.1.3
Validity of TAM
TAM explains more than 40% of the usage intentions for an information system (Legris et al., 2003) and TAM 2 was in (Venkatesh and Davis, 2000) said to explain 60% of the variance inperceived usefulnessand between 37% and 52% of the variance in the intention to use. Later in (Legris et al., 2003) it has, however, been stated that both TAM and TAM 2 can account for 40% of usage intentions. In support of
CHAPTER 3. TECHNOLOGY ACCEPTANCE
TAM it was in (Davis et al., 1989) concluded that "perceived usefulnes is a major determinant of people’s intentions to use computers" (Davis et al., 1989, p.997), and that "perceived ease of use is a significant secondary determinant of people’s intentions to use computers" (Davis et al., 1989, p.997). From (Venkatesh and Davis, 2000) it is also stated that both the social influence procesess and the cognitive instrumental processes of TAM 2 have a significant influence on user acceptance. In addtion to this, (Davis et al., 1989) had alone over 700 citations in 2007, and it has been the leading model of user acceptance for over two deacades (Bagozzi, 2007).
3.1.4
Shortcomings and limitations in TAM research
TAM has become an important model for studying the user acceptance in informa-tion technology. However, there has also been pointed out some shortcomings and limitations in the research which will be presented below.
In 2003 (Legris et al., 2003) did a critical review of TAM by analyzing 22 different articles on TAM research. They concluded with three significant limitations in the TAM research. The first is that most of the TAM studies are involving students. This is a question of cost, but in the opinion of (Legris et al., 2003) it would be better if TAM studies were performed in a business enviroment.
The second limitation pointed out was the type of applications which were studied. Mostly they studied the introduction of office automation software and systems development applications, and (Legris et al., 2003) believe that it would be benefitial to also study the introduction of business process applications. In another evaluation of TAM (Lee et al., 2003) it has been pointed out that multi-user systems and more complex systems in general should be included in the TAM studies.
The third limitation explained by (Legris et al., 2003) is self-reported use. They state that they do not actually measure system use, and that self-reported use will not give a precise measure. To exemplify what self-reported use is, (Legris et al., 2003) has taken an extract from the paper La Presse Montreal (Tuesday 17 October 2000) which in short says that observers in public toilets in the United States noted that only 67% of the persons washed their hands after visiting the toilet. In contrary in a telephone survey, 95% anwered that they washed their hands after going to the toilet. In (Lee et al., 2003) self-reported usage is reported as the most commonly reported limitation of TAM research. They say that 39 of the studies they examined relied on self-reported usage instead of measuring actual usage. To get more precise results, studies have to be done by observation or another form of monitoring. This will probably be more difficult to perform in addition to having higher cost in time and money.
In addition to stating that self-reported use is one of the major limitations of TAM, (Lee et al., 2003) also emphasize the importance of doing longitudinal studies as users expectations change as they get more experienced with using an information
CHAPTER 3. TECHNOLOGY ACCEPTANCE
system. In their research only 13 of 101 TAM papers which were examined were longitudinal.
3.2
Unified Theory of Acceptance and Use of
Tech-nology
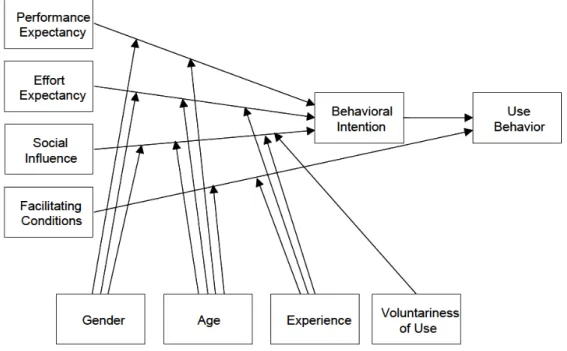
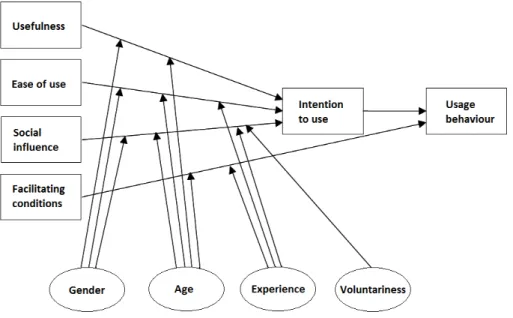
The Unified Theory of Acceptance and Use of Technology (UTAUT) was developed by Viswanath Venkatesh et al. in 2003 (Venkatesh et al., 2003). UTAUT is based on a review of eight other models from user acceptance literature, and the goal was to create a unified model which is combination of elements from the existing models. An additional motivation for creating a unified model is to make it simpler for researchers to choose a model without having to sacrifice the contributions of other models (Venkatesh et al., 2003). As can be seen in Figure 3.4 the model is formulated to explain behavioral intention and use behavior. This is done through four determinants of intention and usage, in addition to four moderators which is moderating the effect of the determinants.
Figure 3.4: UTAUT (Venkatesh et al., 2003)
3.2.1
Constructs of UTAUT
In this section we will present the four determinants (performance expectancy, ef-fort expectancy, social influence, facilitating conditions) and the four moderators (gender, age, experience, voluntariness of use) of UTAUT. We will also do some comparisons with TAM (Section 3.1), which is one of the models that were
evalu-CHAPTER 3. TECHNOLOGY ACCEPTANCE
ated in (Venkatesh et al., 2003).
Performance expectancy is the degree to which a user believes that an information system will help him get advantages in doing his job (Venkatesh et al., 2003). Per-formance expectancycan be compared to TAM’sperceived usefulness, and works as a direct determinant ofbehavioral intention. As we can see in Figure 3.4,performance expectancy is not placed as a main determinant as perceived usefulness is in TAM (see Figure 3.3), but rather equated with the rest of the determinants. Performance expectancy is moderated by gender and age, indicating that the effect of perfor-mance expectancy is stronger for young men (Venkatesh et al., 2003). They state research has indicated that men are more task-oriented than women, and that age changes work expectation as people go through different phases in life (Venkatesh et al., 2003).
Effort expectancy is the degree to which a user believes that an information system is easy to use (Venkatesh et al., 2003). Effort expectancy can be compared to TAM’s perceived ease of use, and is a direct determinant of behavioral intention. Like per-formance expectancy, effort expectancy is equated with the rest of the determinants in UTAUT, contrary to perceived ease of use in TAM (See Figure 3.3). Effort ex-pectancy is moderated by gender, age and experience and it is stated in (Venkatesh et al., 2003) that the effect of the moderators will be stronger for younger women, especially with low experience. Some of the arguments are thatage has an effect on the ability to learn new information systems, and that more experience will make systems easier to use.
Social influence is the degree to which a user believes that other people’s opinions are important for the decision of using an information system (Venkatesh et al., 2003). Social influencecan be compared tosubjective norm which was introduced in TAM with TAM 2, and is a direct determinant onbehavioral intention (See Figure 3.3). As for TAM, experience and voluntariness of use are moderators of social influence, in addition to gender and age (Venkatesh et al., 2003). The effect of the moderators will be stronger for older women, especially with low experience and in a mandatory setting (Venkatesh et al., 2003). Many of the same arguments as in TAM (see Section 3.1.2) are used to explain the effect ofexperience and voluntariness of use. (Venkatesh et al., 2003) say that gender theory reveals that women are more sensitive tosocial influence than men. Social influence will also be more prominent with older people, but will have a decreasing effect with experience.
Facilitating conditions is the degree to which a user believes that organizational and technical infrastructure will support the use of an information system (Venkatesh et al., 2003). Facilitating conditions is strongly related to effort expectancy in which that environmental factors will affect the using of an information system by making it easier to use and learn. By this we can say that it is also related to TAM’s perceived ease of use. Facilitating conditions works as a direct determinant on use behavior. It has no significant effect on the behavioral intention, although it would
CHAPTER 3. TECHNOLOGY ACCEPTANCE
be natural to assume thatfacilitating conditions would predict behavioral intention ifeffort expectancywas not a part of the model (Venkatesh et al., 2003). Facilitating conditionsis moderated by ageand experience, so the effect will be more prominent for older and experienced people (Venkatesh et al., 2003). Research state that experienced users find more ways to get help and support, and that older people will be in more need for help and assistance in performing their job than younger people (Venkatesh et al., 2003).
Of a total of 32 constructs from the models which were evaluated, seven appeared to be significant direct determinants of intention or usage. Four determinants have already been presented. Attitude towards using technology,self-efficacy and anxiety was explained to not be direct determinants of intention and usage in UTAUT (Venkatesh et al., 2003). They are all modeled as indirect determinants ofbehavioral intention. The reason for this is thatself-efficacyand anxiety are mediated through effort expectancy. Attitude towards using technology is defined as a user’s emotional reaction to using an information system, and this determinant will indirectly affect all the four determinants of UTAUT (Venkatesh et al., 2003).
3.2.2
Validity of UTAUT and limitations in UTAUT
re-search
As UTAUT is a much more recent model than TAM there have not been that many critical reviews of the model. It is though stated, based on the empirical validation in (Venkatesh et al., 2003), that UTAUT can explain 70% of the variance in usage intention. This is significantly more than any of the eight models which were examined in the study. Other strengths which are pointed out in (Venkatesh et al., 2003) are:
• UTAUT is based on a compromise between eight other existing models. • All eight models in the study used within-subjects and longitudinal data from
four organizations.
• UTAUT was tested by using original data from four organizations and cross-validated by adding data from two additional organizations.
UTAUT is by some considered to be another extension of TAM, and is criticized for just doing patchwork on TAM without making any integration and coordination within the model (Bagozzi, 2007). Bagozzi (Bagozzi, 2007) says that even though it is important to find all the variables that are influencing intention and usage, it is also important that the field of information systems does not get overwhelmed and confused by the growing number of piecemeal parts in technology acceptance.
Chapter 4
Groupware challenges
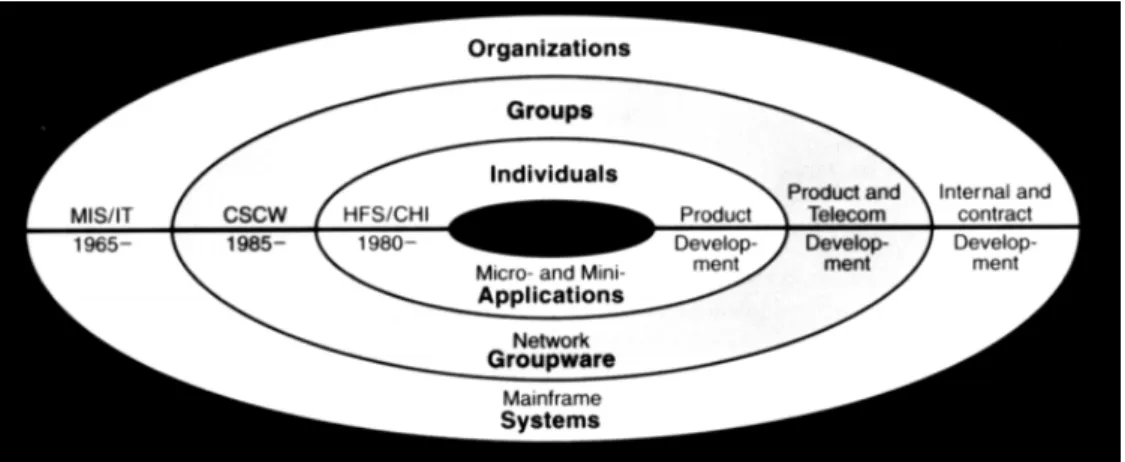
In this part of the preliminary study we will present some of the challenges of de-veloping groupware. Groupware is defined as a collaborative application that helps people work together when they are in different locations (TechTarget, 2010). It is important to notice that groupware is defined in different ways by different re-searchers, and it can also be labeled as multi-user applications, computer-supported cooperative work (CSCW) applications or collaborative computing (Grudin, 1994). Some of the key features which groupware offers are a centralized location for data storage, possibilities for communication and improvement of groups’ problem solv-ing and collaboration capabilities (Marotta, 2006). Groupware can include specific features like bulletin boards, cooperative writing, e-mail/message system, meeting support systems, workflow systems, sharing of calendars and shared database/file access (Grudin, 1994). As can be seen in Figure 4.1, groupware applications can be placed somewhere between single-user applications, and larger mainframe systems in organizations. Groupware is often targeted at smaller groups than mainframe systems, meant for serving organizational goals. Groupware is also marketed as a product, as opposed to larger organizational systems, which are developed internal or contracted (Grudin, 1994).
When groupware was introduced it presented additional challenges to the ones known from single-user applications. Since individual persons interact with group-ware applications, it has the same challenges as a single-user application, in addition to new challenges from multi-user environments and group processes (Grudin, 1994). The challenges presented in this chapter are taken from articles written by Jonathan Grudin (Grudin, 1994, 1988), where he explains why so many groupware applications fail to meet the expectations of the users. The challenges are presented below.
CHAPTER 4. GROUPWARE CHALLENGES
Figure 4.1: Development and research contexts (Grudin, 1994)
4.1
Disparity in work and benefit
The use of groupware applications will not always provide the same benefit for each person that is using the application. Even though groupware provides a collective benefit, some people will have to do additional work to create this benefit, without necessarily receiving a direct benefit from using the application themselves. In some cases this can lead to the application failing. An example of this problem is the use of an automatic meeting scheduling feature in an electronic calendar. The concept is that the meeting scheduler checks each person’s individual calendar to find an appropriate time for a meeting. The question for this type of feature is who actually benefits from using it. In this case, it is most likely the manager, who initiates the meeting. The subordinates who shall participate in the meeting would have to do most of the work by maintaining their electronic calendars. To avoid this problem the ideal solution is for the developers to make groupware where the work is equally divided amongst the contributors, or at least minimize the extra work required. This is, however, not possible in all situations. An example of a successful groupware application where there is a good balance between work and benefit is e-mail.
4.2
Critical mass
The critical mass challenge is based on the concept that a groupware application is only useful if a high percentage of the persons in the group are using it. People may for instance have different preferences when it comes to choosing a word processor, but if they shall collaborate on a document they have to use the same collabora-tion tool. Obtaining the critical mass is essential to achieve the full advantage of groupware applications. To use the example of the electronic meeting scheduler, studies have shown that electronic calendars are mostly used as a communication device, and are not maintained properly by each contributor (Ehrlich, 1987). For
CHAPTER 4. GROUPWARE CHALLENGES
an electronic meeting scheduler to be successful, it is required that all the people in the group maintain their personal calendar at all times. Thus, in some cases, a drop-out of only one or two persons will result in the groupware application failing.
4.3
Disruption of social processes
People may resist the use of groupware if it interferes with complex social group dynamics. People are often guided by social, motivational, political and economic factors which are subtle and non-explicit factors which are hard to define in a devel-opment process of an information system. To handle this challenge it is important to consider the extent of the problem, and involve relevant users in the development process of groupware to get advice and insight in relevant social processes.
4.4
Non-standard use
Non-standard use of groupware applications is a challenge concerning how things are supposed to work and how they actually work in practice. Groupware is mostly designed to support standard procedures, but sometimes people make shortcuts and modifications which in many cases are exceptions which are not supported by the application. To handle this challenge it is important to learn how the work is actually done. The use of customizable systems can add flexibility, but customizing is also a challenge since people do not know the detailed organizational functioning and how people will be affected by the changes.
4.5
Unobtrusive accessibility
As features for supporting group processes in groupware are used relatively infre-quently, it will require an integration with the more heavily used features for indi-vidual activity. The challenge is to create good design for infrequently used features. This leads to two important points when developing support for groupware. The first is that group support features will be better if they are integrated with features that support individual activity. An example is word processors and collaborative writing on a document. Instead of developing a standalone groupware application for collaborative writing, this feature should be integrated in the one used for individual writing. The second point is that the features should be designed to be unobtru-sive, but still accessible for the users, without obstructing the more frequently used features. The key is to keep a good balance.
CHAPTER 4. GROUPWARE CHALLENGES
4.6
Difficulty of evaluation
Analysis, design and evaluation of multi-user applications are more difficult than for single-user applications. The main reason for this is the concern of the group mem-bers and not only an individual user. Different people using the same system have different backgrounds, jobs and preferences on how things should be done. In this way development of single-user applications can focus on a lowest common denom-inator, while development of groupware applications have to focus on all possible denominators (Grudin, 1988). Evaluation of groupware systems requires a different approach, based on methodologies from social psychology, making the evaluation more advanced. However, there will be a lower degree of difficulty in evaluating groupware systems if the groups in question are smaller and more homogeneous.
4.7
Failure of intuition
Intuitions in product development of groupware applications are generally poor. As mentioned in Section 4.6 it is hard for the decision-makers and managers to see the difficulty of developing and evaluating a groupware application. People’s intuitions are often good when it comes to seeing the utility value for people similar to themselves, making the decisions-makers overlook and underestimate the extra work required to receive the actual benefit of the new application. The challenges in decision-making affect the design process, making it more vulnerable to errors. As for the evaluation in Section 4.6, the intuition will be less unreliable for smaller and more homogenous groups. To overcome this challenge it is important to bring in the potential users early in the decision phase.
4.8
The adoption process
Managing the acceptance of groupware is another challenge which has to be taken into account. The introduction of new groupware can be difficult and if the wrong strategy is used, the product will fail. Take for instance off-the-shelf sale. If a single-user application like a word processor is liked by one out of five customers it is likely to be a success. On the other hand, a groupware application that only appeals to one out of five persons in an organization would be failure (critical mass). It is important to introduce groupware in a cautious way and have the challenges described in the above sections in mind when planning, developing and introducing new groupware.
Part III
Chapter 5
Survey
1
A survey is a qualitative method for collection of data gathered from a given sample of people to create statistical information about some topic. Surveys are usually standardized which means that all the people in the sample will get the same ques-tions. Surveys are one of the most used data collection techniques within social science, but also in the business sector to do market and organizational surveys (Ringdal, 2001).
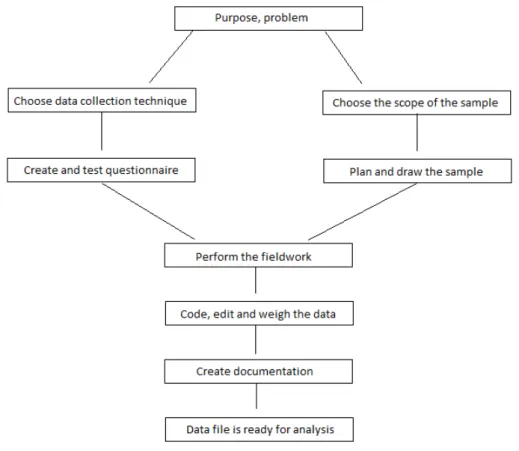
The steps in the design of a survey are presented in Figure 5.1. A survey starts by defining the purpose and the problem the researcher would like to look into. The size of the objective for the surveys varies, and for smaller surveys performed by scientists or students, the objective is often bound to the purpose of the report or the thesis. The next steps are split into two paths as seen in Figure 5.1. One path is used to choose a data collection technique, then formulate the questions, and do a pilot test. The pilot test gives feedback on problems which should be fixed before the main survey. The second path is about the scope of the sample. The scope of the sample is the population which the sample is taken from. To plan the sample the researcher must define how large the sample must be, and how it shall be drawn. When the planning phase is over the fieldwork can start. The goal for the fieldwork is to find and contact all the persons in the sample. The next step is the supplementary work, which varies in quantity based on the data collection technique that was chosen. The last step is to document the data. The documentation is called metadata2, and is important when the results from the survey shall be used by people who were not involved with the survey. When all these steps are performed the data are ready for analysis to check its reliability and validity.
There are several types of data collection techniques, and surveys are usually per-formed with personal-visit interview, phone interview or questionnaire (self admin-istrated survey). In some cases a combination of techniques is used, for instance
1The main source for this chapter: (Ringdal, 2001) 2Metadata is data that describes other data
CHAPTER 5. SURVEY
Figure 5.1: Steps in a survey (Ringdal, 2001)
a mix between personal-visit interview and questionnaire. The personal-visit inter-view is based on a face to face interinter-view where the interinter-viewer reads the questions for the respondent. The advantages of using this technique are that it is flexible, and that the interviewer can motivate the respondent and solve possible misunder-standings which may occur by giving follow-up questions. The main disadvantage is the high cost. The reason for this is that the researcher has to make appointments and visit all the respondents. This requires some organization. Other disadvantages are that it takes long time to perform and that the interviewer can influence the answers. The privacy protection in personal-visit interviews is low as the interviewer is present and that other people can overhear the interview. The phone interview is limited to auditory communication and the consequence of this is that the number of answer alternatives have to be low. An advantage of using phone interview is that it is cheaper than personal-visit interview. It can be performed quickly as all the communication is done from the same place. It is also easier to reach out to people which are geographically scattered. The disadvantages of using this technique is that the researhcer has to perform short interviews which can be superficial, and that people might deny to answer by hanging up on you. The privacy protection of the phone interview is average. As for personal-visit interview, people can overhear the interview. With questionnaire the respondent reads both the questions and the
CHAPTER 5. SURVEY
answer alternatives at the same time. The advantages of using this technique are that it can be performed by only one person, and that it is by far the cheapest alternative. As for phone interview it can reach out to a large sample of people which are geographically scattered. There is a great degree of freedom in answering for the respondents and the performance time varies depending on the technical so-lution selected. The disadvantages are that questionnaire can give a high drop-out rate, and that there is little opportunity to control the process as the performance is completely up to the respondent.
Open and closed questions are two measuring techniques which are used for sur-veys. Open questions are questions where the respondent can answer freely, while closed questions have answer alternatives. The most used format for the closed questions is the Likert scale (Ringdal, 2001). Here the researcher base his questions on statements which are graded by the respondent. Each statement has from three to seven answer alternatives, for instance strongly disagree; disagree; neither agree or disagree; agree; strongly agree.
When formulating questions it is important to adapt them to the target group and not overestimate their knowledge level. Advanced/technical terms should not be used, unless the target group is some sort of experts, like for instance computer engineers or computer science students. It is also advantageous to create short questions. Longer questions can be hard to comprehend for the respondent and can be interpreted in the wrong way. For beginners it would be smart to reuse questions from other surveys as these questions have been tested before.
It is important to get a representative sample of people when doing a survey. A sample plan for a survey usually consists of these elements (Ringdal, 2001):
1. A sample scope which consist of a list that the sample can be drawn from. 2. Random drawing of persons from the list.
3. A mechanism which ensures that key groups in the sample are represented. There are several techniques to draw a sample. Simple random sampling (SRS) is used when the researcher wants the same probability for all the people in the sample. Stratification can be used if the researcher likes to ensure that important groups are represented or overrepresented in the sample. Group selection is another technique where samples of groups or sample areas are drawn. Afterwards, a sample from these groups is drawn by SRS. In addition to this, there are techniques for non-probability selection and selection of rare populations (Ringdal, 2001). It is also important to consider the size of the sample. It is possible to calculate the necessary sample size based on the required precision. The estimates which are based on the results of the survey have error margins which decrease as the sample gets larger.
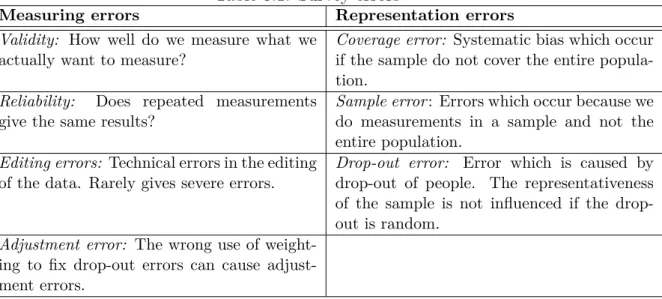
It is also important to minimize the size of total survey errors. We usually separate between measuring errors and representation errors. Different types of measuring
CHAPTER 5. SURVEY
and representation errors are presented in Table 5.1. Table 5.1: Survey errors
Measuring errors Representation errors
Validity: How well do we measure what we actually want to measure?
Coverage error: Systematic bias which occur if the sample do not cover the entire popula-tion.
Reliability: Does repeated measurements give the same results?
Sample error: Errors which occur because we do measurements in a sample and not the entire population.
Editing errors: Technical errors in the editing of the data. Rarely gives severe errors.
Drop-out error: Error which is caused by drop-out of people. The representativeness of the sample is not influenced if the drop-out is random.
Adjustment error: The wrong use of weight-ing to fix drop-out errors can cause adjust-ment errors.
Chapter 6
Interview
1
The purpose of the interview is to gather information about a topic of interest by the researcher, rather than measuring variables like you do in a survey. An interview is usually performed to get information from a subject (the interview respondent) which have knowledge and experiences that the researcher is interested in. The interview is based on a conversation between the interviewer and the respondent and mostly open questions are used. An exception from their mode of operation is when registering background information about the respondent where standardized (closed) questions are more suited.
The content and the number of respondents needed for the interview will depend on the purpose of the interview. If the purpose of the interview is to get knowledge and information about a process in a company, a few respondents can be sufficient to give a good description. In other cases the purpose can be to understand how people experience a specific situation. In this case it will be necessary to interview more respondents as each person might have a different experience about the situation. To maintain a structure when doing the interview an interview guide should be created. The interview guide is a set of questions which can be used by the researcher during the interview. The questions in the interview guide can vary from keywords to completely formulated open questions. How the interview guide is created depends on the purpose of the interview. For people who are not experienced in performing interviews it is a good idea to have formulated the questions in advance. The interview guide is supposed to be used as a guidance to make sure that the researcher gets the information that he needs.
It is important to notice that there is a difference between the interview which is described in this chapter and the structured interview which is used in surveys (See Chapter 5). The structured interview consists only of closed questions and is less flexible than the interview which is presented here. In some cases it might be
CHAPTER 6. INTERVIEW
appropriate to use a combination of these two interview techniques, where important questions are given to all the respondents.
The interview usually starts with an introduction where the purpose of the interview is explained and the respondents get assured that the information from the interview is kept confidential (if this is necessary). In the beginning of the interview some people like to register some background information about the respondents which can be used when analyzing the interview afterwards. The interview guide is used as a manuscript to give the interview a structure. In some cases it is important that the interviewer follow up the answers to get as much information as possible. The follow-up questions can either be semi-planned questions taken from the interview guide, or improvised as the interview progress. The need for using follow-up questions depends on the respondent. Some respondents tell long stories where there is no need to interrupt, while others nearly have to be "forced" to give answers. Thus, the success of the interview depends both on the respondent and the relation between the interviewer and the respondent.
During the interview, the interviewer should behave in a neutral and non-leading way towards the respondent, so that he is not influenced in any way when giving answers. As there is room for improvisation in an interview, there is a risk that the interviewer will influence the respondent. To avoid this it is wise to prepare some follow-up questions in advance. It is also important for the interviewer to be aware of, and note the respondent’s use of body language, as this can be important when analyzing the interview.
To register information from the interview there are three methods; take notes, sound recording or video recording. The most common way is to use sound recording. This has to be approved by the respondent before starting the interview. When using sound recording the interviewer can focus entirely on the respondent and all the information is captured by the recording equipment. After the interview, the sound recording has to be transcribed so that the interview can be analyzed. Video record-ing is similar to sound recordrecord-ing and should be used if the interviewer/researcher need visual information from the interview. The problem with video recording is that many respondents tend to deny the use of it during the interview. In some cases respondents will also deny the use of sound recording, and in that case you have to register the information by taking notes. The problem with taking notes is that the interviewer can be too occupied with taking notes and miss important information from the respondent. Taking notes is also well suited when you use a relatively detailed interview guide. In this case the interviewer can keep track of the answers by using the question numbers to structuring the notes. When taking notes it is important to transcribe the interview shortly after it is finished, as the interview notes are probably mostly keywords. In this way the interviewer will not forget important information. The interviewer will also have the advantage of being able to leave out irrelevant information at once, which will not be possible when transcribing the interview based on a sound or video recording.
CHAPTER 6. INTERVIEW
Doing a measure of validity, reliability and generalization can be difficult for a qualitative research method like interview. This is because the qualitative research methods are just collecting data, rather than measuring predetermined variables as in the quantitative research. Validation says something about whether we actually measured what we intended to measure. This validation process has to be done by the researcher/interviewer or the participants in the interview. Reliability of the interview is based on random measuring errors which can be difficult to indentify for the researcher. Doing a statistical generalization of the results from interviews is possible, but there are rarely enough interviews to do this. Even though the sample for the interview is large enough, it can be difficult for the researcher to do a generalization as the interview is unstructured. This means that the interview does not use standardized questions where the answer can be measured for all the respondents.
Part IV
Chapter 7
It’s Learning survey
In this chapter we present the execution and results from the user acceptance survey about It’s Learning. The survey is performed to get additional results to the ones presented in the specialization project report (Grønland, 2009), were a similar survey was performed. The chapter will start by describing the purpose of the survey. Then we will describe the research model which is used to create the survey, and present the structure of the survey. After this we describe the execution of the survey and present the results.
7.1
Purpose of the It’s Learning survey
The purpose of this study is to use the research model, which is presented in Section 7.2, as frawework model for performing a survey that measure the user acceptance of It’s Learning. The goal is to see if the students are satisfied with It’s Learning as a LMS for their university/university college. By doing the survey we will see if the results will support the results from the survey which was performed in the specialization project (Grønland, 2009), but also help us identify other problems and potential of improvement with It’s Learning. A more specific purpose of each of the samples included in the survey is described in Section 7.4.
7.2
The research model
The user acceptance survey is based on a technology acceptance model, which we have created, that combines elements from both TAM and UTAUT. The research model was created to better adapt to It’s Learning. The reason for creating a new model, instead of using one of the existing models which were presented in Chapter 3, was based on the experience from the It’s Learning survey in the specialization project (Grønland, 2009). As mentioned in the introduction of the report we used TAM and the TAM 2 framework as a basis for creating the survey in the