Washington University in St. Louis
Washington University Open Scholarship
Engineering and Applied Science Theses &
Dissertations McKelvey School of Engineering
Spring 5-15-2015
Interfacial Chemistry of Trace Elements at Mineral
Surfaces in Engineered Water Systems
Lin Wang
Washington University in St. Louis
Follow this and additional works at:https://openscholarship.wustl.edu/eng_etds Part of theEngineering Commons
This Dissertation is brought to you for free and open access by the McKelvey School of Engineering at Washington University Open Scholarship. It has been accepted for inclusion in Engineering and Applied Science Theses & Dissertations by an authorized administrator of Washington University Open Scholarship. For more information, please [email protected].
Recommended Citation
Wang, Lin, "Interfacial Chemistry of Trace Elements at Mineral Surfaces in Engineered Water Systems" (2015).Engineering and Applied Science Theses & Dissertations. 99.
WASHINGTON UNIVERSITY IN ST. LOUIS School of Engineering and Applied Science
Department of Energy, Environmental and Chemical Engineering
Dissertation Examination Committee: Daniel E. Giammar, Chair John D. Fortner, Co-Chair
Richard L. Axelbaum Jeffrey G. Catalano
Phillip A. Skemer Jay R. Turner
Interfacial Chemistry of Trace Elements at Mineral Surfaces in Engineered Water Systems
by Lin Wang
A dissertation presented to the Graduate School of Arts & Sciences
of Washington University in partial fulfillment of the requirements for the degree
of Doctor of Philosophy
May 2015 St. Louis, Missouri
ii
Table of Contents
List of Figures ... v
List of Tables ... viii
Acknowledgments... ix
Abstract of the Dissertation ... xiv
Chapter 1: Introduction ... 1
1.1 Background and Motivation ... 1
1.1.1 Project 1: Interfacial Chemistry Between As(III) and Lepidocrocite ... 1
1.1.2 Project 2: Trace Element Mobilization during Shale-fluid Contact ... 6
1.2 Research Objectives ... 12
1.2.1 Project 1 Objectives ... 12
1.2.2 Project 2 Objectives ... 13
1.3 Research Approach and Overview of Dissertation ... 13
Chapter 2: Effects of pH, Dissolved Oxygen, and Aqueous Fe(II) on the Adsorption of Arsenic to Lepidocrocite ... 16
Abstract ... 17
2.1 Introduction ... 18
2.2 Material and Methods... 20
2.2.1 Materials ... 20
2.2.2 Lepidocrocite Generation ... 21
2.2.3 Equilibrium Adsorption Experiments ... 22
2.2.4 Effect of Fe(II) ... 23
2.2.5 Dissolved Arsenic Speciation ... 23
2.2.6 Analytical Methods ... 24
2.2.7 Surface Complexation Modeling ... 24
2.3 Results and Discussion ... 25
2.3.1 Equilibrium As(III) Adsorption ... 25
2.3.2 Equilibrium As(V) Adsorption ... 28
2.3.3 Surface Complexation Modeling ... 30
2.3.4 Impact of Fe(II) on As(III) Adsorption on Lepidocrocite ... 33
iii
Acknowledgements ... 40
Chapter 2. Supporting Information ... 41
Chapter 3: Impact of Water Chemistry on Element Mobilization from Eagle Ford Shale... 50
Abstract ... 51 3.1 Introduction ... 52 3.2 Experiment Protocols ... 54 3.2.1 Materials ... 54 3.2.2 Solid Characterization ... 55 3.2.3 Batch Experiments ... 56 3.2.4 Analytical Methods ... 58
3.2.5 Chemical Equilibrium Modeling ... 59
3.3 Results and Discussion ... 59
3.3.1 Core Sample Composition. ... 59
3.3.2 Summary of Mobilization Results ... 63
3.3.3 Effects of Solution pH... 63
3.3.4 Oxidant Level Effect ... 68
3.3.5 Solid:Water Ratio Effect ... 70
3.4 Conclusions ... 72
Acknowledgements ... 73
Chapter 3. Supporting Information ... 74
Chapter 4: Element Mobilization from Bakken Shales as a Function of Water Chemistry ... 85
Abstract ... 86
4.1 Introduction ... 87
4.2 Materials and Methods ... 90
4.2.1 Materials ... 90
4.2.2 Solid Characterization ... 91
4.2.3 Batch Experiments ... 91
4.2.4 Analytical Methods ... 93
4.3 Results and Discussion ... 96
4.3.1 Sample Composition ... 96
4.3.2 Effects of Solution pH and Citrate ... 98
iv
4.3.4 Solid:water Ratio Effect ... 104
4.3.5 Temperature Effect ... 105
4.3.6 Salt Effect ... 106
4.4 Environmental Implications ... 110
Acknowledgement ... 111
Chapter 4. Supporting Information ... 112
Chapter 5: Conclusions and Recommendations for Future Work ... 129
5.1 Conclusions ... 129
5.1.1 Project 1 Conclusions... 129
5.1.2 Project 2 Conclusions... 130
5.2 Recommendations for Future Work ... 133
5.2.1 Recommendations for Project 1 ... 133
5.2.2 Recommendations for Project 2 ... 135
References ... 137
Appendix A: Competitive Adsorption of Arsenic and Phosphate ... 158
Appendix B: Effect of 2-Propanol on Lepidocrocite Colloidal Stability ... 163
B.1 Experiment... 163
v
List of Figures
Figure 1.1: pe-pH diagram for predominant arsenic species in water at 25 °C and 1 bar total
pressure with 10-6 M (75 µg/L) total arsenic concentration [adapted from (Cherry et
al., 1979)]. The blue shaded area indicates the range of most natural waters……… 3
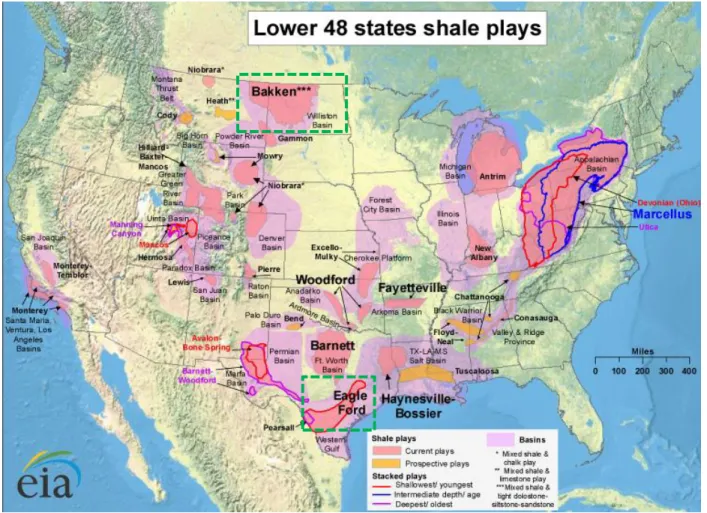
Figure 1.2: Map of U.S. shale gas and shale oil plays (U.S. EIA, 2011) with Eagle Ford Formation and Bakken Formation highlighted………... 7
Figure 1.3: Illustration of a horizontal well showing the water lifecycle and natural gas flow during hydraulic fracturing (Schmidt, 2008)……….. 9
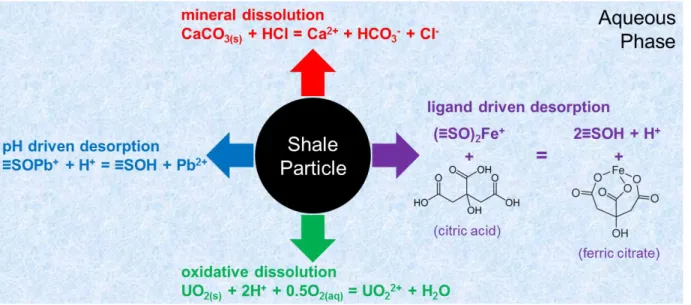
Figure 1.4: Illustration of possible chemical pathways of element mobilization from shales during shale-fluid interaction………11
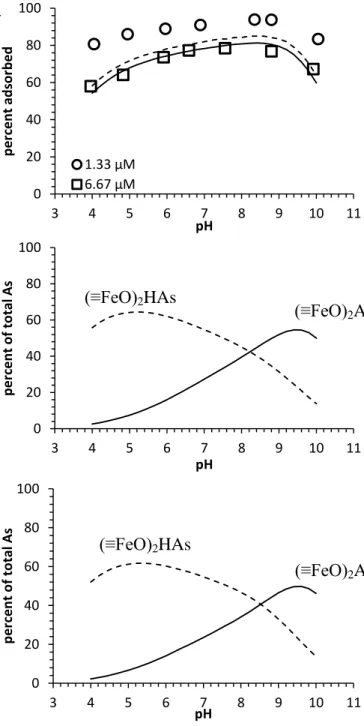
Figure 2.1: (a) As(III) adsorption edges on lepidocrocite at 1.33 and 6.67 µM total As(III) concentrations together with predicted surface speciation for (b) 1.33 µM As(III) and (c) 6.67 µM As(III). Experimental data at 50 h adsorption are shown as markers; SCM predictions are shown as lines. All experiments were performed in a glovebox with N2/H2 passed over a heated Pd catalyst….………...…26
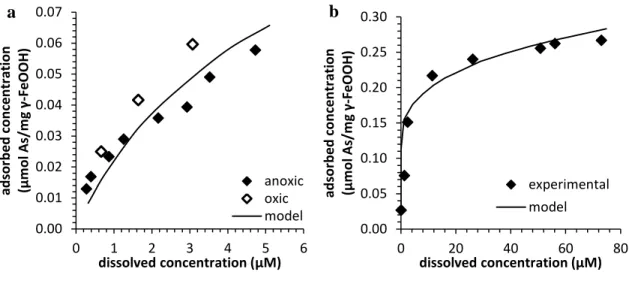
Figure 2.2: Adsorption isotherm-style data for (a) As(III) at pH 7.5 and (b) As(V) at pH 4. The line represents of the prediction from the same surface complexation model used to simulate adsorption edges in Figures 1 and 3. Experiments for As(III) adsorption in the anoxic series were performed in a glovebox with N2/H2 with the atmosphere circulated over a heated Pd catalyst.……….. ………...…………28
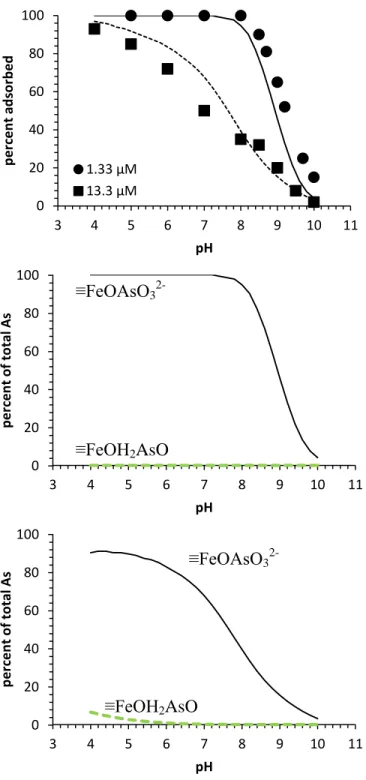
Figure 2.3: (a) As(V) adsorption edges on lepidocrocite at 1.33 and 13.3 µM total As(V) concentrations together with predicted surface speciation at (b) 1.33 µM As(V) and (c) 13.3 µM As(V). Experimental data at 50 h adsorption are shown as markers; SCM predictions are shown as lines………..29
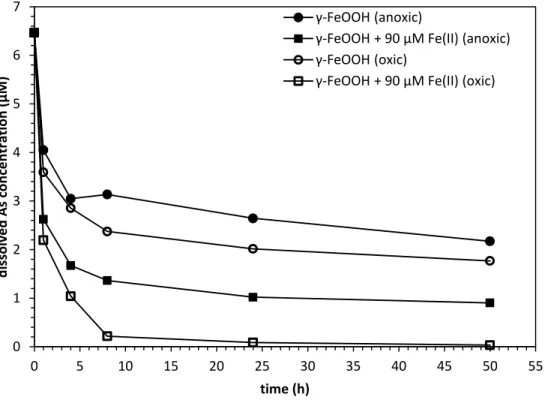
Figure 2.4:Dissolved arsenic concentration profile with (squares) and without (circles) 90 µM Fe(II) in anoxic (closed symbols) and oxic (open symbols) conditions at pH 5.6. All experiments started with 6.67 µM (500 µg/L) As(III). Data are shown as the average of the duplicates, and the relative standard deviations between replicates were always below 5%...34
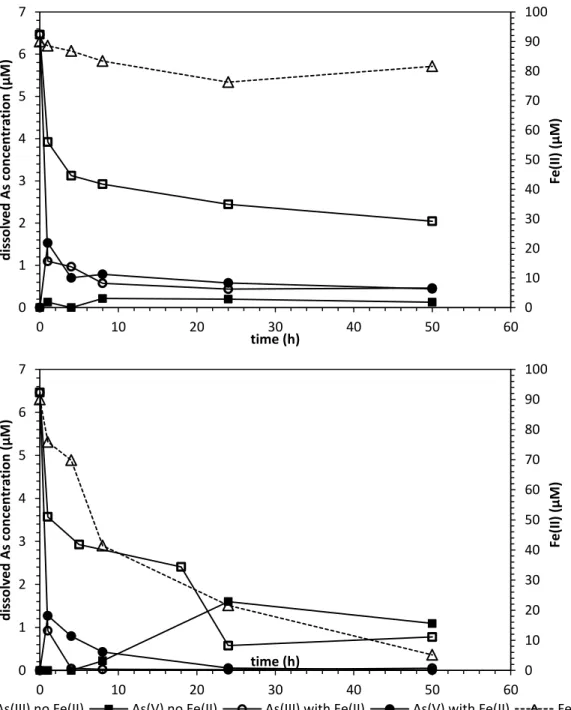
Figure 2.5:Dissolved arsenic speciation and Fe(II) concentration in (a) anoxic and (b) oxic conditions at pH 5.6. All experiments started with 6.67 µM (500 µg/L) As(III). Experiments with Fe(II) had an initial Fe(II) concentration of 90 µM. Data are shown as the average of the duplicates, and the relative standard deviations between replicates were always below 5%...35
vi
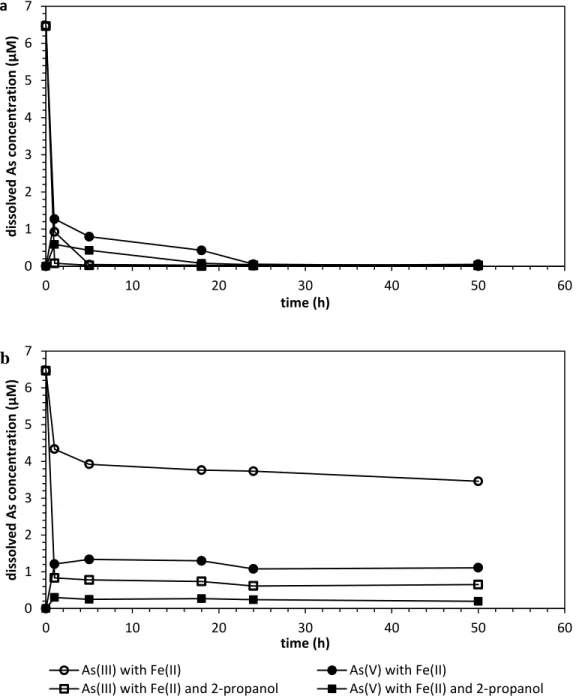
Figure 2.6:Dissolved arsenic speciation in the presence of Fe(II) and O2 with/without 2-propanol at (a) pH 5.6; (b) pH 4. All experiments started with 6.67 µM (500 µg/L) As(III) and 90 µM Fe(II). The concentration of 2-propanol was 15 mM. Data are shown as the average of the duplicates, and the relative standard deviations between replicates were always below 5%...38
Figure 3.1: Final aqueous concentrations of (a) Ca, Mg, Ba and (b) Fe, As, U after 96 hours of reaction with pH adjustment (Experiments 1-7). Experiments were performed at room temperature with 1 g/L shale loading. Data are shown as the average of the duplicates with the error bars being the standard deviations……….64
Figure 3.2: Relationship between the final aqueous concentrations of Mg, Ba, Fe, As and U and the final Ca concentrations in experiments with pH adjustment (Experiments 1-7). Experiments were performed at room temperature with 1 g/L shale loading. Data are shown as the average of the duplicates………..66
Figure 3.3: Metal and sulfate mobilization after 120 hours of reaction under anoxic (Experiment 8), atmospheric (Experiment 12) and oxidative conditions (Experiment 9-11). Experiments were performed at room temperature with 1 g/L shale loadings. A
1.5% (3%) H2O2 solution was prepared fresh for groups marked with 1.5% (3%)
H2O2. The 1.5%+1.5% H2O2 group started with 1.5% H2O2, and was reacted for 24
hours before the addition of another 1.5% H2O2 (3% total H2O2 concentration
thereafter). Data are shown as the average of the duplicates with error bars being the
standard deviations. The Fe and U concentrations with H2O2 were below detection
limits. The atmospheric and oxidative condition experiments were open to the laboratory atmosphere, and the anoxic experiments had headspaces with 400 ppm
CO2………66
Figure 3.4: Comparison of measured and predicted solution compositions based on calcite equilibrium. Predictions are shown as lines for a system with calcite open to an
atmosphere with a CO2 partial pressure of 10-3.46 atm (dashed line) and for a system
closed with respect to exchange with the atmosphere (solid line) for systems to which acid or base had been added to yield the pH range shown. The predicted pH and calcium concentrations without acid or base addition are shown as the + and x for the open and closed system, respectively. The other markers (open triangle, diamonds, squares and circles) are data from different experiments………67
Figure 3.5: Metal and sulfate mobilization with different solid:water ratios (1, 2, 10 g/L) after 120 hours of reaction. Experiments were performed at room temperature and open to the atmosphere. Data are shown as the average of the duplicates with error bars being the standard deviations………71
vii
Figure 4.1: Powder X-ray diffraction (XRD) patterns of samples. The reference patterns of five minerals from the International Centre for Diffraction Data database are shown for comparison………97
Figure 4.2: Final metal concentrations after 120 hours of reaction with (a) Sample 1 and (b) Sample 2 at pH 1.5 (Experiment 10), pH 4 and 8 (Experiments 1 and 2) and pH 4 with citrate (Experiment 11). Experiments were performed at room temperature
(22℃) with 1 g/L shale loading. Data are shown as the average of the duplicates
with the error bars being the standard deviations. In Experiment 10, pH stabilized at 1.5 upon HCl addition at the beginning of the reaction to achieve a total HCl concentration of 66 mM. In the other experiments, an autotitrator was used to control the suspension pH at 4.00±0.02 or 8.00±0.05……….100
Figure 4.3: Metal, sulfate and NPOC mobilization after 120 hours of reaction with (a) Sample 1 and (b) Sample 2 under anoxic (Experiment 3), atmospheric (Experiment 5) and oxidative conditions (Experiments 4 and 12). Experiments were performed at room
temperature (22℃) with 1 g/L shale loadings. Data are shown as the average of the
duplicates with error bars being the standard deviations. The atmospheric and oxidative condition experiments were open to the laboratory atmosphere, and the
anoxic experiments had headspaces with 400 ppm CO2. For anoxic and atmospheric
conditions, pH stabilized at 8.0±0.2 without adjustment. For oxidative conditions
(with H2O2 or persulfate), an autotitrator was used to control the suspension pH at
8.00±0.05……….101
Figure 4.4: Metal, NPOC and anion concentrations with different solid:water ratios (Experiments 5 and 8) after 120 hours of reaction with (a) Sample 1 and (b) Sample
2. Experiments were performed at room temperature (22℃), without pH adjustment
and open to the atmosphere. Data are shown as the average of the duplicates with error bars being the standard deviations………..107
Figure 4.5: Metal, NPOC and sulfate concentrations at different temperatures (Experiments 5-7 and 13) after 120 hours of reaction with (a) Sample 1 and (b) Sample 2. Experiments were performed without pH adjustment and open to the atmosphere. Data are shown as the average of the duplicates with error bars being the standard deviations……….108
Figure 4.6: Metal and NPOC concentrations with and without salt (Experiments 5 and 9) after 120 hours of reaction with (a) Sample 1 and (b) Sample 2. Experiments were
performed at room temperature (22℃), without pH adjustment and open to the
atmosphere. Data are shown as the average of the duplicates with error bars being the standard deviations. A concentration of 10 g/L NaCl was used as the salt matrix………...109
viii
List of Tables
Table 1.1: Volumetric composition and purposes of typical constituents of hydraulic fracturing fluid (Gregory et al., 2011)……….10
Table 2.1: Reactions and parameters used for surface complexation modeling of As(V) and As(III) adsorption on lepidocrocite………… ………..………….31
Table 3.1: Conditions and variables explored in the experiments performed……….57
Table 3.2: Quantitative XRD analysis of core samples compared with reported ranges of Eagle Ford sample properties………...61
Table 3.3: Physical and chemical properties of core samples compared with reported ranges of Eagle Ford sample properties……….62
Table 4.1: Conditions and variables explored in the experiments performed……….94
Table 4.2: Physical and chemical properties of core samples compared with reported values of Bakken sample properties………...95
ix
Acknowledgments
While writing these words, I am realizing that this is the easiest part of the entire thesis because these words flow naturally from my heart instead of my brain.
I am extremely thankful to both of my co-advisors, Dr. Daniel Giammar and Dr. John Fortner, for their constructive guidance, powerful motivation, and broad expertise. I am very fortunate to have received constant support and encouragement from two great mentors with complementary personalities and working styles. Their intellectual curiosity about the unknown and incessant dedication to high quality research have always been a source of inspiration to me. From them, I have learned the artistry of critical thinking and rigorous reasoning. Due to their leadership, I gained the benefits of working in two collaborative research groups. I remain indebted to both of my advisors because their mentorship has helped me become a better person.
I am appreciative of Dr. Jeff Catalano, Dr. Phil Skemer, Dr. Jay Turner and Dr. Richard Axelbaum for agreeing to serve on my thesis committee. Each of them, with expertise in their own field, has provided me with novel perspectives and insightful suggestions. I have benefited greatly from the individual and committee meetings with my committee members because their input helped me identify key research questions, tailor research approaches, and stay focused on the most critical objectives.
I could not have completed my work so smoothly without the assistance from a group of highly responsible and warm-hearted people. My sincere thanks go to Patty Wurm, Jennifer Houghton, Sanmathi Chavalmane, Paul Carpenter and Haesung Jung for their time in training me on and assisting me with the analytical instruments. I am appreciative of the great staff inside and outside our department: Tim McHugh for always providing solutions to my IT-related problems, Rose Baxter for her constant patience with my questions, and Beth Mehringer, Trisha
x
Sutton, and Lynn Zaltsman for making my graduate student life so much easier. Portions of my work were performed when I was a visiting student research collaborator in the Department of Civil and Environmental Engineering at Princeton University. I appreciate Dr. Catherine Peters, Dr. Jeffrey Fitts, Dr. Peter Jaffe and Dr. Satish Myneni for providing input on my research projects. I would also like to acknowledge Joseph Vocaturo, Lori Tunstall, John Higgins and Elizabeth Lundstrom for their assistance with my experiments and analyses.
Over the course of the past four years, I have increasingly realized the importance and benefits of working in a collaborative rather than competitive environment. I have had the
fortune to do so, owing to a group of great colleagues. The Aquatic Chemistry Laboratory (ACL) is an enjoyable place to work and study, where I have grown from a novice to a competent researcher. The members in the group that were senior to me, including Yin Wang, Zimeng Wang and Fei Wang, all helped in leading me towards the right track of research. Vrajesh Mehta, a role model for me in both work and life, was always available and ready to assist me. Wei Xiong, Chao Pan, Zezhen Pan and Peng Liao, never hesitated to help me out. My special
gratitude goes to Dr. Jose Cerrato, who not only gave me constructive advice on my research but also shared with me his insightful ideas about life. Jiewei Wu, Yi Jiang, Wenlu Li and Dr. Seung Soo Lee in Dr. John Fortner’s group have also offered me tremendous help. I am very grateful to Begum Karakocak, a former visiting student and a current PhD student in our department, for collaborating with me to initiate my second project. Jessica Ray and Jake Meyer were more than willing to answer my questions whenever I had any. I also had the opportunity to work with two very bright and hardworking undergraduate students, Xiaochen Zuo and Scott Burns, who made important contribution to my projects. I enjoyed this mentoring experience very much because through them I saw myself growing and developing.
xi
I am thankful for my caring and supportive friends that always stand by me regardless of the circumstances. I will always treasure the memory of growing up with like-minded friends, including Linjia Mu, Dongrui Li, Dongjin Cui and Yang Zhang. I will never forget the summer of 2010 when Lian He, Zhaobang Liu and myself flew half way around the world and settled down in St. Louis. I am indebted to the people who have served as my mentors in some way, such as Jiuqing Zhao, Xiao Dong, Xiao Sun, and Xiaolong Liu. I am grateful for Karen Davis, Kathy Orchen, and Amy Doll for hosting me in their house/apartment and providing me with the best living conditions possible. My thanks go to Le You, Yaping Zhang, Jia Luo, Guannan He, Ruiye Ni, Xiaonan Yu, Yuwen Wang, Hao Yang, Guoxi Xu, Jianqing Li, Liang Gao, Yu Wang, Chi Zhang and many, many others.
Thanks to my advisor Daniel Giammar, I had the chance to be a visiting student research collaborator at Princeton University in the academic year of 2012-2013. I cherished this
rewarding experience because of the amazing people I got to know during that time. Bin Guo, Hang Deng, Qi Li, Ping Lu and Sili Deng have supported me through my ups and downs. Dan Li and Maofeng Liu were always ready to help me. My heartfelt gratitude goes to Peng Zhao, who inspired me to become a better and stronger person.
In addition to my research, I have had the privilege to work with a group of brilliant and enthusiastic student leaders on a variety of events and projects, including Maggie Majors, Junchen Gu, Shelina Remnarine, Ervin Malakaj, Nick Miller, Trung Tran, Mike De Wit and many others. I appreciate the mentorship from the Graduate School Associate Dean Elaine Berland and the Assistant Dean Kimberly Curtis. Learning from them, I have greatly broadened my horizons and improved my communication skills.
xii
This work was supported by research funding from The International Center for Advanced Renewable Energy and Sustainability (I-CARES) and the McDonnell Academy Global Energy and Environmental Partnership (MAGEEP). Both organizations were established in the global context of sustainable development, and I am beholden for their financial support that allowed me to work on two interesting research projects.
Finally, I owe it all to my endearing parents who have loved me unconditionally and supported me unreservedly. My generation of only children in China has often become the target of criticism from the mass media. People may think that I don’t have the “Little Emperor
Syndrome”, and I attribute it all to my parents that have shaped me into the person I am today. They have doted on me without spoiling me, disciplined me without controlling me, and advised me without pressurizing me. Because of their open-mindedness, I feel that my parents and I have grown up together, so in the years to come, I will care for them as they grow older the way they once did to raise me.
Lin Wang
Washington University in St. Louis May 2015
xiii
xiv
ABSTRACT OF THE DISSERTATION Interfacial Chemistry of Trace Elements at Mineral Surfaces in Engineered Water Systems
by Lin Wang
Doctor of Philosophy in Energy, Environmental and Chemical Engineering School of Engineering and Applied Science
Washington University in St. Louis, 2015 Professor Daniel Giammar, Chair Professor John Fortner, Co-Chair
This thesis research consists of two independent research projects that both studied interfacial chemical processes affecting trace elements at mineral surfaces.
The objectives of Project 1 were to 1) quantify the impact of water chemistry on As(III) adsorption on lepidocrocite, 2) develop a surface complexation model to describe equilibrium As(III) and As(V) adsorption to lepidocrocite and 3) elucidate the mechanism of Fe(II)-mediated As(III) oxidation at the lepidocrocite-water interface. Arsenic is a regulated element that can be found at high concentrations in groundwater resources that are used as drinking water sources. Iron (oxyhydr)oxides are one of the most abundant groups of minerals in soils and aquifers, and their presence can significantly affect the behavior of arsenic. Iron (oxyhydr)oxides are also commonly used as adsorbents in engineered system to remove arsenic from drinking water. In addition to adsorbing arsenic, Fe(III) minerals can participate in As(III) oxidation to As(V), which can reduce arsenic’s mobility and enhance its adsorption. Advances in the understanding
xv
of the environmental chemistry of arsenic are important to the development of water treatment technologies.
The adsorption of arsenic to lepidocrocite strongly depends on water chemistry. Experiments that pursued objectives in Project 1 examined As(III) and As(V) adsorption to lepidocrocite as a function of pH, total As(III) concentration, iron loading, Fe(II) and competing adsorbate presence. For the arsenic concentrations and Fe loadings studied, As(V) adsorption decreases substantially with increasing pH, while As(III) adsorption is less sensitive to pH changes, characterized by a stable level of high adsorption between pH 6-9. For As(III), the presence of oxygen promoted the overall arsenic adsorption via partial As(III) oxidation. A surface complexation model, optimized for both adsorption isotherms and adsorption edges, was able to describe the adsorption of both As(III) and As(V) to lepidocrocite over a broad range of conditions.
The concentration and oxidation states of dissolved arsenic measured over the course of a reaction provided information on As(III) oxidation. When dissolved oxygen and Fe(II) were not present, As(III) was not oxidized by the Fe(III) in lepidocrocite. At both oxic and anoxic
conditions, As(III) was oxidized to As(V) in systems that contained lepidocrocite together with Fe(II); this oxidation led to overall enhanced arsenic adsorption at near neutral pH. With oxygen, the pH-dependent generation of oxidants from the Fenton reaction drove the As(III) oxidation. In the absence of oxygen, the As(III) was probably oxidized by Fe(III) in lepidocrocite that had become more reactive upon reaction with Fe(II). The two reaction pathways could occur individually or in combination. Findings in Project 1 provide a deeper understanding of arsenic behavior in engineered water systems and are instrumental to manipulating the conditions under which arsenic is removed via adsorption.
xvi
The objectives of the second project were to 1) investigate the impact of water chemistry on trace element mobilization from shales during shale–fluid contact and 2) to identify the dominant mobilization pathways. The rapid development and expansion of hydraulic fracturing operations for enhanced energy recovery can affect water quality. The flowback and produced waters after injection of a fracking fluid could contain high total dissolved solids and trace elements mobilized from contact with shales. The concentrations of specific elements depend on the geochemistry of the formation, fluid composition, and time of shale–fluid contact. An
understanding of shale-bound element mobilization will facilitate wastewater management associated with hydraulic fracturing practices.
Experiments in Project 2 were performed to evaluate trace element mobilization from shales over a range of fluid chemistries with core samples from the Eagle Ford and Bakken formations that are currently producing natural gas and oil via hydraulic fracturing. Samples were characterized with regard to their mineralogy, surface area and total carbon prior to experiments. The fluid chemistry was varied in pH, oxidant level, solid:water ratio, and temperature. Analytical results from experiments and chemical equilibrium modeling were integrated to identify dominant mobilization pathways.
The Eagle Ford samples used in this research were rich in carbonates and quartz with minor amounts of kaolinite, albite, pyrite and 5 wt % total organic carbon. The release of most elements strongly depended on pH, which was primarily controlled by carbonate dissolution. The
introduction of oxygen and other oxidants (H2O2) significantly increased the amount of sulfate
over time; the sulfate generated had a direct impact on Ba concentrations due to the formation of
BaSO4 as a secondary phase. For these Eagle Ford samples, trace elements (such as As and U)
xvii
Major mineral phases in the Bakken Formation samples included quartz, K-feldspar, illite, dolomite and pyrite. One sample with 18.7 wt % total organic carbon was naturally enriched in redox-sensitive trace elements (including regulated elements such as As and U). For all the water chemistry variables studied (pH, oxidant level, solid:water ratio, temperature, salinity and chemical additive presence), pH and the oxidant level were properties that
dominated the behavior of most elements. The addition of chemical additives (HCl, citrate, and persulfate) affected element release mainly by altering system pH or redox conditions. The abundance of dolomite relative to pyrite determined the system pH when sufficient oxidants (such as oxygen and oxidizing chemical additives) were present. The lack of acid-neutralizing minerals, in case of sulfide mineral oxidation, may lead to a significant decrease in the pH. The knowledge gained in Project 2 provides insight on the key factors that dominant shale-bound element mobilization during rock-fluid interactions, and is helpful for understanding and managing produced and flowback water related issues associated with hydraulic fracturing.
1
Chapter 1: Introduction
1.1 Background and Motivation
This thesis consists of two independent research projects focusing on 1) interfacial chemistry between As(III) and lepidocrocite and 2) trace element mobilization during shale-fluid contact. Although distinct in their backgrounds, contexts, and funding sources, both projects are focused on similar interfacial chemical reactions and processes (such as adsorption and redox reactions).
The adsorption and redox transformation of arsenic at iron mineral surfaces may govern the distribution, mobility and fate of arsenic in natural and engineered systems. The interactions between arsenic and iron (oxyhydr)oxides are instrumental for arsenic removal with iron-based solids, in both concentrated water treatment facilities and point-of-use purification devices. Adsorption and redox reactions also affect the behavior of trace elements at shale-fluid interfaces for hydraulically fractured gas and oil production wells. Organic-rich shales are naturally
enriched in redox sensitive elements. The introduction of oxygen and other oxidizing additives during hydraulic fracturing may mobilize elements that are more soluble in oxidative forms. The change of pH and presence of complexing agents in a fracturing fluid may also affect mineral dissolution and even adsorption properties of elements.
1.1.1 Project 1: Interfacial Chemistry Between As(III) and Lepidocrocite
Arsenic in WaterArsenic is a toxic element that can be found at high concentrations in natural waters (Smedley and Kinniburgh, 2002). Sources of arsenic in aquatic systems are primarily natural soil
2
and rocks while human activities can influence hydrogeochemistry in ways that increase concentrations (Ferguson and Gavis, 1972; Harvey et al., 2006). The maximum contaminant level in the United States (U.S. EPA, 2009) and WHO guideline value (WHO, 2011) for arsenic in drinking water are both 10 µg/L. However, in some parts of south Asia, arsenic concentrations in groundwater can reach as high as 3000 µg/L and pose a severe threat to drinking water safety and public health (Chowdhury et al., 2000; Berg et al., 2001; Kinniburgh and Smedley, 2001; Fendorf et al., 2010; Kim et al., 2011; Jain and Singh, 2012).
Arsenic speciation in water is primarily governed by redox potential (pe) and pH (Figure 1.1). The most common forms of arsenic in water are inorganic oxyanions of As(III) and As(V), which can respectively be referred to as arsenite and arsenate (Jain and Ali, 2000). At
circumneutral conditions, As(V) exists primarily as ionic forms (H2AsO4- and HAsO42-), while
As(III) exists predominantly as the neutral molecular form (H3AsO3), and thus is generally
3
Figure 1.1 pe-pH diagram for predominant arsenic species in water at 25 °C and 1 bar total pressure with 10-6 M (75 µg/L) total arsenic concentration [adapted from (Cherry et al., 1979)]. The blue shaded area indicates the range of most natural waters.
Interaction between Arsenic and Iron (oxyhydr)oxides
Iron (oxyhydr)oxides are one of the most abundant minerals in natural systems and can strongly influence the fate and transport of arsenic (Cornell and Schwertmann, 2003). The
adsorption and desorption of arsenic to iron (oxyhydr)oxides present in aquifers can often control the mobility of arsenic in natural waters (Ferguson and Gavis, 1972; Fendorf et al., 2010). Iron (oxyhydr)oxides are also effective chemicals that are widely used in engineered systems to remove both As(III) and As(V) from drinking water (Jekel, 1994; Hering et al., 1997; Fields et al., 2000; Mohan and Pittman, 2007; Balasubramanian et al., 2009; Neumann et al., 2013; Wenk et al., 2014). The association of arsenic with iron (oxyhydr)oxides is strongly affected by
4
water chemistry. The adsorption of As(V) substantially decreases with increasing pH (Jönsson and Sherman, 2008; Wan et al., 2011) and is influenced by competitive adsorption with other groundwater solutes (Wilkie and Hering, 1996; Zeng et al., 2008). While As(III) adsorption is less pH-dependent and generally weaker than As(V), it can still be affected by competing adsorbates (Wilkie and Hering, 1996; Dixit and Hering, 2003).
A surface complexation model is a research tool for interpreting and predicting adsorption at solid-water interfaces. The surface of the solid is assumed to consist of specific functional groups that react with dissolved solutes to form surface complexes. The equilibrium of surface complexation and ionization can be described via mass balance equations with
correlation for variable electrostatic conditions (Davis and Kent, 1990). Surface complexation modeling (SCM) can often provide a good prediction of both As(III) and As(V) adsorption under varied conditions with regard to total arsenic concentration, type of iron oxide adsorbents, and the presence of competitive adsorbates (Wilkie and Hering, 1996; Manning et al., 1998; Gao and Mucci, 2001; Dixit and Hering, 2003; Fukushi and Sverjensky, 2007; Kanematsu et al., 2013).
Iron (oxyhydr)oxides can also participate in the oxidation of As(III) to As(V), which can potentially affect arsenic mobility and toxicity. Ferrihydrite was found to catalyze As(III) oxidation by oxygen on a time scale of several days to a week (Zhao et al., 2011). Photoinduced oxidation of As(III) was observed in the presence of goethite and ferrihydrite, and the iron(III) oxides were found to be oxidants in both cases (Bhandari et al., 2011; Bhandari et al., 2012). In addition, the oxidation of As(III) mediated by ferrous iron was observed in the co-presence of Fe(II) and Fe(III) (oxyhydr)oxides (Bisceglia et al., 2005; Ona-Nguema et al., 2010). Dissolved oxygen and soluble intermediates involved in Fe(II) oxidation may act as rate-enhancing species
5
in As(III) oxidation (Sahai et al., 2007). Previous studies have proposed pH-dependent
generation of oxidants in Fenton reaction, where reactive oxygen species are produced at low pH while a less reactive but more selective oxidant [most likely Fe(IV)] forms at circumneutral pH (Hug and Leupin, 2003; Katsoyiannis et al., 2008). Further, an Fe(II)-activated Fe(III)
intermediate species was also suggested to induce redox transformation of arsenic in strictly anoxic conditions (Amstaetter et al., 2010).
Motivation
This project was motivated by several knowledge gaps regarding arsenic behavior at lepidocrocite-water interfaces. Lepidocrocite is a common iron oxyhydroxide found in soils that actively participates in iron redox cycling (Cornell and Schwertmann, 2003). It is also the
dominant product of iron electrocoagulation, which is an effective treatment technique to remove arsenic from water (Ratna Kumar et al., 2004; Parga et al., 2005; Gomes et al., 2007; Thella et al., 2008; Balasubramanian et al., 2009; Lakshmanan et al., 2010; Wan et al., 2011; Li et al., 2012; van Genuchten et al., 2012). While previous research has found lepidocrocite to be a strong adsorbent for As(V) (Wan et al., 2011), little was known about its potential for As(III) adsorption. Further, no surface complexation model had been developed to understand the interaction between arsenic and lepidocrocite although surface complexation modeling is widely used to describe arsenic adsorption to other iron (oxyhydr)oxides. Despite the potential
importance of Fe(II)-mediated As(III) oxidation to groundwater systems and water treatment, the reaction mechanisms remained poorly understood. This project, with the focus on the chemical processes at the lepidocrocite-water interface, sought to fill these knowledge gaps, providing a deeper understanding of the environmental chemistry of arsenic that is critical to contaminant management and water treatment.
6
1.1.2 Project 2: Trace Element Mobilization during Shale-fluid Contact
Shale Oil and Shale GasShale oil and shale gas considered as unconventional hydrocarbon resources that are essentially trapped within shale formations due to low permeability. This is in contrast to
conventional natural gas and oil sources that generally exist in discrete, well-defined, permeable subsurface reservoirs (Moniz et al., 2010). Recent advances in energy recovery technologies, especially from low-porosity shale formations have substantially increased global estimates for recoverable natural gas and crude oil reserves (U.S. EIA, 2013). The United States has led the development of such technologies and thus shale oil and gas resources to date. Shale gas is predicted to be the largest contributor in the projected 56% increase of U.S. natural gas production from 2012 to 2040, growing from 9.7 tcf (trillion cubic feet) in 2012 to 19.8 tcf in 2040 (U.S. EIA, 2014). Inclusion of shale gas and shale oil accounts for a 38% and 35% increase in the U.S. natural gas and crude oil resources, respectively (U.S. EIA, 2013). Figure 1.2 is a map displaying major U.S. shale gas and shale oil plays as of May 2011.
7
Figure 1.2 Map of U.S. shale gas and shale oil plays (U.S. EIA, 2011) with Eagle Ford Formation and Bakken Formation highlighted
Hydraulic Fracturing
Hydraulic fracturing is a well stimulation technique for enhanced hydrocarbon recovery. During the hydrofracking process (Figure 1.3), an engineered fluid mixture of water, proppants and chemical additives is injected into a horizontal well under high pressure to initiate small cracks in the shale formation (Ely, 1985). The induced fractures can then act as conduits in the rock formation,allowing for natural gas to flow more freely from the shale pores to the
production well and surface (Arthur et al., 2009).
The fluid that returns to the surface after the pumping pressure is released is referred to as flowback or produced water and can contain both fracturing fluid and natural formation water.
8
There is no strict definitional boundary between flowback and produced waters, however, flowback waters are commonly considered to be fluids that flow out of a well within the first 2 weeks after stimulation by fracturing, whereas produced waters are the remaining fluid that flows from the well after the initial 2-week period (Haluszczak et al., 2013).
A number of water management issues are associated with hydraulic fracturing (Vidic et al., 2013; Vengosh et al., 2014). The first is the withdrawal of water required for well
completion. Drilling of the vertical and horizontal components of a well may require 400–4000
m3 (0.1 – 1 million gallons), and then 7000–18,000 m3 (2 – 5 million gallons) of water are
typically needed for hydraulic fracturing of each well (Nicot and Scanlon, 2012; Scanlon et al., 2014). The water utilized for hydraulic fracturing is represents a consumptive use because it leads to the loss of water from the source from which it was withdrawn. A second issue is the management of flowback and produced water, which can contain total dissolved solids as high as 200,000 mg/L (Hayes, 2009; Blondes et al., 2014). Wastewater containing such high dissolved solids can be challenging for fluid treatment and reuse. Much of the research to date on flowback water quality has focused on the Marcellus shale, where constituents of concern include bromide (risk of disinfection byproducts generation), barium, and naturally occurring radioactive
materials such as Radium (Wilson and VanBriesen, 2012; Haluszczak et al., 2013).
The most common management options for flowback and produced waters from oil and gas production in the United States are reuse (requiring little treatment), recycle (with more involved treatment) and disposal via deep well injection (Nicot et al., 2014). Disposal approaches vary by play, depending on the quantity and quality of the wastewater, as well as the availability of treatment facilities and injection wells (Benko and Drewes, 2008). Transporting to centralized facilities for treatment and reuse is common in the Marcellus region (Wilson and VanBriesen,
9
2012) while deep injection wells are preferred management strategies in the Eagle Ford and Bakken formations (Stephen et al., 2010; Nicot et al., 2014).
Figure 1.3 Illustration of a horizontal well showing the water lifecycle and natural gas flow during hydraulic fracturing (Schmidt, 2008)
Hydraulic Fracturing Fluids
The fracturing fluids used for shale stimulation primarily consist of water but also include a variety of chemical additives, depending on the specific conditions of the well to be fractured (properties of shale formation and associated water characteristics) (King, 2012). A typical fracture fluid carries 3 – 12 additives, each serving a different engineered purpose (Montgomery, 2013). A summary of some additives in a hydraulic fracturing fluid, their typical compounds and the reason the additive is used is provided in Table 1.1. Typically, hydrochloric acid (HCl) is the
10
single largest liquid component used in a fracturing fluid aside from water, and it is added to dissolve acid-soluble minerals in shales and to initiate cracks. EDTA and citrate used for iron control are both complexing agents that can bind strongly with metals [Mn(II), Cu(II), Fe(III), Pb (II) and Co(III)] (Huang et al., 1995).
Table 1.1 Volumetric composition and purposes of typical constituents of hydraulic fracturing fluid (Gregory et al., 2011)
Additive type Volume
fraction (%)
Example Purpose
Water and sand 99.5 Sand suspension “Proppant” sand grains hold
microfractures open
Acid 0.123 Hydrochloric or muriatic
acid
Dissolves minerals and initiates cracks in the rock
Fraction reducer 0.088 Polyacrylamide or mineral
oil
Minimizes friction
between the fluid and the pipe
Surfactant 0.085 Isopropanol Increases the viscosity of the
fracture fluid
Salt 0.06 Potassium chloride Creates a brine carrier fluid
Scale inhibitor 0.043 Ethylene glycol Prevents scale deposits in pipes
pH adjusting agent 0.011 Sodium or potassium carbonate Maintains effectiveness of chemical additives
Iron control 0.004 Citric acid or EDTA Prevents precipitation of metal
oxides
Corrosion inhibitor
0.002 n,n-dimethyl formamide Prevents pipe corrosion
Biocide 0.001 Glutaraldehyde Minimizes growth of bacteria
that produce corrosive and toxic by-products
Breaker - Ammonium persulfate Allows a delayed break down of
the gel polymer chains
Element Mobilization
Shale–fluid interactions have the potential to mobilize shale-bound metals (including regulated elements) through a variety of chemical reaction pathways (Figure 1.4). Dissolution of acid-reactive minerals (e.g. carbonates) can release trace elements hosted within them when acid (e.g. HCl) is used to initiate fractures. Metals originally attached (sorbed) to primary minerals are
11
likely to desorb due to changes in pH or the introduction of complexing agents (e.g. citrate). While shale formations are typically anaerobic, the oxygen in fracturing fluid and other oxidative additives (e.g. ammonium persulfate in Table 1.1) may trigger oxidative dissolution of trace elements that are more soluble under oxic conditions (such as uranium and chromium).
Figure 1.4 Illustration of possible chemical pathways of element mobilization from shales during shale-fluid interaction.
Eagle Ford Formation and Bakken Formation
The Eagle Ford shale gas and oil play is located within the Texas Maverick Basin (Figure 1.2). The play contains a high liquid component, leading to definition of three zones: an oil zone, a condensate zone and a dry gas zone, with an estimated 3.4 billion barrels of technically
recoverable oil and 20.8 trillion cubic feet of technically recoverable natural gas (U.S. EIA, 2011).
The Bakken shale oil play is located within the Williston Basin in Montana and North Dakota (Figure 1.2) and extends into the Canadian provinces of Manitoba and Saskatchewan (U.S. EIA, 2011). Based on the most USGS assessment, this shale play together with the Three Fork Formation (right below Bakken Formation), contains a mean undiscovered, technically
12
recoverable volume of 7.4 billion barrels of oil, 6.7 trillion cubic feet of associated/dissolved natural gas, and 0.53 billion barrels of natural gas liquids. This estimate for shale oil reserve would be the largest finding in U.S history (USGS, 2013).
Motivation
Advances in understanding the composition of flowback and produced waters during hydraulic fracturing processes are critical for the associated wastewater treatment and
management. Despite the potential effects of flowback constituents, little has been reported about the extent or pathway of shale-bound element release from shale-fracturing fluid contact. Such information is critical for managing potential waste streams that contain elements mobilized from the fractured rock. Knowledge obtained from bench-scale experiments is also important in evaluating possible chemical reaction kinetics and mechanisms in geological formations similar to the Eagle Ford and Bakken formations.
1.2 Research Objectives
1.2.1 Project 1 Objectives
The three main objectives associated with Project 1 are to
1) quantify the impact of water chemistry on As(III) adsorption to lepidocrocite
2) develop a surface complexation model to describe equilibrium As(III) and As(V)
adsorption to lepidocrocite
3) elucidate the mechanism of Fe(II)-mediated As(III) oxidation at the
lepidocrocite-water interface.
The degree of arsenic adsorption to lepidocrocite is subject to a variety of water
13
objective 1 by evaluating arsenic adsorption over a wide range of conditions to enable the
identification of the most important factor. A surface complexation model was then developed to facilitate the understanding of the adsorption mechanism and predict the behavior of arsenic in other conditions than those examined in this project. Finally, a system with co-occurrence of Fe(II) and Fe(III) solids was explored, further advancing the understanding of chemical interactions between arsenic and Fe(II)/lepidocrocite, which is common in both natural waters and engineered systems.
1.2.2 Project 2 Objectives
The two main research objectives for Project 2 were to:
1) investigate the impact of water chemistry on trace element mobilization from shales
2) identify the dominant mobilization pathways.
Observations and measurements based on laboratory experiments were able to provide information necessary in accomplishing Objective 1. However, the interpretation of these results would depend on how to correlate mobilization data with actual sample geochemistry and fluid properties. Objective 2 sought to identify the most important reaction pathways that govern the potential element release, which is helpful to evaluate shale-bound release from formations with similar geochemical properties.
1.3 Research Approach and Overview of Dissertation
The overall research approach for this dissertation is divided into two main tasks with each task corresponding to one of the two research projects.The primary goal of Task 1 is to investigate chemical reactions at the lepidocrocite surface that influence the mobility, speciation, and solid-water distribution of arsenic. This task
14
is further divided into two research subtasks: Subtask 1A) the impact of water chemistry on As(III) and As(V) adsorption onto lepidocrocite and Subtask 1B) the mechanism of Fe(II)-mediated As(III) oxidation. Batch experiments were designed to measure As(III) removal from water and to examine the interfacial chemistry between As(III) and lepidocrocite.
Subtask 1A involved a set of batch experiments to examine As(III) to lepidocrocite as a function of pH, total arsenic concentration, iron loading, and competing adsorbate presence. The data on As(V) adsorption to lepidocrocite were obtained from previous experiments performed by a colleague. A surface complexation model was developed and optimized to describe the adsorption of both As(III) and As(V) to lepidocrocite over a broad range of conditions. Subtask 1B included additional experiments performed to study the potential oxidation of As(III) with dissolved Fe(II) and to investigate the reaction mechanism when oxidation does occur. Fe(II)-mediated As(III) oxidation at the lepidocrocite surface was studied at both oxic and anoxic conditions. Chapter 2 summarizes the results from Task 1 and specifically focuses on the effect of pH, As/Fe ratio, dissolved oxygen, and Fe(II) on the adsorption of arsenic to lepidocrocite. The impact of phosphate as a competing adsorbate is described in Appendix A. To account for the enhanced arsenic adsorption with 2-propanol (as a radical scavenger) observed in Chapter 2, the effect of 2-propanol on the colloidal stability of lepidocrocite is discussed in Appendix B.
Task 2 was designed to examine the rates and extents of trace metal mobilization from shales during shale-fluid interactions as a function of fluid property. It involved a set of batch experiments to evaluate the impact of water chemistry on shale-bound trace element
mobilization. The fluid was varied with regard to pH, redox condition, solid:water ratio, temperature, salt concentration, and chemical additive presence. The interpretation of aqueous
15
analyses was combined with chemical equilibrium and reaction pathway modeling to identify dominant mobilization pathways.
Task 2 consisted of two subtasks that investigated core samples from the Eagle Ford formation (Subtask 2A) and the Bakken formation (Subtask 2B). These samples were
characterized with regard to their mineralogy, elemental composition, specific surface area and total carbon. In batch experiments, the samples were exposed to a variety of fluid properties followed by a series of aqueous measurements for metals and metalloids, anions, dissolved organic carbon, and electrical conductivity. Chapters 3 and 4 describe the element mobilization results from Eagle Ford samples and Bakken shale samples, respectively.
Chapter 5 summarizes the results of the present work. Key observations and important environmental implications are highlighted and areas for future work are identified.
16
Chapter 2: Effects of pH, Dissolved Oxygen,
and Aqueous Fe(II) on the Adsorption of
Arsenic to Lepidocrocite
Results of this chapter have been submitted to the Journal of Colloid and Interface Science for
review.
17
Abstract
The adsorption of arsenic to iron oxyhydroxides strongly depends on water chemistry. Iron(III) oxyhydroxides can also participate in the oxidation of As(III) to As(V), which changes arsenic’s toxicity and adsorption behavior. As(III) and As(V) adsorption to lepidocrocite (γ-FeOOH) were examined in batch experiments that explored the effects of lepidocrocite dose, pH, availability of dissolved oxygen, and the presence of aqueous Fe(II) on adsorption. Lepidocrocite is an iron oxyhydroxide found in soils, and it is one of the major products of iron electrocoagulation for water treatment. A surface complexation model was able to describe the adsorption of both As(III) and As(V) to lepidocrocite over a broad range of conditions. The concentration and oxidation states of arsenic in solution were measured over the course of the reactions. At both oxic and anoxic conditions, As(III) was oxidized to As(V) in systems that contained
lepidocrocite together with Fe(II); this oxidation led to overall enhanced arsenic adsorption at near neutral pH. With oxygen the pH-dependent generation of oxidants from the Fenton reaction drove the As(III) oxidation. In the absence of oxygen the As(III) was probably oxidized by Fe(III) in lepidocrocite that had become more reactive upon reaction with Fe(II).
Keywords: Arsenic Adsorption, Electrocoagulation, Surface Complexation Modeling, Fe(II)-mediated Arsenic Oxidation
18
2.1 Introduction
Arsenic is a toxic element that can be found at high concentrations in natural waters (Smedley and Kinniburgh, 2002). Sources of arsenic in aquatic systems are primarily natural soil and rocks, while human activities can influence hydrogeochemistry in ways that increase
concentrations (Harvey et al., 2006). The most common forms are inorganic oxyanions of trivalent As(III) and pentavalent As(V) (Smedley and Kinniburgh, 2002). At circumneutral
conditions, As(V) exists primarily as ionic forms (H2AsO4- and HAsO42-), while As(III) exists
predominantly as the neutral molecular form H3AsO3 . The maximum contaminant level for
arsenic in US drinking water is 10 µg/L (0.13 µM).
Iron (oxyhydr)oxides are used in engineered systems to remove both As(III) and As(V) from drinking water by adsorption (Jekel, 1994; Hering et al., 1997; Fields et al., 2000; Mohan and Pittman, 2007; Balasubramanian et al., 2009). Water treatment can involve loading iron (oxyhydr)oxides into packed columns (Zeng et al., 2008), optimizing pH for adsorption to iron (oxyhydr)oxides formed during chemical coagulation (Hering et al., 1997; Han et al., 2002; Wickramasinghe et al., 2004), and producing iron (oxyhydr)oxides during electrocoagulation (Ratna Kumar et al., 2004; Parga et al., 2005; Thella et al., 2008; Wan et al., 2011; Li et al., 2012). The association of arsenic with iron (oxyhydr)oxides is strongly affected by water chemistry. The adsorption of As(V) substantially decreases with increasing pH (Wilkie and Hering, 1996; Jönsson and Sherman, 2008; Wan et al., 2011) and is influenced by competitive adsorption with other groundwater solutes such as silica and phosphate (Zeng et al., 2007; Kanematsu et al., 2013). While As(III) adsorption is less pH-dependent and generally weaker than that of As(V), it can still be affected by competing adsorbates (Kanematsu et al., 2013).
19
Surface complexation modeling (SCM) has been used to predict both As(III) and As(V) adsorption over a broad range of total arsenic, iron oxide type, and competitive adsorbate conditions (Dixit and Hering, 2003; Fukushi and Sverjensky, 2007; Zeng et al., 2007; Kanematsu et al., 2013). In a surface complexation model, the surface of the solid is treated as specific functional groups that react with dissolved solutes to form surface complexes. The equilibrium of surface complexation and ionization can be described via mass action equations with adjustments for variable electrostatic conditions (Davis and Kent, 1990). While previous studies have demonstrated the use of surface complexation models to simulate As(III) and As(V) adsorption onto different iron (oxyhydr)oxides (Wilkie and Hering, 1996; Dixit and Hering, 2003; Fukushi and Sverjensky, 2007; Zeng et al., 2007; Kanematsu et al., 2013), they have not developed models for arsenic adsorption onto lepidocrocite or examined the effect of direct addition of ferrous ion in the system.
Iron (oxyhydr)oxides can participate in the oxidation of As(III) to As(V), which can potentially affect arsenic mobility and toxicity. Ferrihydrite was found to have a catalytic effect on As(III) oxidation by oxygen on a time scale of several days to a week (Zhao et al., 2011). Photoinduced oxidation of As(III) was observed in the presence of goethite and ferrihydrite, and the iron(III) oxides were found to be the oxidants (Bhandari et al., 2011; Bhandari et al., 2012). Fe(II)-mediated As(III) oxidation in oxic conditions was observed in a sand column with
aqueous Fe(II) (Bisceglia et al., 2005). As(III) oxidation was also observed on the surfaces of magnetite and ferrihydrite; while As(III) was rapidly oxidized upon adsorption to magnetite, As(III) oxidation on ferrihydrite was observed only after addition of aqueous Fe(II) within the examined time scale of 24 hours (Ona-Nguema et al., 2010). Dissolved oxygen and soluble intermediates involved in Fe(II) oxidation may act as rate-enhancing species in As(III) oxidation
20
(Sahai et al., 2007). Previous studies have proposed pH-dependent generation of oxidants in the Fenton reaction, where reactive oxygen species are produced at low pH while a less reactive but more selective oxidant [most likely Fe(IV)] forms at circumneutral pH (Hug and Leupin, 2003; Katsoyiannis et al., 2008). Further, an Fe(II)-activated Fe(III) intermediate species was suggested to induce redox transformation of arsenic at strictly anoxic conditions (Amstaetter et al., 2010). Lepidocrocite is a common iron oxyhydroxide found in soils that actively participates in iron redox cycling (Cornell and Schwertmann, 2003). It is also the dominant product of iron electrocoagulation, which is an effective treatment technique to remove arsenic from water (Ratna Kumar et al., 2004; Parga et al., 2005; Gomes et al., 2007; Thella et al., 2008;
Balasubramanian et al., 2009; Lakshmanan et al., 2010; Wan et al., 2011; Li et al., 2012). The oxidation of As(III) on lepidocrocite has not previously been examined.
The objectives of this study were to quantify the impact of pH, dissolved oxygen, and Fe(II) presence on As(III) and As(V) adsorption on lepidocrocite by both experimental and modeling approaches. Batch experiments were performed to investigate arsenic adsorption to lepidocrocite as a function of lepidocrocite dose, pH, availability of oxygen, and the presence of aqueous Fe(II). In this study, surface complexation modeling was used to describe chemical interactions at the lepidocrocite interface.
2.2 Material and Methods
2.2.1 Materials
All chemicals were used as received from vendors. Solutions were prepared with ultrapure water (resistivity > 18.2 MΩ•cm). Glass volumetric flasks and beakers were
acid-21
cleaned and rinsed several times with deionized water and ultrapure water prior to use. As(III)
and As(V) stock solutions were prepared from reagent grade NaAsO2 and Na2HAsO4•7H2O
(Sigma Aldrich). A fresh batch of 90 mM Fe(II) solution was prepared before each experiment
from FeSO4•7H2O (Sigma Aldrich). The HNO3 was of trace-metal grade from Fisher Scientific.
The NaOH for pH adjustment, and NaNO3 and NaHCO3 for ionic strength adjustment were of
ACS grade.
2.2.2 Lepidocrocite Generation
Lepidocrocite was synthesized in a bench-scale electrocoagulation reactor that we previously used to examine arsenic removal (Wan et al., 2011). In the electrocoagulation
process iron is released from an iron metal anode into solution as Fe(II) and it is then oxidized to Fe(III) by oxygen (Lakshmanan et al., 2009). The reactor consisted of a 1-L glass beaker with
two iron rods immersed in 1 mM NaHCO3 aqueous solution. Each rod had a diameter of 1.75
cm, length of 20 cm, and total wetted area of 57 cm2. Before each synthesis run, the electrodes
were abraded with sandpaper to remove scales and then cleaned with ultrapure water. A voltage of 12 V was applied to the electrodes from a direct current power supply. The solution was magnetically-stirred (200 rpm) and sparged with air at a flow rate above 60 mL/min to provide oxygen for the formation of Fe(III) precipitates. After a four-hour electrocoagulation run, the
suspension pH was adjusted to approximately 7.7, which is a published pHpzc of lepidocrocite
determined from potentiometric titration data (Peacock and Sherman, 2004), to promote the settling of the solids. The supernatant was decanted and the suspension was further purified with dialysis. Dry solids were then obtained by freeze-drying. The precipitate was confirmed to be lepidocrocite from the X-ray diffraction (XRD) pattern, which was collected using a
22
lepidocrocite was generated in one run and the suspensions from multiple syntheses following the same protocol were combined to form a lepidocrocite stock suspension (6 g/L γ-FeOOH-Fe) that was then used for all adsorption and As(III) oxidation expermients.
2.2.3 Equilibrium Adsorption Experiments
Equilibrium adsorption of As(V) and As(III) to the lepidocrocite generated from electrocoagulation was investigated in batch experiments as a function of pH and arsenic or lepidocrocite loading. All experiments were performed in 50-mL digestion tubes (copolymer polypropylene), with suspensions continuously mixed by magnetically stirring at 300 rpm. Adsorption was initiated by the addition of 10 mg/L As(III) or As(V) stock solution (133.3 µM) to pH-adjusted lepidocrocite suspensions. Desired pH values from 4 to 10 were obtained by
addition of either 0.1 M NaOH or 0.1 M HNO3. The pH of the resulting suspensions was
monitored throughout the course of adsorption experiments; the final pH measured at the end of the experiments is the value reported for equilibrium adsorption.
For As(III) adsorption, a total As concentration of 1.33 µM (100 µg/L) or 6.67 µM (500
µg/L) was used with a background electrolyte of 0.01 M NaNO3.The concentrated lepidocrocite
suspension was added to reach a loading of 120 mg Fe/L (190 mg γ-FeOOH/L). Based on preliminary experiments a reaction time of 48 h was found to ensure that As(III) adsorption reached equilibrium (Figure S2.2). For As(V) adsorption, a lepidocrocite concentration of 79 mg/L and a total As concentration of 1.33 µM (100 µg/L) or 13.3 µM (1000 µg/L) were used.
The batch reactors were equilibrated for 24 h with a background electrolyte of 1 mM NaHCO3.
In experiments to generate data for an As(III) adsorption isotherm at pH 7.5, 6.67 µM total As(III) was used with 8 different lepidocrocite loadings from 30 to 480 mg Fe/L.
23
glovebox with an N2/H2 mixture circulated over a heated Pd catalyst to minimize As(III)
oxidation by oxygen. For an As(V) adsorption isotherm at pH 4, the lepidocrocite concentration was fixed at 79 mg/L with total As(V) concentrations ranging from 2.2 to 94.1 µM. The pH values for the adsorption isotherms were selected such that they provided the maximum extent of adsorption for the particular arsenic oxidation state.
2.2.4 Effect of Fe(II)
Experiments with Fe(II) were performed to investigate Fe(II)-mediated As(III) oxidation.
A volume of 500 µL 9 mM Fe(II) solution freshly made from FeSO4•7H2O solid was spiked
together with the addition of As(III) stock solution to give a final Fe(II) concentration of 90 µM. To elucidate the role of Fe(II) on As(III) oxidation, some experiments were performed with the addition of 2-propanol as a radical scavenger, with 60 µL 2-propanol spiked into the batch reactor to give a 15 mM concentration. Previous research reported that this amount of 2-propanol would be able to quench hydroxyl radicals generated from the Fenton reaction (Buxton et al., 1988).
2.2.5 Dissolved Arsenic Speciation
An anion-exchange method (Ficklin, 1983) was adopted for dissolved arsenic speciation following the procedure outlined in a previous study (Wilkie and Hering, 1998). Samples of 5 mL volume were collected from the suspension during and at the end of experiments, diluted to 10 mL, and filtered through 0.22 µm polyethersulfone filter membranes. Half of the filtrate was adjusted to pH 5 and passed through a column of anion exchange resin (AG 1-X8 from Bio-Rad); the resin was received in chloride form and converted to an acetate form prior to use in arsenic separations. At pH 5, neutral As(III) species pass through the column while anionic
24
As(V) species are retained (Wilkie and Hering, 1998).The other half of the filtrate and the
effluent from the column were then acidified to 2% HNO3 by the addition of concentrated HNO3
for analysis of total dissolved arsenic and As(III), respectively. The As(V) concentration was determined as the difference between total dissolved arsenic and As(III).
2.2.6 Analytical Methods
The filtered and acidified samples were analyzed for dissolved concentrations of As by inductively coupled plasma mass spectrometry (ICP-MS) (7500ce, Agilent Technologies, Santa Clara, CA). The detection limit for As was 0.1 µg/L. The Fe(II) concentration was determined using the ferrozine method (Stookey, 1970).
2.2.7 Surface Complexation Modeling
A surface complexation model was developed to fit both As(III) and As(V) adsorption data. The diffuse double layer model was employed to account for the electrostatic effects at the lepidocrocite surface. The surface area of lepidocrocite generated from this reactor has been
observed in the range of 180 – 210 m2/g, and a surface area of 201 m2/g was chosen for the
modeling; this value was measured for lepidocrocite synthesized from the same procedure in a
previous study in our group (Wan et al., 2011). A surface site density of 1.6 sites/nm2 and
equilibrium constants of surface acid-base reactions reported for lepidocrocite by (Peacock and Sherman, 2004) were used; they had determined these values from FITEQL optimization of surface complexation parameters to fit potentiometric titration data. The equilibrium constants of lepidocrocite surface acid-base reactions were then adjusted to account for the difference in lepidocrocite specific area based on the approach described by (Sverjensky, 2003) (Table S2.1).
25
Two surface complex stoichiometries (monodentate and bidentate models) were evaluated for both As(III) and As(V) adsorption. One set of models used only monodentate surface complexation reactions with the consideration of reaction stoichiometries from a previous study that fit As(III) and As(V) adsorption onto goethite, amorphous iron oxide, and magnetite (Dixit and Hering, 2003). Other sets of models included bidentate reactions based on spectroscopic evidence for bidentate surface complexation of As(III) and As(V) on lepidocrocite (Farquhar et al., 2002; Manning et al., 2002; Sherman and Randall, 2003; Ona-Nguema et al., 2005). Multiple runs of equilibrium calculations in MINEQL+ v 4.6 (Schecher and McAvoy, 2007) were performed to determine both the best set of reactions for modeling As(III) and As(V) adsorption to lepidocrocite and the optimal values of the equilibrium constants of surface
complexation reactions included in those models. The surface complex reactions included in the final model together with their equilibrium constants are summarized in Table 2.1. The aqueous reactions in the models are compiled in Table S2.4. The overall procedure for model
development and optimization as well as the aqueous reactions are described in the Supporting Information.
2.3 Results and Discussion
2.3.1 Equilibrium As(III) Adsorption
As(III) adsorption onto lepidocrocite was mildly affected by pH (Figure 2.1a).
Adsorption increased with increasing pH, reached a stable level of high adsorption between pH 6 and 9, and then decreased with further increase in pH. The maximum percentage of adsorption decreased with increasing total As(III) concentration, which reached 94% and 78% at around pH
26
8 for total As(III) concentrations of 1.33 µM (100 µg/L) and 6.67 µM (500 µg/L), respectively. Similar adsorption patterns with broad ranges of maximum adsorption have been observed for the pH dependence of As(III) adsorption onto an amorphous iron oxide and goethite (Wilkie and Hering, 1996; Dixit and Hering, 2003).
Figure 2.1 (a) As(III) adsorption edges on lepidocrocite at 1.33 and 6.67 µM total As(III) concentrations together with predicted surface speciation for (b) 1.33 µM As(III) and (c) 6.67 µM As(III). Experimental
0 20 40 60 80 100 3 4 5 6 7 8 9 10 11 p e rc e n t ad sor b e d pH 1.33 µM 6.67 µM 0 20 40 60 80 100 3 4 5 6 7 8 9 10 11 p e rc e n t o f to tal A s pH 0 20 40 60 80 100 3 4 5 6 7 8 9 10 11 p e rc e n t o f to tal As pH b c (≡FeO)2HAs O (≡FeO)2AsO - (≡FeO)2HAs O (≡FeO)2AsO- a
27
data at 50 h adsorption are shown as markers; SCM predictions are shown as lines. All experiments were performed in a glovebox with N2/H2 passed over a heated Pd catalyst.
The capacity for As(III) adsorption was further explored at pH 7.5 (Figure 2.2a), which is
the pH of the maximum adsorption density. With the specific surface area of 201 m2/g and
adsorbed As(III) species assumed to all be bidentate surface complexes (Table 2.1), the observed maximum adsorption density of 0.06 µM As/mg Fe corresponds to As(III) occupancy of 0.34
sites/nm2. This value is lower than the total site density (1.6 sites/nm2) used in the surface
complexation modeling, which suggests that the majority of surface sites remained unoccupied by arsenic even at the highest total arsenic concentration studied. The adsorption density would still increase with increasing arsenic loading.
Greater arsenic adsorption with oxygen than at anoxic conditions was observed for experiments that started with As(III) (Figure 2.2a). This higher As adsorption was probably caused by As(III) oxidation to As(V) because As(V) adsorbs more strongly than As(III) at pH 7.5. Previous research indicated that lepidocrocite alone without oxygen could not oxidize As(III) (Ona-Nguema et al., 2005), which agrees with the dissolved arsenic speciation in the anoxic experiments in this study. It is likely that the lepidocrocite surface catalyzed the oxidation of As(III) by dissolved oxygen. Similar mechanisms have been suggested for As(III) oxidation in the presence of ferrihydrite (Zhao et al., 2011) and intercalated Fe(III)-montmorillonite
![Figure 1.1 pe-pH diagram for predominant arsenic species in water at 25 °C and 1 bar total pressure with 10 -6 M (75 µg/L) total arsenic concentration [adapted from (Cherry et al., 1979)]](https://thumb-us.123doks.com/thumbv2/123dok_us/1393449.2686624/22.918.216.709.111.577/figure-diagram-predominant-arsenic-species-pressure-arsenic-concentration.webp)