Role of Molecular Markers and Importance of SNP for the
Development of Cotton Programs
Muhammad Shehzad1 Allah Ditta1,2 Muhammad Sajid Iqbal1 Ameer Hussain Jarwar1
1. Nuclear Institute for Agriculture and Biology (NIAB), Faisalabad, Pakistan 2 .Oil Seed Section, Agriculture Research Institute Tando Jam Sindh Pakistan
Abstract
Cotton is an important commercial cash crop and cultivated worldwide. It is very important for improvement of desirable traits for development of cotton crop. Inthis review paper we have discussed the overall Molecular markers and advance techniques with their utilization in cotton improvement programmers. Molecular markers have reliable results and performance increased research of cotton breeding programs. Molecular markers are used to analyze genomic variations, association mapping, fingerprinting and genetic diversity in cotton crop.SNP markers have many advantages for genotyping of large populations as compared to previous marker systems. It is more advance and efficient processing technique. With the help of SNP technique we get more accurate results as compared to other markers in a short time. Overall DNA markers are used in cotton include Restriction Fragment Length Polymorphism (RFLP), Random Amplified Polymorphic DNA (RAPD), Amplified Fragment Length Polymorphism (AFLP), Simple Sequence Repeats (SSR) and Single Nucleotide Polymorphism, with their history current development, implication and importance in cotton breeding.
Keywords
PCR Polymerase chain reaction QTLs Quantitative trait loci
RAPD Random amplified polymorphic
DNA RFLP Restriction fragment length polymorphism RIL Recombinant inbred line
SNPs Single nucleotide polymorphisms SSR Simple sequence repeat
1 Background
Cotton (Gossypium spp.) is important economic major crop; it is grown in 80 countries all around the world in different ecological conditions (Kalivas et al., 201). Cotton is most cultivated important crop, it is provides oil and fiber around the worldwide (Zhang et al., 2007). Cotton is cultivated on large scale for production of fiber and according with three largest producer china, India and USA cotton crop is 3rd cultivated crop around the world
(FAO. FAOSTAT). Total species of genus Gossypium present in world is 50 in which 5 (2n = 4x = 52) are tetraploid and remaining 45 species are diploids (2n=2x=26) ((Fryxell, 1992)). There are four cotton species use for cultivation in which upland cotton (Gossypium hirsutum) (AD1 genome), (Gossypium barbadense)
(AD2 genome) from tetraploid species and Asian cotton, (Gossypium arboreum) (A2 genome), (Gossypium herbaceum) (A1 genome) from diploid species (Wendel et al., 1999. Upland cotton (G. hirsutum) and Pima (G. barbadense) are more used for cultivation and fiber production worldwide. In the U.S their total production accounts 95.5% for American Cotton and 4.5% for Pima cotton (USDA National Agriculture statistics Service 2013).
Molecular markers are increase the efficiency and speed of breeding programs. Various molecular markers are broadly used for analysis of genomic variations in plants, their association mapping as well as diagnostics, evolutionary studies analysis, fingerprinting, and also widely used for breeding applications. Among all of these markers, the new generation molecular markers called single nucleotide polymorphisms (SNPs) are most abundant, robust and feasible because of its availability in whole genome and that they play a key role in the induction of phenotypic variations.
SNP molecular markers are very important for marker assistant selection (MAS) due to highly prolific, solid and workable for robotic high production genotyping. SNP have many options to used different new technology methods for molecular crop genetics and breeding studies of plants (Steemers and Gunderson 2007; Alkan et al. 2011). SNP is mostly used for identification of gene in crop genetics and breeding group as prospective molecular markers (Rafalski et al., 2002). SNPs are used for study of genetic diversity in varieties to explain the origin, phylogeny and link genotypic variations with morphological characters (McNally et al., 2009). SNP molecular markers are commonly accessible for study of varying genes. The objectives of this review to explain role of molecular markers and importance of SNPs in genetics study of Cotton breeding.
2 Molecular markers in Cotton
and plant breeders are used these molecular markers to find for heredity variation, genomic study, and marker assistant selection (Kalia et al., 2011). Mishra et al., 2014) recommend that the ideal molecular marker should have following traits.
1-High polymorphic is essential for genetic studies
2-Codominanace in which difference between homozygous and heterozygous of diploids species 3-Occurring in the genome
4-Selected neutral behavior 5- Cheap and fast
6- Data reset and easily exchange data between laboratories.
DNA Markers can divide into three main groups.
1. Low throughput hybridization based markers such as restriction fragment length polymorphisms (RFLPs) 2. Medium throughput, PCR based molecular markers in which include random amplification of
polymorphic SSR and AFLP.
3. High throughput, Markers such as SNP, GBS and GIVAS.
Tanksely (1983) has been gave five features which differentiate DNA markers from morphological markers. The features are given below.
1- Checked genotypes from tissue at molecular level and from whole plant 2- There is a many naturally occurring alleles that present at many loci 3- Phenotypic neutrality
4- Alleles are codominat at many loci 5- Some epistatic effects are observed
2.1 Restriction Fragment Length Polymorphism (RFLP)
Many diverse molecular technique used in past for study of cotton Crop. The RFLP was first technique that used for cotton crop development. RFLP technique shows comparison of DNA sequence separately due to restriction enzyme. The different sizes of DNA fragments’ are form from addition, deletions and substitutions of base among populations. Scientists used RFLPs markers for construction of genetic map of cotton (Ulloa and Meredith, 2000). The first genomic map of cotton was produced by using of 705 RFLP loci and distributed into 41linkage groups (Reinsich) et al., 1994). RFLP markers provide a saturated map of cotton plant genome. RFLP markers are not affected by environment or others genes and placed in linkage group due to its dominance.
Advantages of RFLP
The main benefit of RFLP is that it describes the naturally occurring variation in DNA of wide range of different plants. Polymorphism occurs when a single base pair addition or deletion in restriction site due to mutation. Disadvantage of AFLP
Major disadvantage of RFLP needs a large quantity of DNA for every reaction. RFLP technique is expensive, labouirs and required a long time for analysis which reduces its use in marker assistant selection (Agarwal et al., 2008).
2.2 Randomly Amplified Polymorphic DNA (RAPD)
RAPD is a PCR based technique required small primers to speed up the random portions of the genome technology (Williams et al., 1990). RAPD is used for the accession profiling with primers that shows polymorphism about exact sequence information. The primers used for this technique should be free from palindromic sequence and have fourty percent GC content in fragments (Williams et al., 1990). RAPD markers were used for check the resistant of cotton varieties against jassids, mites and aphids (Geng et al., 1995). RAPD marker was used for produced a genetic map and checked the genetic diversity in cotton (Lu and Mayers, 2002)
RAPDs molecular markers are used for study of genetic diversity, gene mapping and finger printing (Zhang et al., 2008; Zahra et al., 2011). The main advantage of RAPD is that minuet amount of DNA needed for process analysis compared to AFLP. RAPD molecular markers were worked faster for polymorphism screening as compare to RFLP markers. RAPD molecular process is very easy for Bulk segregation analysis (BSA) to connect with regions of genome.
2.3 AFLP (Amplified Fragment Length Polymorphism)
AFLP techniques have been used for observed genotypic diversity in cotton crop (Zhang et al., 2005), and it was first developed by Vos et al., 1995). AFLP have four major steps which include Restriction digestion and ligation, of adapters, pre selective amplification, selective amplification and gel electrophoresis.
The advantage of AFLP is that it is reliable and efficiently works. There is no need of DNA sequence and information for analysis because AFLP has ability to analyze large number of polymorphic loci with a single primer on a single gel than the single sequence repeat and RFLPs (Russell et al., 1997).AFLP is used for study of genetic diversity, DNA fingerprinting, genetic map, gene identification of desirable traits and phylogenetic
relationship.
2.4 SSR (Simple Sequence Repeat) (Microsatellites)
Simple sequence Repeat another common name is Microsatellites and it was first discovered in humans (Litt and Lutty, 1989). SSRs are advance and new type of DNA markers that speedup the work of cotton genomic mapping. Microsatellites markers are reliable and having higher possibility markers for study of phylogenetic in cotton (Zhang et al., 2008). The SSR markers and their map information can be found from cotton gene database website (www.cottongen.org/find/mappedmarkers). SSR markers have been used for observing the genetic diversity and analysis of closely related varieties (Liu et al., 2006).
SSR markers are mostly found in eukaryotic genome but also occur in prokaryotes at low frequency. SSRs are used for study of association mapping, finding of QTLs of yield and fibers in Chinese cotton varieties and provides a good parents for develop a good accessions (Zhang et al., 2013). SSRs DNA markers are mostly used for construction of genetic map as compared to other markers. The main advantages of SSRs markers are simplicity and specificity. Microsatellite markers are linked with gene tightly and make a useful map. Jenkines et al., 2012) selected eleven most homozygous plants for chromosome eleven and fourteen from a F2 population derived from
cross of RKN resistant variety and susceptible variety FM966 by used of SSRs markers. These selected plats have confirmed resistant against RKN in F2 generation, instead of waiting for F6 and F8 generation through conventional
breeding. At that time round about 17,000 pairs of SSR primers have been developed from four cotton species G. arboreum, G. raimondii, G.hirsutum and G. barbadense for used as potential molecular markers (Blenda et al., 2006), (Frelichowski et al., 2006). By used of SSRs markers we identify specific traits genes such as fiber length, strength and fineness in early generation and these genes helpful in marker assisted selection. List of some identified genes of cotton is given in table no 1.
2.5 Genotyping by Sequencing (GBS)
Genotyping by sequencing technology is used for identification and genotyping of SNP molecular markers from a genome (Mir et al., 2013).GBS technique development is simple and has ability to reduce the intrication in genome (Elshire et al., 2011).
The multiplex libraries are developed for next generation sequencing by using of restriction endonuclease enzyme and with DNA barcoded adapters to detecting a section of genome from genotyping by sequencing (GBS).This technique has shown firstly in varieties and has ability to evolving huge markers (Elshire et al., 2011; Poland et al., 2012). The objective of functional genomics is to screening of good plants for development of crop by exchanging of phenotypic data between phenotype and genotype. From GBS firstly evolve large sequence variants and after that a complete genome sequencing (Poland and Trever, 2012). GBS is a best technique for study of populations because it is help in genetic mapping through which genomic selection can be done widely on large scale (Poland and Trever, 2012). This procedure has been used with some minor changes in protocol in cotton (Gossypium hirsutum L.) and sorghum (sorghum bicolor) species (Poland et al., 2012). Gore et al., 2014) contracted cotton genetic having eight hundreds fourty one SSR and SNP loci took the half tetraploid genome through SSR genotyping process and implementation of GBS
2.6 Association Mapping (GWAS)
Another name of association mapping is called linkage disequilibrium mapping and it was used for observed variation in multiplex characters through ancient and developmental process in population (M. Nordborg and S. Tavare, 2002). It was described relation of chromosomes among marker position and morphological position. Association mapping technology was generated in plants with transmutation, variation in gene, cross breeding and population selection (Hart and Clark, 1997).The Inherited traits allowing individual discretion of progenitors that permitting descendent for chromosomal mutation and transformation from this new advanced technique genome wide association mapping. The cotton genome required some markers for organize association mapping of complicated character which is reported for other crops (Barnaud et al., 2006). It is depend upon connection unbalance among chromosome position. Immensity connection of maternal combination and connection disequilibrium in gene bank allows suitable choice for genome wise association mapping (Lu et al., 2011).
All over the world scientists were used association mapping technology for study of cotton fibers related traits, parameters of yield and yield of cotton seed (Abdurakhmonov et al., 2008 and 2009). Association mapping has helped the scientists to check the variation found in germplasm. The development of SNP technique was made easy to study of whole genome, construction of genetic map and finding of desirable QTLs in plants (Waqas et al., 2014).
3 Discovery of SNP
Single nucleotide polymorphism (SNP) can be identified and used through different techniques which include Genotyping by sequencing(GBS), next generation sequencing technology (NGS) (Logan Young CJ, et al., 2015),
enzymatic and chemical mismatch assays, nucleotide amplification polymorphisms (SNAP), ligase chain reaction, Single Stranded confirmation polymorphism analysis (SSCP), Dideoxy fingerprinting, cleaved amplified polymorphic, sequence (CAPS) and derived CAPS (Gupta PK, 2001 and Lee.GA., 2009).
The understanding of cotton genome is possible by using of new genomics technologies for development of American cotton. The next generation sequencing (NGS) is no expensive new rapid technique for genome sequencing and transcriptome, to enable the discovery of single nucleotide polymorphism (SNP), RNA sequencing, gene expression and high throughput genotyping from sequencing studies in plants. However due to limited DNA polymorphism within the cotton species, the used of SSR or SNP markers are restricted for plant breeding and genotyping. Single sequence repeat (SSR) markers were used for construction of genetic map and observed genetic diversity in plants; their numbers are limited in a genome. SNP molecular markers are most present in plants even species are limited to their genetic diversity (Ganal MW et al., 2009) .In cotton the development of first SNP markers were slow and expensive and few SNP markers have been developed ( Udall JA, et al,. 2006),( Van Deynze A, et al., 2009). The development of next generation sequencing (NGS) technique sequencing has become rapid and cheap and it is used for identifying large number of SNP markers (Byers RL, et al., 2012), (Lacape JM, et al., 2012),( Gore MA, et al., 2012) . On other hand development of new cotton genome resources was very important
The development of first NGS based SNP in cotton through method of genome reduction on restriction site (GR-RSC) by using two varieties from Upland cotton (G. hirsutum) and two verities from Pima cotton (G. barbadense) (Byers et al., 2012). GBS technique has used to discover several million of SNPs, a major problem in this technique is large number of missing data.
3.1Introduction
Variation occurs at a single nucleotide position in DNA sequence of chromosome between two accessions is known as Single nucleotide polymorphism. In other short word SNP is polymorphism which occurs within two DNA samples and difference between single bases by addition, deletion, transversion, transition of chromosome (Ayeh et al., 2008; Hearne et al., 2008). SNP markers are extremely reliable directly furnish phenotype (Batley and Edwards, 2007). They are the easiest type of markers as having minor heredity entity as alone base and can produce large number of markers. SNP markers are mostly found in plants and animals. SNPs are commonly assigned and connected with morphological changes used as marker. Lindbeld et al., 2000) SNPs play an important role in creations of phenotypic variation by DNA polymorphism in genome of plants, animals and humans. According to international working group of SNP 1.42 million of SNPs are found in human genome and average one SNP is equal to 1.9kb (Sachidanandam et al., 2001). In addition to plants SNP polymorphism are present high density in genome (Ching et al., 2002).The rice genome have 0.64 SNP per one kb (Jeong et al., 2013), in addition tomato genome was observed 6.1 SNP per one in a complete genome (Kim et al., 2014).
The first genetic map of cotton was published in 1994. SNP markers have been identified by world scientists for study of gene mapping, phylogenetic analysis and genetic diversity in Gossypium genome (Deynze et al., 2009). SNPs were identified in many species include Arabidopsis thaliana (Jander et al., 2002), many in cultivated crops like maize (Ching et al., 2002), wheat (Ablet et al., 2006) and in human beings (Sachidanandam et al., 2001) SNPs have been detected in many species including model species such as Arabidopsis thaliana (Jander et al., 2002), many field crops like maize (Ching et al., 2002), wheat (Ablet et al., 2006) and in humans (Sachidanandam et al., 2001). SNP offer high speed and effective genotyping by using next generation sequencing technique. Two genes are ms5 and ms6 to control male sterility in cotton. Four SNP markers were identified from gene of male sterility and male fertility lines. These identified SNP markers were used for separation of male sterility and fertility lines in cotton (Feng et al., 2015).
3.2 Importance of SNP
The use of SNP markers in breeding programs has been growing at a faster pace and so is the development of technologies and platforms for the discovery and screening of SNPs in many crops. SNP markers have become extremely popular in plant molecular genetics due to their genome-wide abundance and amenability for high to ultra high throughput detection platforms. Unlike earlier marker systems, SNPs made it possible to create saturated, if not, supersaturated genetic maps, thereby enabling genome-wide tracking, fine mapping of target regions, rapid association of markers with a trait, and accelerated cloning of gene QTLs of interest.
SNP markers are important tool for linkage mapping, map based cloning and marker assistant selection due to the high level of polymorphism. SNPs dominate nature enable the markers to distinguish homozygous and heterozygous alleles (Shaheen et al., 2009). Due to high polymorphism rate SNP markers were to measure the gene mapping, genetic diversity, and construction of genetic map, and analysis for QTL in cotton (Michael et al., 2014 and Hulse Kemp et al., 2015).
Based on international collaboration struggle has developed 70K depend upon illumina genotyping assay (unpublished data: http//www.cttongen.org/node/1287616).This will be a source of high genotyping assay will be
used by cotton breeder, researcher and geneticists’ worldwide to increased genome configuration and cotton breeding.
3.3 Advantages of SNP from others Markers
SNP markers were presented rapidly and efficiently genotyping of large scale by using a next generation sequencing technologies (NGS). SNPs have many advantages like easily accessible, data management, rapid, and flexibility cost. Biallic SNPs added data direct into group and make large database marker information because same type of data used from different genotyping places.
We first look the limitation of SSR marker before understanding of SNPs. SSR markers are laborious, time consuming, low output, high cost, not reliable and old technique. SSR images in genome create problems when identify gene. The management of a bioinformatics data of SNPs is easily handles as compare to SSRs markers. With high quality reference genome, SNP data and genome sequence enables a powerful analysis of entire SNP universe for every accession. The benefits of SNP markers were first, flexibility and cost effectiveness is range of genotyping platforms present to meet different need for different markers and cost of sample.
Early SNP technologies are depending upon amplified polymorphic sequence markers (CAPS) (Thiel et al., 2004) and allele specific amplification procedures. The life science companies have made investment to introduced latest genotyping platforms and sequencing for latest development in computer science, nanotechnology and automation. The range of multiplexed fixed assays is providing one million SNP loci per run. Through high throughput technologies running of hundreds of samples with low cost SNP assays per day. For these systems require a big investment at early stage the end output is that cost of per sample has reduced and genotype a breeding line is cheaper as compare to phenotype it. Another advantage is that many approaches are automatically in which usual routine staff has been freed to work more effectively in analyzing genotypic and phenotypic data management and using new devices for breeding and genetic applications. One of the main advantages of SNPs is that it is not gel based.
3.4 Uses of SNP in Cotton Research
SNP markers were used for construction of genetic map, finding of QTLs and genetic male sterility in cotton. Cotton varieties under cultivation have large, complex and homologous sub genomes. Genome A have chromosome from 1 to 13 and genome D have chromosome from 14 to 26.SNP markers are helpful to connecting with a gene in marker assistant selection (MAS) in genetic breeding of cotton. This discovery is provides information about candidate gene associate with complex traits will have unusual effects to descried genetically manipulation of connected gene to better desirable characters. The invention of SNP molecular markers will have big impact in master assistant selection of cotton breeding.
SNP molecular markers development are show new paradigm in marker assistant selection especially considering most commonly available genome sequence on gene pool. SNP molecular markers are usually associated with more than one candidate genes. The discovery of SNP molecular marks is difficult due to double set of chromosome in cotton. Mostly private seed companies are used SNP markers for marker assistant selection in corns and other crops.
4 Linkage mapping
Genetic maps are used for study of plant genome, transformation and marker assistant selection in plants to observed association with desirable traits.
The information get from plant genome are known as genetic linkage map. These genetic maps are used for identification of desirable gene, help in marker assistant selection of plants and cloning of plants. Marker assistant selection is used for development of resistant gene in crop breeding programs. Quantitative trait loci (QTL) are used to develop linkage map and run QTL analysis (Paterson et al., 1996a). Many important traits are check with marker process at same time by using F2 population, recombinant inbred lines, and back cross population, isogonics
lines and double haploids populations (Jiang et al., 2007).
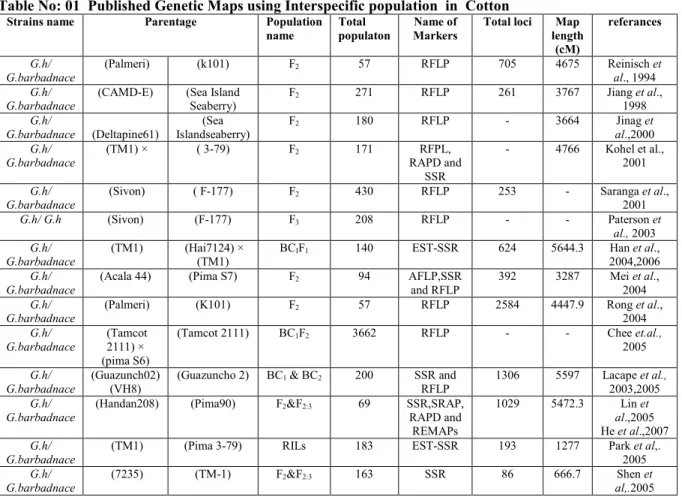
World level scientists have developed a number of maps to map DNA markers and functional characters. The researchers at global level have constructed many linkage maps to map functional traits and markers. Five thousands markers in public database including with 3300 restriction fragment length polymorphism (RFLP),700 amplified length polymorphism(AFLP) and 1000 single sequence repeat (SSR) (Rehman et al., 2012) Published genetics maps details is given in table No: 01
5 QTL Mapping
The regions in which gene is present in genome and gene associated with a specific quantitative traits are called QTLs (Collard et al., 2005). The process of construction linkage map and conduction QTL analysis to identify specific region associate with traits is known as QTL mapping (Paterson et al., 1996). For finding of QTLs used phenotypic data and a genotypic data of different populations. A quantitative traits locus (QTL) is successes from
process of crossing over which allows analysis of gene and markers in progeny.
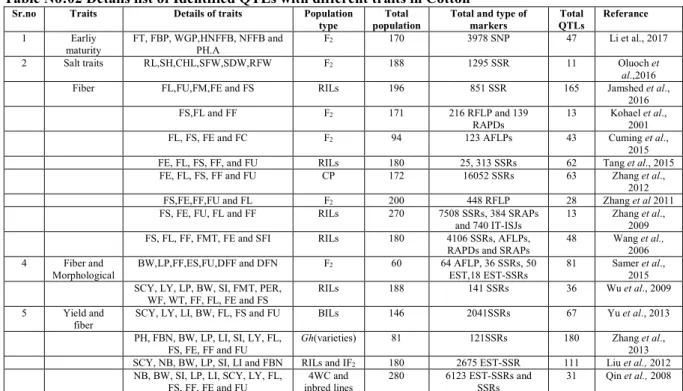
The fiber quality traits are easily find through (QTL) mapping, and very helpful in revealing the genetic basis of various fiber quality characteristics and providing important information for improving cotton breeding strategies. Computer QTL Cartographer 2.5software is used for analysis of QTLs (Wang S, et al., 2005). List of identified QTLs are give in table No: 03
6 Conclusions
In this paper we have discussed about advance molecular markers how to use and its implications in cotton. In future DNA markers have important value for the development of cotton breeding programs. Molecular markers have increased the speed and efficiency of cotton development programs. In all of these DNA markers SNP is advance and reliable markers. DNA markers are helpful for finding of genetic source with simple methods. Thousands of SNPs are present in cotton varieties give a chance to discriminate from cultivated varieties of cotton all over the world. The SNPs will be dense markers of genomics variation for association mapping techniques, objectives is that correlating of genotypic variation with phenotypic characters and with breeding methods in cotton. The improvement of molecular markers will make more efficient for molecular study of plant genetics and plant breeding helpful in development of cotton.
Table No: 01 Published Genetic Maps using Interspecific population in Cotton
Strains name Parentage Population name
Total populaton
Name of Markers
Total loci Map length (cM) referances G.h/ G.barbadnace (Palmeri) (k101) F2 57 RFLP 705 4675 Reinisch et al., 1994 G.h/ G.barbadnace
(CAMD-E) (Sea Island Seaberry) F2 271 RFLP 261 3767 Jiang et al., 1998 G.h/ G.barbadnace (Deltapine61) (Sea Islandseaberry) F2 180 RFLP - 3664 Jinag et al.,2000 G.h/ G.barbadnace (TM1) × ( 3-79) F2 171 RFPL, RAPD and SSR - 4766 Kohel et al., 2001 G.h/ G.barbadnace (Sivon) ( F-177) F2 430 RFLP 253 - Saranga et al., 2001 G.h/ G.h (Sivon) (F-177) F3 208 RFLP - - Paterson et al., 2003 G.h/ G.barbadnace (TM1) (Hai7124) × (TM1) BCIF1 140 EST-SSR 624 5644.3 Han et al., 2004,2006 G.h/ G.barbadnace
(Acala 44) (Pima S7) F2 94 AFLP,SSR
and RFLP 392 3287 Mei et al., 2004 G.h/ G.barbadnace (Palmeri) (K101) F2 57 RFLP 2584 4447.9 Rong et al., 2004 G.h/ G.barbadnace (Tamcot 2111) × (pima S6)
(Tamcot 2111) BC1F2 3662 RFLP - - Chee et.al.,
2005
G.h/ G.barbadnace
(Guazunch02) (VH8)
(Guazuncho 2) BC1 & BC2 200 SSR and
RFLP
1306 5597 Lacape et al.,
2003,2005
G.h/ G.barbadnace
(Handan208) (Pima90) F2&F2:3 69 SSR,SRAP,
RAPD and REMAPs 1029 5472.3 Lin et al.,2005 He et al.,2007 G.h/ G.barbadnace
(TM1) (Pima 3-79) RILs 183 EST-SSR 193 1277 Park et al,. 2005
G.h/ G.barbadnace
(7235) (TM-1) F2&F2:3 163 SSR 86 666.7 Shen et al,.2005
Published Genetic Maps using Interspecific population in Cotton
Strains name Parentage Population name Total populat on Name of Markers Total loci Map length (cM) referance G.h/ G.barbadnace (TM1) (3-79) RILs 163 SSR 433 2126.3 Frelichowski et al., 2006 Gh/ G.barbadnace (CR136) (Hai7124) F2 183 SSR,TRAP,SRA P and AFLP 1097 4536.7 Yu et al., 2007 G.h/ G.barbadnace (Handan20 8) (Pima 90) RILs 186 SSR - 5472.3 He et al., 2007 G.barbadnace / G.barbadnace (Guazunch o 2) (VH8-4602)
RILs 121 SSR and AFLP 800 2044 Lacap et al., 2009 G.h/ G.barbadnace (KC3) × (Suvin) KC3 BCIF1 140 SSR 57 911.6 Santoshkuma r et al., 2010 G.h/ G.barbadnace (TM1) (3-79) RILs 62 2072 3380 Yu et al., 2012 G.h/ G.barbadnace
(SG 747) (Giza 75) BILs 186 SSR and SNP 392 2895 Yu et al.,
2013 G.h/ G.barbadnace (TM-1) (NM24016) RILs 146 SSR 841 2061 Michael et al., 2014 G.barbadnace / G.hirsutumcv. (Doubled haploids lines 3-79) Texas Marker-1
F2 98 SSR and SNP 19,198 4439.6 Hulse kemp et al., 2015 G.barbadnace / G.h (Giza 45) Tamcot Luxor F2 118 SNP 210 3503.8 Samer et al., 2015 G.h/ G.tomentosum (TMS22) (WT936) F2 60 AFLP,SSR and EST-SSR 589 4259.4 Westengen et al., 2005 G.h/ G. darwinii (CCRI 12-4) (5-7) F2 188 SSR 2922 4176.7 Chen et al., 2015 G.h/ G. Tomentosum
(CRI 12-2) (P060I211) F2 188 SSR 3093 4365.3 Khan et al.,
2016 Published Genetic Maps using Intraspecific population in Cotton
Strains name Parentage Population
name
Total populaton
Name of Markers Total
loci
Map length (cM)
referance
G.h/ G.h (LU28) (Zhong 2013) F2 170 SNP - 2480 Li et al., 2017 G.h/ G.h (0-153) (SGK9708) RILs 196 SSR 997 4110 Jamshed et al.,
2016 G.h/ G.h (Yesil) (Nazilli 84) F2 94 AFLP 240 2068.5 Cuming et al.,
2015 G.h/ G.h (Yumian1) (7235) RILs 180 SSR 1540 2842.06 Tang et al.,
2015 G.h/
G.barbadnace
(Hai7124) (3-79) F2 124 SSR,EST-SSR and
SNP
412 2108.34 Wang et al.,
2013 G.h/ G.h (Yumian 1) (T586) RILs 270 SSR and SRAP 604 3140.9 Zhnag et al.,
2009 G.h/ G.h (HS 46) (MARCABUC
AG8US-1-88)
RILs 188 SSR 125 965 Wu et al., 2009
G.h/ G.h (DH962) (Jimian5) F2 137 SSR, SRAP, RAPD and RGAP
471 3070.2 Lin et al., 2009
G.h/ G.h (Deltapine) (Texas 701) F2 251 SSR 73 650.8 Guo et al., 2008 G.h/ G.h (Yumina 1) (T586) RILs 270 SSR 19 96.2 Wan et al.,
2007 G.h/ G.h (7235) (TM-1) RILs 207 SSR 156 1024.4 Shen et al., 2007 G.h/ G.h (L-70) (L-47) RILs 76 EST-SSR - - Abdurakhmono
v et al., 2007 G.h/ G.h (Zhongmian
suo12)
(8891) RILs 180 SSR, AFLP, RAPD
and SRAP
132 865.20 Wang et al.,
2006 G.h/ G.h (TM1) (7235) RILs 258 SSR 110 810.7 Shen et al., 2007 G.h/ G.h (Yumian 1) (T586) F2 and F2:3 117 SSR and AFLP 70 525 Zhang et al.,
2005
Published Genetic Maps using Intraspecific population in Cotton
Strains name Parentage Population
name
Total populaton
Name of Markers
Total loci Map length
(cM)
Referance
G.trilobum/ G. raimondii
(Skovsted) (Ulbr) F2 62 RFLP 763 1493.3 Rong et al., 2004
Gh/ G.barbadnace
(Acala44) (Pima S7) F2 94 AFLP,RFLP
and SSR
392 3287 Mei et al., 2004
G.h/ G.h (Handan208) (Pima90) F2 129 SRAP 237 3030.7 Lin et al., 2005 Gh/
G.anomalum
(TM I) (7235) F2 and F3 186 SSR and
RAPD
- - Zhang et al., 2003
G.h/ G.h G.hirsutum G.hirsutum 4WC 273 SSR, EST-SSR
Table No:02 Details list of Identified QTLs with different traits in Cotton
Sr.no Traits Details of traits Population
type
Total population
Total and type of markers Total QTLs Referance 1 Earliy maturity FT, FBP, WGP,HNFFB, NFFB and PH.A F2 170 3978 SNP 47 Li et al., 2017
2 Salt traits RL,SH,CHL,SFW,SDW,RFW F2 188 1295 SSR 11 Oluoch et
al.,2016
Fiber FL,FU,FM,FE and FS RILs 196 851 SSR 165 Jamshed et al.,
2016
FS,FL and FF F2 171 216 RFLP and 139
RAPDs
13 Kohael et al., 2001
FL, FS, FE and FC F2 94 123 AFLPs 43 Cuming et al.,
2015
FE, FL, FS, FF, and FU RILs 180 25, 313 SSRs 62 Tang et al., 2015
FE, FL, FS, FF and FU CP 172 16052 SSRs 63 Zhang et al.,
2012
FS,FE,FF,FU and FL F2 200 448 RFLP 28 Zhang et al 2011
FS, FE, FU, FL and FF RILs 270 7508 SSRs, 384 SRAPs
and 740 IT-ISJs
13 Zhang et al., 2009
FS, FL, FF, FMT, FE and SFI RILs 180 4106 SSRs, AFLPs,
RAPDs and SRAPs
48 Wang et al., 2006
4 Fiber and
Morphological
BW,LP,FF,ES,FU,DFF and DFN F2 60 64 AFLP, 36 SSRs, 50
EST,18 EST-SSRs
81 Samer et al., 2015 SCY, LY, LP, BW, SI, FMT, PER,
WF, WT, FF, FL, FE and FS
RILs 188 141 SSRs 36 Wu et al., 2009
5 Yield and
fiber
SCY, LY, LI, BW, FL, FS and FU BILs 146 2041SSRs 67 Yu et al., 2013
PH, FBN, BW, LP, LI, SI, LY, FL, FS, FE, FF and FU
Gh(varieties) 81 121SSRs 180 Zhang et al., 2013
SCY, NB, BW, LP, SI, LI and FBN RILs and IF2 180 2675 EST-SSR 111 Liu et al., 2012
NB, BW, SI, LP, LI, SCY, LY, FL, FS, FF, FE and FU 4WC and inbred lines 280 6123 EST-SSRs and SSRs 31 Qin et al., 2008
Flowering time (FT), Period from first flower blooming to first boll opening (FBP), Number of bolls per plant (NB), Boll weight (BW), Seed index (SI), Lint percentage (LP), Lint index (LI), Seed index (SI), Seed cotton yield per plant (SCY), Lint yield per plant (LY), Fiber length (FL), Fiber strength (FS), Fiber elongation (FE), Fiber uniformity ratio (FU), Fiber yellowess (FY), Fiber fineness (FF), Fiber maturity (FMT), Fruiting branch length (FBN), Fruit branch number (FBN), Fruit branch angle (FBA), Fiber length uniformity (FLU), Short fiber content (SFC), Fiber reflectance (FR), Seed weight (SW), Number of seeds per boll (NS), Upper quartile length (UQ), Short fiber content (SF), Fiber tenacity (FT), Immature fiber content (IF), Short fiber index (SFI), number of seeds per boll (NSB), Date of first Flowering (DFF), Node of first fruiti ng branch (FFN), (HFFN), Plant height (PH), Period of growth and development (WGP)
Table No: 03 Identified genes in Cotton with Different traits
Traits Genes References
Fiber length qFs1 Zhang et al., 2003
Fiber strength QFL – D2-1 Wang et al., 2006
Fiber development Li1, Li2, N1, n2, Fz, haN1, N1, N2 Rong et al., 2007
Blight resistance B2, B3, B12 Wright et al., 1998
CMS Rf1, RF2 Lan et al., 1999 and Liu et al., 2003
GMS ms5, ms6, ms15 Chen et al., 2009
References
A. Barnaud, T. Lacombe, and A. Doligez, “Linkage disequilibrium in cultivated grapevine, Vitis viniferaL,” Theoretical and Applied Genetics, vol. 112, no. 4, pp. 708–716, 2006.
Abdurakhmonov I.Y., Kohel R.J., Yu J.Z., Pepper A.E., Abdullaev A. A., Kushanov F.N., Salakhutdinov I.B., Buriev Z.T., Saha S., Scheffler B.E., Jenkins J.N., and Abdukarimov A., 2008, Molecular diversity and association mapping of fiber quality traits in exotic G. hirsutum L. germplasm, Genomics, 92(6): 478-487 Abdurakhmonov I.Y., Saha S., Jenkins J.N., Buriev Z.T., Shermatov S.E., Scheffler B.E., Pepper A.E., Yu J.Z.,
and Kohel R.J., 2009, Linkage disequilibrium based association mapping of fiber quality traits in G. Hirsutum L. Variety germplasm Genetica, 136(3):401-417
Abdurakhmonov, I.Y., Buriev, Z.T., Saha, S., 2007, Microsatellite markers associated with lint percentage trait in cotton, Gossypiumhirsutum. Euphytica, 156(2): 141- 156.
Ablet G., Hill H., and Henary R.J., 2006, Sequence polymorphism discovery in wheat microsatellite flanking regions using pyrophosphate sequencing, Molecular Breeding, 17(3): 281-289
Agarwal M., Shrivastava N., and Padh H., 2008, Advances in molecular marker techniques and their applications in plant sciences, Plant Cell Reports, 27(4): 617-631
12, 363-376.
Andersen J.R., and Lubberstedt T., 2003, Functional markers in plants, Trends in Plant Science, 8(11):554-560 Ayeh K.O., 2008, Expressed sequence tags (ESTs) and single nucleotide polymorphisms (SNPs): Emerging
molecular marker tools for improving agronomic traits inplant
biotechnology,AfricanJournalofBiotechnology,7(4):331-341
Blenda A, Scheffler J, Scheffler B, et al. CMD: a cotton microsatellite database resource for Gossypium genomics BMC Genomics. 2006; 7:132.
Byers, R. L., D.B. Harker, S.M. Yourstone, P.J. Maughan, and J.A. Udall. 2012. Development and mapping of SNP assays in allotetraploid cotton. Theor. Appl. Genet. 124:1201–1214. doi:10.1007/s00122-011178 Chee, P. W., Draye, X. and Jiang C. X., 2005, Molecular dissection of phenotypic variation between
Gossypiumhirsutum and Gossypiumbarbadense (cotton) by a backcross-self approach: III. Fiber length. Theor. Appl. Genet., 111(4): 772-781.
Chen, D., Ding, G., Guo, W. and Zhang, T., 2009, Molecular mapping of genic male–sterile genes ms15, ms5 and ms6 in tetraploid cotton. Plant Breed., 128: 193–198
Chen, H., Riaz, M. K., Zhou, Z., Wang, X., Cai, X., Ilyas, M. K., … Wang, K. (2015). A high- density SSR genetic map constructed from a F2 population of Gossypium hirsutum and Gossypium darwinii. Gene, 574(2), 273– 286. https://doi.org/10.1016/j.gene.2015.08.022
Ching A.D.A., Caldwell K.S., Jung M., Dolan M., Smith O., Tingey S., Morgante M., and Rafalski A.J., 2002, SNP frequency, haplotype structure and linkage disequilibrium in elite maize inbred lines, BMC Genetics 3(1): 1
Collard, B. C. Y., Jahufer, M. Z. Z., Brouwer, J. B., and Pang, E. C. K 2005. An introduction to markers, quantitative trait loci (QTL) mapping and marker-assisted selection for crop improvement: The basic concepts. Euphytica, 142: 169–196
Cuming, D. S., Altan, F., Akdemir, H., Tosun, Gurel, A. and Tanyolac, B., 2015, QTL analysis of fiber color and fiber quality in naturally green colored cotton (GossypiumhirsutumL.). Turkish J. Field Crop, 20(1): 49-58. Deynze A.V., Stoffel K., Lee M., Wilkins T.A., Kozik A., Cantrell R.G., Yu J.Z., Kohel R., and Stelly D.M., 2009,
sampling nucleotide diversity in cotton, BMC Plant Biology, 9(1):125
Drenkard, E, Richter, BG, Rozen, S, Stutius, LM, Angell, NA, Mindrinos, M, Cho, RJ, Oefner, PJ, Davis, RW, and Ausubel, FM (2000). A simple procedure for the analysis of single nucleotide polymorphisms facilitates map-based cloning in Arabidopsis. Plant Phys. 124, 1483-1492.
FAO. FAOSTAT.
Feng X, Keim D, Wanjugi H, Coulibaly I, Fu Y, Schwarz J, et al. 2015. Development of molecular markers for genetic male sterility in Gossypium hirsutum. Mol. Breed. 35: 141.
Frelichowski JE, Jr, Palmer M, Main D, et al. Cotton genome mapping with new microsatellites from Acala ‘Maxxa’ BAC-ends. Mol Genet Genomics. 2006;275:479–491.
Frelichowski, J. E., Palmer, M. B. and Main, D., 2006, Cotton genome mapping with new microsatellites from Acala ―Maxxaǁ BACends. Mol. Genet. Genom. 275(5): 479-491.
Fryxell, P.A. 1992, A revised taxonomic interpretation of GossypiumL. (Malvaceae). Rheedea, 2: 108–165. Ganal MW, Altmann T, Röder MS. SNP identification in crop plants. Curr Opin Plant Biol. 2009;12:211–217. Geng C.D., Gong Z.Z., Huang J.Q., and Zhang Z.C., 1995, Identification of difference between cotton cultivars
(G. hirsutum) using the RAPD method, Jiangsu Journal Agricultural Sciences,11(4):21-24
Gore M.A., Fang D.D., Poland J.A., Zhang J., Percy R.G., Cantrell R.G., Thyssen G., and Lipka A.E., 2014, Linkage Map Construction and Quantitative Trait Locus Analysis of Agronomic and Fiber Quality Traits in Cotton, the Plant Genome, 7(1)
Gore MA, Percy RG, Zhang J, Fang DD, Cantrell RG. Registration of the TM-1/NM24016 cotton recombinant inbred mapping population. J Plant Reg. 2012;6:124 –127.
Guo, Y., McCarty, J. C., Jenkins, J. N. and Saha, S., 2008, QTLs for node of first fruiting branch in a cross of an upland cotton, GossypiumhirsutumL., cultivar with primitive accession Texas 701. Euphytica, 163(1): 113– 122.
Gupta PK, Roy JK, Prasad M. Single nucleotide polymorphisms: a new paradigm for molecular marker technology and DNA polymorphism detection with emphasis on their use in plants. Curr Sci. 2001;80:524 –35.
Han, Z. G., Guo, W. Z., Song, X. L. and Zhang, T. Z., 2004, Genetic mapping of EST-derived microsatellites from the diploid Gossypiumarboreum in allotetraploid cotton. Mol. Genetics and Genomics, 272(3): 308– 327. Han, Z., Wang, C. and Song, Z., 2006, Characteristics, development and mapping of Gossypiumhirsutumderived
EST-SSRs in allotetraploid cotton. Theoretical and Applied Genetics, 112(3): 430–439.
HartD.L.,andClarkA.G.,eds.,1997,Principles of Population Genetics, Sinauer Associates, Sunder land,Massachusetts,pp.1-635 Hearne S. J., LorenzenJ., Town C.,and Zhuang E.,2008,ESTderived genomic resources for Musa,IITAReport,www.IITA.org
economic traits based on a dense genetic map of cotton with PCR-based markers using the interspecific cross of Gossypiumhirsutum Vs Gossypiumbarbadense. Euphytica 153(2): 181-197
He, D. H., Lin, Z. X., Zhang, X. L., Nie, Y. C., Guo, X. P., Zhang, Y. X. and Li, W., 2007, QTL mapping for economic traits based on a dense genetic map of cotton with PCR-based markers using the interspecific cross of Gossypiumhirsutum Vs Gossypiumbarbadense. Euphytica 153(2): 181-197.
HearneS.J., Lorenzen J., Town C., andZhuang E., 2008, ESTderived genomic resources
forMusa,IITAReport,www.IITA.org
Hulse-Kemp, A. M., Jana, L., Joerg, P., Hamid, A., Ramesh, B., David, D. F., James, F., Marc, G., Steve Hague, L. L., Hinze, K. J., Kochan, P. K., Riggs, J. A. S., Joshua, A. U., Mauricio, U., Shirley, S. W., Qian-Hao, Z., Sumit, K. B., Archana, B., John. J. B., Robert, L B., Michel, C., Michael, A. G., David, B. H., Md, S. I., Johnie, N., Jenkins, D. C. J., Jean-Marc, L, Danny, J. L., Richard, G. P., Alan, E., Pepper, J. A., Poland, Krishan, M. R., Samir, V. S., Sunil Kumar, S., Andrew, S., Jen, M., Taylor, F. W., Scott, M. Y., Xiuting, Z., Cindy, T., Lawley, M. W., Ganal, A. V. W. and David, M. S., 2015, Development of a 63K SNP array for cotton and high-density mapping of intra and inter-specific populations of Gossypium spp. G3: Genes, Genomes, Genetics. doi: 10. 1534/g3. 115. 018416.
Jamshed, M., Jia, F., Gong, J., Palanga, K. K., Shi, Y., Li, J., … Gong, W. (2016). Identification of stable quantitative trait loci ( QTLs ) for fiber quality traits across multiple environments in Gossypium hirsutum recombinant inbred line population. BMC Genomics, 1–13. https://doi.org/10.1186/s12864-016-2560-2 Jander G., Norris S R., Rounsley S.D., Bush D.F., Levin I.M., and Last R.L., 2002, Arabidopsis mapbased cloning
in the post-genome era, Plant Physiology, 129(2): 440-450
Jenkins, N, J., Jack, M. C., Martin, J. W., Russel, H., Osman, A. G., Franklin, C. and Dewayne, D., 2012, SSR Markers for Marker Assisted Selection of Root Knot nematod (Meladogyne incognita) Resistant plant in cotton (Gossypium hirsutum L). Euphytica 183: 4954
Jeong IS, Yoon UH, Lee GS, Ji HS, Lee HJ, Han CD, Hahn JH, An G, and Kim TH. (2013) SNP-based analysis of genetic diversity in anther derived rice by whole genome
Jiang G.L., Dong Y., Shi J., and Ward R.W., 2007, QTL analysis of resistance to Fusarium head blight in the novel wheat germplasm CJ 9306. II. Resistance to deoxynivalenol accumulation and grain yield loss. Theoretical Applied Genetics, 115(8): 1043-1052
Jiang, C. X., Chee, P. W., Draye, X., Morrell, P. L., Smith, C. W. and Paterson, A. H., 2000, Multilocus interactions restrict gene introgression in interspecific populations of polyploidy Gossypium(cotton). Evolution, 54(3): 798-814.
Jiang, C. X., Wright, R. J., El-Zik, K. M. and Paterson, A. H., 1998, Polyploid formation created unique avenues for response to selection in Gossypium(cotton). Proc. Nat. Acad. Sci. USA., 95(8): 4419-4424
Kalia R.K., Rai M.K., Kalia S., Singh R., and Dhawan, A.K., 2011, Microsatellite markers: an overview of the recent progress in plants, Euphytica, 177(3): 309-334
Kalivas, A., Xanthopoulos, F., Kehagia, O. and Tsaftaris, A.S. (2011) Agronomic Characterization, Genetic Diversity and Association Analysis of Cotton Cultivars Using Simple Sequence Repeat Molecular Markers. Genetics and Molecular Research, 10, 208- 217.
Khan, M. K. R., Chen, H., Zhou, Z., & Ilyas, M. K. (2016). Genome Wide SSR High Density Genetic Map Construction from an Interspecific Cross of Gossypium hirsutum × Gossypium tomentosum, 7(April). https://doi.org/10.3389/fpls.2016.00436
Kim JE, Oh SK, Lee JH, Lee BM, and Jo SH. (2014) Genome-wide SNP calling using next generation sequencing data in tomato. Mol Cells 37, 36-42.
Kohel, R. J., Yu, J., Park Y. H. and Lazo, G. R., 2001, Molecular mapping and characterization of traits controlling fiber quality in cotton. Euphytica, 121(2): 163-172
Kohel, R. J., Yu, J., Park Y. H. and Lazo, G. R., 2001, Molecular mapping and characterization of traits controlling fiber quality in cotton. Euphytica, 121(2): 163-172.
Komori, T, and Nitta, N (2005). Utilization of the CAPS/dCAPS method to convert rice SNPs into PCR-based markers. Breeding Sci. 55, 93-98.
Lacape JM, Claverie M, Vidal RO, et al. Deep sequencing reveals differences in the transcriptional landscapes of fibers from two cultivated species of cotton. PLoS One. 2012;7:e48855.
Lacape, J. M., Jacobs, J., Arioli, T., Derijcker, R., Forestier, N. C., Llewellyn, D., Jean, J., Thomas, E. and Viot, C., 2009, A new interspecific, Gossypiumhirsutum x G. barbadense, RIL population: towards a unified consensus linkage map of tetraploid cotton. Theor. Appl Genet., 119: 281-292.
Lacape, J. M., Nguyen, T. B. and Thibivilliers, S., 2003, A combined RFLP-SSR-AFLP map of tetraploid cotton based on a Gossypiumhirsutum × Gossypiumbarbadense backcross population. Genom., 46(4): 612626. Lacape, J. M., Nguyen, T. B., Courtois, B., Belot, J. L., Gib, M., Gourlot, J. P, Gawryziak, G., Roques, S. and Hau,
B., 2005, QTL analysis of cotton fiber quality using multiple Gossypiumhirsutum × Gossypiumbarbadense backcross generations. Crop Sci., 45: 123140.
Lan, T. H., Cook, C. G. and Paterson, A. H., 1999, Identification of a RAPD marker linked to male fertility restoration gene in cotton (Gossypiumhirsutum L.). J. Agri. Genom., 1: 1-5
Lee GA, Koh HJ, Chung HK, Dixit A, Chung JW, Ma KH, Lee SY, Lee JR, Lee GS, Gwag JG, Kim TS, Park YJ. Development of SNP-based CAPS and dCAPS markers in eight different genes involved in starch biosynthesis in rice. Mol Breeding. 2009;24:93– 101. doi: 10.1007/s11032-009-9278-7.
Li L, Zhao S, Su J, Fan S, Pang C, Wei H, et al. (2017) High-density genetic linkage map construction by F2 populations and QTL analysis of early-maturity traits in upland cotton (Gossypium hirsutum L.). PLoS ONE 12(8): e0182918. https:// doi.org/10.1371/journal.pone.0182918
Lin, C. H., Yeakley, J. M., McDaniel, T. K. and Shen, R., 2009, Medium to high-throughput SNP genotyping using VeraCodemicrobeads, DNA and RNA Profiling in Human Blood. Humana Press, New York, 129-142 Lin, Z., He, D., Zhang, X., Nie, Y., Guo, X., Feng, C. and Stewart, J. M. C. D., 2005, Linkage map construction
and mapping QTL for cotton fiberquality using SRAP,,SSR and RAPD. Plant Breeding, 124 : 180-187 Lin, Z., He, D., Zhang, X., Nie, Y., Guo, X., Feng, C. and Stewart, J. M. C. D., 2005, Linkage map construction
and mapping QTL for cotton fiberquality using SRAP,,SSR and RAPD. Plant Breeding, 124 : 180-187 Litt M, and Lutty JA (1989). Ahpervariable microsatellite revelled Theoretical Applied V Genetics 95 (4):
714-722
Liu D.Q., Guo X.P., Lin Z.X., Nie Y. C., and Zhang X.L., 2006, Genetic diversity of Asian Cotton (Gossypium arboreum L.) in China evaluated by microsatellite analysis, Genetic Resources and Crop Evolution, 53(6):1145- 1152
Liu, R. and Meng, J., 2003, MapDraw: a microsoft excel macro for drawing genetic linkage maps based on given genetic linkage data. Hereditas (Beijing), 25: 317-321.
Liu, R., Wang, B. and Guo, W., 2012, Quantitative trait loci mapping for yield and its components by using two immortalized populations of a heterotic hybrid in Gossypiumhirsutum L. Molecular Breeding, 29(2): 297– 311.
Lu H., and Myers G., 2002, Genetic relationships and discrimination of ten influential upland cotton varieties using RAPD markers, Theoretical and Applied Geneticis,105(2- 3):325- 331
Lu Y.L., Shah T., Hao Z.F., Taba S., Zhang S.H., Gao S.B., Liu J., Cao M.J., Wang J., Prakash A.B., Rong T.Z., and Xu Y.B., 2011, Comparative SNP and Haplotype Analysis Reveals a Higher Genetic Diversity and Rapider LD Decay in Tropical than Temperate Germplasm in Maize, PLoSONE,6(9)
M. Nordborg and S. Tavar´ e, “Linkage disequilibrium: what history has to tell us,” Trends in Genetics,vol.18, no.2,pp. 83–90, 2002.
McNally KL, Childs KL, Bohnert R, Davidson RM, Zhao K, Ulat VJ, et al. 2009. Genome wide SNP variation reveals relationships among landraces and modern varieties of rice. Proc. Natl. Acad. Sci. U.S.A. 106: 12273-12278.
McPherson J.D., Gilman B., Schaffner S., Van Etten W.J., Reich D., Higgins J., Daly M.J., Blumenstiel B., Baldwin J., Stange-Thomann N., Zody M C., Linton L., Lander E.S.,and Altshuler D., 2001, A map of human genome sequence variation containing 1.42 million single nucleotide polymorphisms, Nature, 409(6822): 928- 933
Mei, M., Syed, N. H. and Gao, W., 2004, Genetic mapping and QTL analysis of fiber-related traits in cotton (Gossypium), Theor. Appl. Genet., 108(2): 280–291.
Mei, M., Syed, N. H. and Gao, W., 2004, Genetic mapping and QTL analysis of fiber-related traits in cotton (Gossypium), Theor. Appl. Genet., 108(2): 280–291.
Michael, A., Gore., Fang, D. D., Jesse, A., Poland., Zhang, J., Richard, G., Percy., Roy, G., Cantrell., Gregory, T. and Alexander, E. L., 2014, Linkage map construction and quantitative trait locus analysis of agronomic and fiber quality traits in cotton. Pl. Genom., 7(1): 213-215
Mishra K.K., Fougat R.S., Ballani A., Thakur V., Yachana J and Bora M., 2014, Potential and application of molecular markers techniques for plant genome analysis, International Journal of Pure and Applied Bioscience,2(1):169-188
Oluoch, G., Zheng, J., Wang, X., Kashif, M., Khan, R., Zhou, Z., … Wang, K. (2016). QTL mapping for salt tolerance at seedling stage in the interspecific cross of Gossypium tomentosum with Gossypium hirsutum. Euphytica, 209(1), 223–235. https://doi.org/10.1007/s10681-016-1674-6
Park, Y. H., Alabady, M. S., Ulloa, M., Sickler, B., Wilkins, T. A., Yu, J., Stelly, D. M., Kohel, R. J., El-Shiny, O. M. and Cantrell, R. G., 2005, Genetic mapping of new cotton fiberloci using EST-derived microsatellites in an interspecific recombinant inbred (RIL) cotton population. Mol. Genet. Genomics, 274: 428-441.
Paterson, A. H., 1996. Making genetic maps. In: A.H. Paterson (Ed.), Genome Mapping in Plants, pp. 23-39. R. G. Landes company, San Diego, California; Academic Press, Austin, Texas
Paterson, A. H., Saranga, Y., Menz, M., Jiang, C. X. and Wright, R. J., 2003, QTL analysis of genotype × environment interactions affecting cotton fiber quality. Theor. Appl. Genet., 106(3): 384-396.
Genome,5(3):92-10
Qin, H., Guo, W., Zhang, Y. M. and Zhang, T., 2008, QTL mapping of yield and fiber traits based on a four-way cross population in GossypiumhirsutumL, Theor. Appl. Genet., 117(6): 883–894.
R. J. Elshire, J. C. Glaubitz, Q. Sun et al., “A robust, simple genotyping-by-sequencing (GBS) approach for high diversity species,” PLoS ONE, vol. 6, no. 5, Article ID e19379, 2011.
R. R. Mir, P. J. Hiremath, O. Riera-Lizarazu, and R. K. Varshney, “Evolving molecular marker technologies in plants: from RFLPs to GBS,” in Diagnostics in Plant Breeding, vol. 11, pp. 229–247, Springer, Amsterdam, The Netherlands, 2013.
Rafalski A. (2002) Applications of single nucleotide polymorphisms in crop genetics. Curr Opin Plant Biol 5, 94-100.
Rahman M., Sha heen T., Tabbasam N., Iqbal M.A., Ashraf M., Zafar Y., and Paterson A.H., 2012, Cotton genetic resources. A review, Agronomy for Sustainable Development, 32: (2): 419-432
Reinisch, A.J., Dong, J., Brubaker, C.L., Stelly, D.M., Wendel, J.F. and Paterson, A.H. (1994) A Detailed RFLP Map of Cotton, Gossypium hirsutum × Gossypium barbadense: Chromosome Organization and Evolution in a Disomic Polyploid Genome. Genetics, 138, 829-847.
Rong, J., Abbey, C., Bowers, J. E., Brubaker, C. L., Chang, C., Chee, P. W., Delmonte, T. A., Ding, X., Garza, J. J., Marler, B. S., Park, C., Pierce, G. J., Rainey, K. M., Rastogi, V. K., Schulze, S. R., Trolinder, N. L., Wendel, J. F., Wilkins, T. A., Williams-Coplin, T. D., Wing, R. A., Wright, R. J., Zhao, X., Zhu, L. and Paterson, A. H., 2004, A 3347-locus genetic recombination map of sequence-tagged sites reveals features of genome organization, transmission and evolution of cotton (Gossypium). Genetics, 166: 389-417.
Rong, J., Abbey, C., Bowers, J. E., Brubaker, C. L., Chang, C., Chee, P. W., Delmonte, T. A., Ding, X., Garza, J. J., Marler, B. S., Park, C., Pierce, G. J., Rainey, K. M., Rastogi, V. K., Schulze, S. R., Trolinder, N. L., Wendel, J. F., Wilkins, T. A., Williams-Coplin, T. D., Wing, R. A., Wright, R. J., Zhao, X., Zhu, L. and Paterson, A. H., 2004, A 3347-locus genetic recombination map of sequence-tagged sites reveals features of genome organization, transmission and evolution of cotton (Gossypium). Genetics, 166: 389-417.
Rong, J., Feltus, F. A., and Waghmare, V. N., 2007, Meta-analysis of polyploid cotton QTL shows unequal contributions of subgenomes to a complex network of genes and gene clusters implicated in lint fiber development. Genetics, 176(4): 2577–2588.
Russell J.R., Fuller J.D., Macaulay M., Hatz B.G., Jahoor A., Powell W., and Waugh R., 1997, Direct comparison of levels of genetic variation among barley accessions detected by RFLPs, AFLPs, SSRs and RAPDs, Sachidanandam R., Weissman D., Schmidt S.C., Kakol J.M., Stein L.D., Marth G., Sherry S., Mulikin J.C.,
Mortimore B.J., Willey D.L., Hunt S.E., Cole C.G., Coggill P.C., Rice C.M., Ning Z.M., Rogers J., Bentley D.R. Pui-Yan K., Mardis E.R., Yeh R.T., Schultz B., Cook L., Davenport R., Dante M., Fulton L., Hillier L., Waterston R.H.,
Samer, E. M. I., Sami, S. A., Abdel-Kader, Y. G. and Ebtissam H. A. H., 2015, Linkage map construction and detection of QTLs associated with earliness, fiber quality and yield in an inter specific cross between Gossypiumhirsutum L. and Gossypiumbarbadense L. Int. J. Advanced Res., 3(3): 637-649.
Santoshkumar.M., 2010, Genetic and quantitative trait loci analysis for yield and fiberquality traits in cotton (Gossypium spp.), M. S. thesis, Tamil Nadu Agricultural University, Coimbatore, India.
Saranga.Y., Menz, M., Jiang, C. X., Wright, R. J., Yakir, D. and Paterson, A. H., 2001, Genomic dissection of genotype x environment interactions conferring adaptation of cotton to arid conditions. Genom. Res., 11(12): 1988-1995
Shaheen, T., Asif, M. and Zafar, Y., 2009, Single nucleotide polymorphism analysis of MTSHSP gene of Gossypiumarboreum and its relationship with other diploid cotton genomes, G. hirsutum and Arabidopsisthaliana. Pakistan J. Botany, 41(1): 177-183.
Shen, X. L., Guo, W., Lu, Q., Zhu, X., Yuan, Y. and Zhang, T., 2007, Genetic mapping of quantitative trait loci for fiberquality and yield trait by RIL approach in upland cotton. Euphytica, 155 (3): 371-380.
Shen, X., Guo, W. and Zhu, X., 2005, Molecular mapping of QTLs for fiber qualities in three diverse lines in Upland cotton using SSR markers, Molecular Breeding, 15(2):169–181.
Steemers FJ, and Gunderson KL. (2007) Whole genome genotyping technologies on the bead array platform. Biotechnol J 2, 41-49.
Tang, S., Zhonghua, T., Tengfei, Z., Fang, X., Liu, F., Liu, D., Zhang, J., Liu, D., Wang, S. Zhang, K., Shao, Q., Tan, Z., Andrew, H. P. and Zhang, Z., 2015, Construction of genetic map and QTL analysis of fiber quality traits for Upland cotton (Gossypiumhirsutum L.). Euphytica, 201:195–213
Tanksley, S. D., (1983). Molecular markers in plant breeding. Plant Mol. Biol. Rep., 1 : 3-8.
Thiel, T, Kota, R, Grosse, I, Stein, N, and Graner, A (2004). SNP2CAPS: a SNP and INDEL analysis tool for CAPS marker development. Nucleic Acids Res. 32, e5.
Udall JA, Swanson JM, Haller K, et al. A global assembly of cotton ESTs. Genome Res. 2006;16:441–450. Ulloa M., and Meredith W.R. Jr, 2000, Genetic linkage map and QTL analysis of agronomic and fiber traits in an
intraspecific population, Journal of Cotton Science, 4(3): 161-170
Van Deynze A, Stoffe K, Lee M, et al. Sampling nucleotide diversity in cotton. BMC Plant Biol. 2009;9:125. Vos P, Hogers R, Blecker M, Reijans M, Van de Lee T, Hornes M, Fritjters A, Pot J, Peleman J, Kuiper M, M
Zabeau. 1995. AFLP: a new technique for DNA fingerprinting. Nucleic Acids Research 23, 4407- 4414. Wang S, Basten C, Zeng Z. Windows QTL cartographer 2.5. Department of Statistics, North Carolina State
University, Raleigh, 2005
Wang, C. B., Guo, W. Z., Cai, C. P. and Zhang, T. Z., 2006, Characterization, development and exploitation of EST derived microsatellites in Gossypiumraimondii Ulbrich. Chin. Sci. Bull., 51: 557-561
Waqas M., Khan A.A., Ashraf J., Qayyum A., Ahmad M.Q, Iqbal M.Z, et al., 2014, Molecular Markers and Cotton Genetic Improvement: Current Status and Future Prospects. The Scientific World Journal Volume 2014, ArticleI D607091,1
Wendel J. F., Small R. L., Cronn R. C. and Brubaker C. L., Genes, jeans and genomes: reconstructing the history of cotton, in : van Raamsdonk L.W.D., Den Nijs J. C. M., 1999, Plant evolution of man-made habitats- Proceedings of VIIth Int. symposium of the Int. organization of plant biosystematists, Hugo de Vries Laboratory, Amsterdam, Netherlands.
Westengen, O. T., Huam, Z. and Heun, M., 2005, Genetic diversity and geographic pattern in early SouthAmerican cotton domestication,ǁ Theoretical and Applied Genetics, 110(2): 392–402.
Williams J.G., Kubelik A.R., Livak K.J., Rafalski J.A., and Tingey S.V., 1990, DNA polymorphisms amplified by arbitrary primers are useful as genetic markers, Nucleic Acids Research,18(22):6531-6535
Wright, R. J., Thaxton, P. M., El-Zik, K. M. and Paterson, A. H., 1998, D-subgenome bias of Xcmresistance genes in tetraploidGossypium (cotton) suggests that polyploid formation has created novel avenues for evolution. Genetics, 149(4): 1987-1996
Wu, J., Gutierrez, O. A., Jenkins, J. N., McCarty, J. C. and Zhu, J., 2009, Quantitative analysis and QTL mapping for agronomic and fiber traits in an RI population of upland cotton, Euphytica, 165(2): 231–245.
Yu, J. W., Yu, S. X., Lu, C. R., Wang, W., Fan, S. L., Song, M. Z., Lin, Z. X., Zhang, X. L. and Zhang, J. F., 2007, High-density linkage map of cultivated allotetraploid cotton based on SSR, TRAP, SRAP and AFLP markers. J. Integr Plant Biol., 49: 716-724.
Yu, J. Z., Kohel, R. J., Fang, D. D., Cho, J., Van Deynze, A., Ulloa, M., Hoffman, S. M., Pepper, A. E., Stelly, D. M., Jenkins, J. N., Saha, S., Kumpatla, S. P., Shah, M. R., Hugie, W. V. and Percy, R. G., 2012, A high density simple sequence repeat and single nucleotide polymorphism genetic map of the tetraploid cotton genome. G3, 2 (1): 43-58.
Yu, X., Wang. H., Zhong, W., Bai, J., Liu, P. and He, Y., 2013, QTL mapping of leafy heads by genome resequencing in the RIL population of Brassica rapa. PloS One, 8(10): e76059.
Zahra N., Shojaei-JesvaghaniF., Sheidai m., Farahani F., and Omran A., 2011, Inter simple sequence repeats (ISSR) and random amplified polymorphic DNA (RAPD) analyses of genetic diversity in Mehr cotton cultivar and its crossing progenies. African Journal of Biotechnology Vol. 10(56):11839-11847
Zhang H.B., Li Y., Wang B., and Chee P.W., 2008, recent advances in cotton genomics, International Journal of Plant Genomics
Zhang T., Qian N., Zhu X. Chen H., Wang S., Mei H., and Zhang Y., 2013, Variations and transmission of QTL alleles for yield and fiber qualities in upland cotton cultivars developed in China, PLoSONE, 8(2)
Zhang ZS, Xiao YH, Luo M, Li XB, Luo XY, Hou L, Li DM, Pei Y. 2005. Construction of a genetic linkage map and QTL analysis of fiber related traits in upland cotton. Euphytica 144, 91-99.
Zhang, K., Zhang, J. and Ma, J., 2012, Genetic mapping and quantitative trait locus analysis of fiber quality traits using a three-parent composite population in upland cotton (Gossypiumhirsutum L.). Molecular Breeding, 29(2): 335–348.
Zhang, T. Z., Yuan, Y. L., Yu, J., Guo, W. Z. and Kohel, R. J., 2003, Molecular tagging of a major QTL for fiberstrength in upland cotton and its marker assisted selection. Theor. Appl. Genet., 106: 262-268.
Zhang, T. Z., Yuan, Y. L., Yu, J., Guo, W. Z. and Kohel, R. J., 2003, Molecular tagging of a major QTL for fiberstrength in upland cotton and its marker assisted selection. Theor. Appl. Genet., 106: 262-268.
Zhang, Y., Lin, Z., Li, W., Tu, L., Nie, Y. and Zhang, X. (2007) Studies of New EST-SSRs Derived from Gossypium barbadense. Chinese Science Bulletin, 51, 2522-2531.
Zhang, Y., Wang, X, F., Li, Z. K., Zhang, G. Y. and Ma, Z. Y., 2011, Assessing genetic diversity of cotton cultivars using genomic and newly developed expressed sequence tag-derived microsatellite markers,ǁ Genetics and Molecular Res., 10(3): 1462–1470.
Zhang, Z. S., Xiao, Y. H. and Luo, M., 2005, Construction of a genetic linkage map and QTL analysis of fiber-related traits in upland cotton (Gossypiumhirsutum L.). Euphytica, 144(1-2): 91-99.
Zhang, Z., Hu, M., Zhang, J., Liu, D., Zheng, J., Zhang, K., Wang, W. and Wan, Q., 2009, Construction of a comprehensive PCR-based marker linkage map and QTL mapping for fiber quality traits in upland cotton (Gossypiumhirsutum L.). Mol. Breed., 24 (1): 49-61.