Diagrammatic-based Query Formulator
By
Le Ngoc Ha
Dissertation submitted in partial fulfillment of
the requirements for the
Bachelor of Technology (Hons)
(Business Information System)
SEP 2012
Universiti Teknologi PETRONAS
Bandar Seri Iskandar
31750 Tronoh
i
CERTIFICATION OF APPROVAL
Diagrammatic-Based Query Formulator
by Le Ngoc Ha
A project dissertation submitted to the Business Information System Programme
Universiti Teknologi PETRONAS
in partial fulfillment of the requirements for the Bachelor of Technology (Hons)
(Business Information System)
Approved by,
_____________________ Dr. Rohiza Binti Ahmad
UNIVERSITI TEKNOLOGI PETRONAS
TRONOH, PERAK September 2012
ii
CERTIFICATION OF ORIGINALITY
This is to certify that I am responsible for the work submitted in this project, that the original work is my own except as specified in the references and acknowledgements, and that the original work contained herein have not been undertaken or done by unspecified sources or persons.
___________________________________________ LE NGOC HA
iii
ABSTRACT
Database is a valuable asset of any organization. Working with database has become more and more frequent and necessary. Unfortunately, the current applications only support users with text-based queries which users have to input manually. No ad-hoc queries can be done unless the application user has some knowledge of SQL Queries. Consequently, this web-based application is developed as a tool for users to easily manipulate database. This application will present database as structured diagrams. This will allow users to have a concise and clear view of database. Besides, this application also supports real-time interaction, which will enable users to query the database interactively and visually. As a consequence, less time and effort will spent on querying database to get the required data.
iv
ACKNOWLEDGEMENT
I have taken efforts in this project. However, it would not have been possible without the kind support and help from many individuals and organizations. I would like to extend my sincere thanks to all of them.
My deepest thanks to Dr. Rohiza Binti Ahmad, Senior Lecturer of Computer Information Science department in Universiti Teknologi PETRONAS, for guiding, supervising, providing me with necessary information about the project and correcting various prototypes and documents of mine with attention and care. She has gone with me through the project and without her help I was not able to complete my project. I also would like to express my gratitude towards our Universiti Teknologi PETRONAS and all my respected professors in the university who have give me a great chance to undergo this project and also provide me with knowledge to complete it.
My thanks and appreciations also go to my colleagues in developing the project and people who have willingly helped me out with their abilities.
I would like to thank to my family for their help and their encouragement which assist me in completing my project.
v
TABLE OF CONTENT
CERTIFICATION OF APPROVAL . . . . . i CERTIFICATION OF ORIGINALITY . . . . . ii ABSTRACT . . . . iii ACKNOWLEDGEMENT . . . . . . . ivLIST OF FIGURE . . . . vii
LIST OF TABLE . . . . vii
CHAPTER 1: INTRODUCTION . . . . 1
1.1 Background of Study . . . . 1
1.2 Problem Statement . . . . 2
1.3 Objectives . . . . 2
1.4 Scope of Study . . . . 2
1.5 Limitation of the project. . . . 3
1.6 Feasibility of the project. . . . 3
CHAPTER 2: LITERATURE REVIEW . . . . . 4
2.1 Common problems with text-based query application . 4 2.2 Requirements for a new technique . . . . 6
2.3 Applications with similar concepts . . . . 7
CHAPTER 3: METHODOLOGY . . . . 13
3.1 RAD Methodology . . . . . 13
3.2 Prototyping-based Methodology. . . . . 13
3.3 Tools . . . . 16
3.4 Project Activities . . . . 17
3.4.1 Data and Requirement Collection . . . 17
3.4.2 Data and Requirement Analysis . . . 18
3.5 Key Milestone . . . . 19
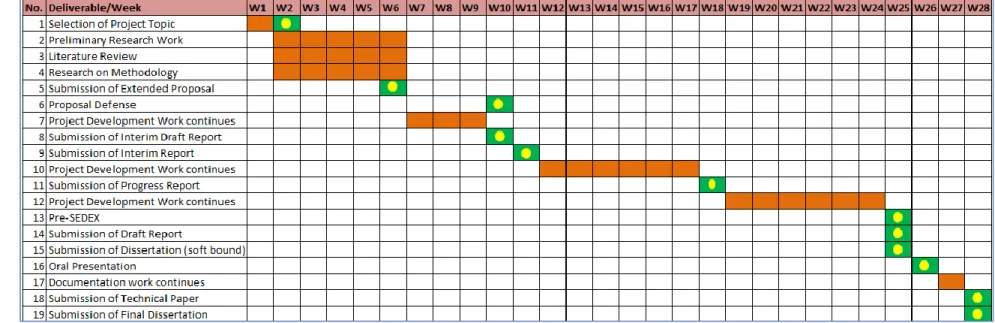
3.6 Gantt Chart . . . . 20
CHAPTER 4: RESULTS AND DISCUSSSION . . . . 21
4.1 System Planning Analysis . . . . . 21
4.1.1 Data Gathering & Analysis . . . . 21
4.1.2 Diagrams . . . . . . 31
4.1.2.1 Activity Diagram . . . . 31
4.1.2.2 Use Case Diagram . . . . 32
vi
4.2 System Design . . . 34
4.2.1 Architecture . . . 34
4.2.2 Architecture Entities Description. . . . 35
4.3 System Implementation . . . 36
4.4 Functionality Testing . . . 46
CHAPTER 5: CONCLUSION AND RECOMMENDATIONS . . 47
5.1 Conclusion . . . . 47
5.2 Recommendations . . . 47
REFERENCES . . . . 48
APPENDICES . . . I
Appendix A: Interview Plan . . . I
Appendix B: Interview Transcript . . . IV Appendix C: Functionality Testing Form . . . . XXII Appendix D: Functionality Testing Results . . . . XXIII
vii
LIST OF FIGURES
Figure 1: Expected Deliverables for each phase. . 3
Figure 2: VQS Diagram Sample. . . . 8
Figure 3: VORQL User Database Interface . . 9
Figure 4: Iconic SQL Interface . . . . 10-11
Figure 5: The prototyping-based methodology. . 14 Figure 6: Key Milestones of the project . . . 19
Figure 7: Gantt Chart . . . . . 20
Figure 8: Activity Diagram. . . . . 31
Figure 9: Use Case Diagram. . . . . 32
Figure 10: Class Diagram . . . . . 33
Figure 11: System Architecture . . . . 34
Figure 12: Welcome page . . . . 36
Figure 13: Interfaces of the program . . . 37-38 Figure 14: Diagram for database schema . . . 39 Figure 15: Table relationship interface . . . 40 Figure 16: SQL projection statement formulation. . 41 Figure 17: SQL projection for selected attributes. . 42 Figure 18: SQL selection statement formulation . . 43 Figure 19: SQL join statement formulation . . 44 Figure 20: SQL join statement with conditions . . 45
LIST OF TABLES
Table 1: Users’ Concept of Database . . 22
Table 2: Users’ Activities with database . . 22 Table 3: Users’ Techniques to interact with database . 24 Table 4: Problems undergone with database . . 24
Table 5: Difficulties with SQL . . . . 25
Table 6: Recommendations for an ideal diagram . 27 Table 7: Suggestions for the application . . 28
ABBREVIATIONS AND NOMENCLATURES
DBMS Database Management System
SQL Structured Query Language
SDLC System Development Life Cycle
RAD Rapid Application Development
GUI Graphical User Interface
HTML Hyper-text Markup Language
JDBC Java Database Connectivity JSP Java Server Page
1
CHAPTER 1
INTRODUCTION
1.1 Background
The term database refers to a collection of information which is usually organized and stored in digital form so that it can easily be accessed, managed or updated [1]. Data is stored to support relevant related activities which need it. For example, a list of customers’ information in a company is stored to keep track of its loyal customers and their buying habits. Thereby, data is an essential asset of any organization. The loss of data may result in a significant loss of revenue or reputation of the organization. Owing to the crucial role of data, coping with database is also important for users. However, dealing with database may be difficult for those who do not have a deep knowledge in it. Usually, the current Database Management Systems (DBMSs) requires users to have a specific understanding about database so that they can interact with database. Also, the database language, like Structured Query Language (SQL), is a text-based query language, thus users need to manually create the queries, which may cause difficulties to inexperienced users.
Therefore, this project is carried out to develop a web-based application which provides users with functions that allow all users, even those who have little knowledge of database to understand the database and interact with it effectively. Firstly, a function is developed to help users understand the relationships among tables in a database. The application will create a diagram for the database to visualize the relationship in a more easy and straightforward way. In addition, users can interact with the diagram and the application will automatically generate the corresponding query. It can solve the problem of writing a complicated query with full of potential syntax errors.
2 .
1.2 Problem Statement
The most popular type of database application in the market is the text-based query formulator, which requires users to manually enter the query into the console. To achieve that, users need to have a common knowledge of database to process with. Also, the database structure is becoming more and more complicated, thus, users may experience difficulty in understanding it. In addition, constructing a query has some drawbacks. A large amount of time may be spent and wasted on writing queries and also correcting syntax errors. As a result, there should be a tool to help users with understanding the database structure as well as supporting to generate the data query to get the desired data. This application will lessen the effort users have to waste for database process.
1.3 Objectives
To carry out a research on relevant techniques and current applications with similar concept.
To perform user requirement gathering and data analysis to design the system flows and architecture.
To develop a web-based application as a diagrammatic-based application, which helps users save time and effort in generating the diagram and creating queries automatically
To perform the functionality testing, evaluate the usability of the application and suggest for future development.
1.4 Scope of study
This project targets at developing a web-based application for users to help generate a diagram which helps visualize the relationships in the database and generate query automatically based on user’s interaction with the diagram. This application will help lessen the troubles users may face with when working with database.
3 1.5 Limitation of the project
This project has the limitation of working with an existing database. Due to time constraint, this system will process with database which has been created in the system. User can only select from a specific group of database schemas which are available in the system database.
Also, the constraint is on the queries the application can support. Only some most popular SQL queries are provided for users to process with database. Therefore, system is able to do the three types of SQL queries, which are projection, selection and table joining.
1.6 Feasibility of the project within scope and timeframe
This Final Year Project is conducted in two (2) consecutive semesters, so there are approximately 28 weeks to conduct research, gather data, analyze data, develop the application as well as get feedback from users for further enhancement. The deliverables for each phase of the SDLC are displayed in the following figure:
4
CHAPTER 2
LITERATURE REVIEW
2.1 Common problems with the text-based application
In this project, a web-based application is decided to be developed to help users deal with database diagram and query. A research has been conducted to identify reasons as well as the related applications which have been completed. According to Magar et al [2] in their paper, the writer mentioned that people commonly have to manage these databases via long commands or scripts that need entering on a console. The writers gave an example as these commands can be long enough to span 4 lines in some complicated cases. There is an undeniable truth that the longer the command, higher is the chance of making mistakes. This activity requires the administrator to be highly skilled to deal with. In Query by diagram: A fully visual query system [3], Angelaccio et al also stated the same problem with the current query language: “Traditional query languages are believed as not friendly enough for the causal user: s/he is requested to formulate queries in a textural language, without any iconic or spatial clues to help the querying process. “
In” Database systems: challenges and opportunities for graphical HCI” [4], Saywer stated same problems with the text-based query. He mentioned about the complexity in formulating and running queries on a database. It is believed that this activity is “incremental and error-prone task.” Also, users need to know about the query language syntax and semantics and have a mental model of the schema if they wish to perform activities with the database.
5
Francesca et al [5] talked about the disadvantages of SQL in the “VISIONARY: a Viewpoint-based Visual Language for Querying Relational Databases”. He stated that the query languages used for DBMSs often lack of intuitive understanding and visual aids. It causes troubles to inexperienced users and they are not able to take the full advantages of the tool. He stated the four (4) most common problems that an inexperienced user must face with when querying a DBMS by a traditional query language:
o Learning: Users have to spend a lot of time and put a lot of effort to understand all the basic principles of database theory.
o Difficult to use: Syntax is one of the problems for users since the syntax is hard to remember and hard to apply, too.
o Poor feedback: Usually, little feedback about the semantics of the query is sent to users.
o Little interaction: Finally, users do not receive any form of communication or interaction with the query-building process.
Siau [6] in the “A visual object-relationship query language for user database interaction” mentioned about one factor which affects the effectiveness and efficiency of information retrieval. The factor is the user-friendliness of the user-database interface. He stated that there is a low- priority assigned for database users’ interaction. Thus, inexperienced users are not supported when performing their tasks. Siau further presented another reason which contributes to the problems of database users, which is the complexity of the query syntax [6]. A complex data model will require a complex query language to manipulate and retrieve data. Inexperienced users may find it difficult to remember as well as to apply the syntax into specific cases.
6 2.1 Requirement for a new technique
As a result, Cinque et al [7] have clearly mentioned the requirement for a database system in the article “An expert visual query system” which was written in 1991. The writers suggested that a database system must be easily accessible both to skilled and inexperienced users so that they can obtain information at varying levels of detail depending on their purpose.
Ilker [8] mentioned about the visual-based query language. This language is different from other text-query languages since it has a graphical user interface (GUI) that allows users to construct the queries. With the advances in GUI, the visual-based query language is proposed to reduce the burden of users in generating data query.
In addition, Diskin [9] in “A Diagrammatic Logic for Object-Oriented Visual Modeling” had mentioned about the reason for a diagram requirement: that is the tendency to use pictures to explain something to other people. Usually, pictures are easier to remember and have stronger impact on our brain. When designing a software system, the picture becomes the diagrams or diagrammatic models. So, for inexperienced users, diagrammatic-based query should be a better solution compared to other traditional methods.
According to Sawyer [4], graphics have the potential to help users query a database more effectively, reducing the cognitive load by visualizing the data and the schema and reducing the syntactic knowledge required to be retained. Systems should allow users to interact with the data visualization to formulate queries. However, he also stated that the graphical querying may be different in other systems since it refers to a variety of different database user interface styles.
7 2.3 Applications with similar concepts
Balkir et.al [10] in “VISUAL A Graphical Icon-Based Query Language” has written about an application, which is described as “a graphical icon-based query language designed for scientific databases where visualization of the relationships are important for the domain scientist to express queries. Graphical objects are not tied to the underlying formalism; instead, they represent the relationships of the application domain.” The VISUAL uses the Object-Oriented Query Specification Model, meaning that a query is implemented as an object, and the query objects will interact with other objects during the processing of queries. Since using the Object-Oriented concept, VISUAL can utilize the advantages of class-subclass hierarchies, inheritance, overriding, and so on. Also, VISUAL applies the Client-Server Query Object Model: When a service of a query object is requested, the query object acts as a server, and the requesting query object becomes a client. The client-server approach to query modeling and processing is modular, or “each query object requests the services of a series of query objects that interact with each other in a modular fashion.”[10].However, this application mainly aims to serve for the scientific database, thus, it is not relevant for all the users, especially, the inexperienced users.
In “Graphical Interaction with Historical Databases “[11], Catarci suggested a user-oriented visual query system (called TVQE) for temporal data. The main idea of the system is to provide the user with a simple visual query environment. In his application, all the query activities are performed in the same way, thus help the non-expert users to interact with the database without understanding the data model or the syntax of the language. Also, the author’s purpose was to create a user-friendly environment for users, by designing the main window with several basic buttons for accessing to database. There are some buttons such as “Where?”, “When?”, “Data Vis” and “Time Vis” and three main windows named “Schema window”, “Interaction window” and “Data Visualization window” to support users with database queries.
8
In line with his research, Francesca et al [5] had also developed a visual query language based on an iconic-diagrammatic paradigm, naming Visual Query System (VQS). It enables users to access a relational database through a diagrammatic representation similar to an Entity/Relationship scheme. For the data query model, when users formulate a query, they can specify a primary relation (PR) which defines an inference tree, similar to a perspective for accessing data. In an inference tree, the PR is connected to every other relation through one path of relationships; thus, it become possible to refer attributes belonging to any relation without formulating the necessary joins. The following figure is one example of diagram generated by VQS:
Figure 2: VQS Diagram Sample. [5]
The non-professional users of a VQS can be classified according to their experience, their VQS usage frequency, their knowledge of the database and their queries forecast. There are three (3) main types of users for VQS, which are: naive, casual and
uninformed. Users are allowed to formulate the queries by selecting the primary concept, then deciding the attributes which they wish to retrieve and express the selection conditions. The inexperienced users may get help by the pre-defined visions by expert users. Thus, users can understand the database semantics and proceed with queries
9
formulation without knowledge of the theory. He describes the vision as “a visual object aimed at conveying a high-level, clear and expressive representation of a relational database, largely independent of the structuring of data within the database schema.” This vision is built by expert users based on the semantics of the database and the requirements from inexperienced users who will access to the database.
Another application is developed by Siaw[6], naming Visual Object Relationship Query Language (VORQL) for the object-relationship (OR) model which is based on the object-oriented approach. He used the OR model since he wanted to provide the data independence. Also, he designed a simple database-interface with icons, menu, visual form-structure and a simple “point-and-click interface” for generating queries [6]. Below is his database interface:
Figure 3: VORQL User Database Interface. [6]
There are five steps in VORQL query specification: Duplicate, Restrict, Action, Condition, and Format. Queries are formulated visually in VORQL by using a mouse
10
clicking on the objects, relationships, or attributes to be included in the query and specifying the condition using various form structures. Also, Siaw used Codd’s criteria for completeness as a benchmark for measuring the expressive power of VORQL. Codd’s Theorem mentions that “relational algebra and the domain-independent relational calculus queries, two well-known foundational query languages for the relational model, are precisely equivalent in expressive power. That is, a database query can be formulated in one language if and only if it can be expressed in the other.” [12].Since relational algebra is relationally complete it follows that, VORQL is also relationally complete. In short, the query language used in his application is believed to be simpler and more flexible than the traditional SQL query. Another advantage of VORQL is the data independence physically and logically. And, Siaw had proved that VORQL is relationally complete and as powerful as the traditional database languages like SQL.
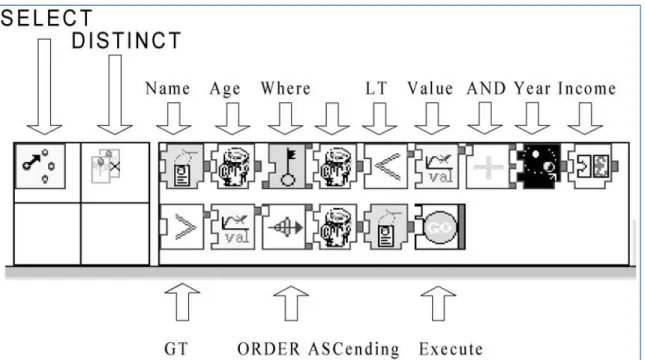
In “Iconic SQL: Practical Issues in the Querying of Databases through Structured Iconic Expressions” [13], Shaman et al reported on an iconic interface that implements a restricted subset of SQL commands for querying a database. Database queries and the query language’s tokens are represented by icons. To construct a query, the user composes structured iconic expressions based on the grammar of the iconic language.
11
(b) Query Assembly Frame of the iconic interface. Figure 4: Iconic SQL Interface
As can be seen from Figure 4, the SELECT statement is divided into two main parts: a) Header: The SELECT verb and all its adjectives, such as DISTINCT, ALL. b) Selection Criteria: it is divided into three sub categories:
i) Attributes Selection/ Search: it specifies the fields to be retrieved. ii) Criteria: Attributes, Operators and Values.
iii) ORDER: Sort of data.
To use the iconic interface, user selects the icons in a certain sequence, and click Go to activate the program. The program then generates the SQL statement. Throughout the session, debugging information is output to show progress of the SQL statement parsing and building process and give details of syntax errors when they occur.
Actually, they are systems developed for research purpose and do not go into market. A research about database applications in the market currently shows that not many applications that provide the functionality of allowing users to interact with diagram for constructing data query. Some applications having the same concepts are: Easy Query Builder, Razor SQL Query Builder or Active Query Builder. Instructions from Active
12
Query Builder [14] mentions a solution for users as users may easily add objects to the query by dragging them from the database objects tree or using the special Add Object window. Objects linked with foreign keys are joined automatically.
In short, there are several applications with the same concept as a diagrammatic/iconic- based query formulator. However, most of them serve for research purposes or for people with a specific knowledge of database. As a result, the applications are not easy for inexperienced users to use. Consequently, this application is developed to help users, especially inexperienced users to work with database in an easier and more effective way.
13
CHAPTER 3
METHODOLOGY
3.1 RAD methodology
RAD methodology, or Rapid Application Development methodology, is a new system development methodology that emerged in the 1990s. RAD is a concept that products can be developed faster and of higher quality. James Martin, in his book first coining the term, wrote, “Rapid Application Development (RAD) is a development lifecycle designed to give much faster development and higher-quality results than those achieved with the traditional lifecycle. It is designed to take the maximum advantage of powerful development software that has evolved recently.” [15].This methodology helps adjust the SDLC phase so that it could get some parts of the system quickly to be delivered to customers. By this, customers can understand the application and suggest revisions to help improve system’s functionality.
RAD methodology has the advantage of increased speed of development since developers can quickly deliver parts of the application to the users. Quality of the product is also increased because of the involvement of users in early stages of development.
3.2 Prototyping-based methodology
The type of methodologies following the RAD concept used in this project is prototyping. A prototyping-based methodology will perform the analysis, design and implementation phase concurrently. After the first prototype is completed, it will be delivered to users for comments. Based on feedback from users, we will analyze, re-design and re-development the second prototype. The process is then repeated and all
14
these three phases are performed concurrently until the system is completed. Users will be provided with the system very quickly to interact with and will involve in the development of the system development process.
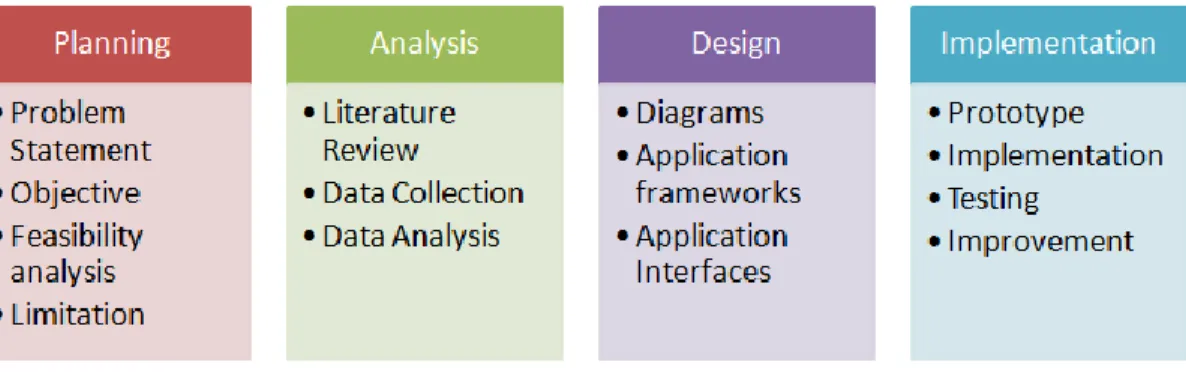
The core elements in the prototyping-based methodology are displayed in the following diagram:
Figure 5: The prototyping-based methodology [16]
Planning: This phase serves the purpose of understanding the reason for this application should be built. In this phase, problem statement for the project should be clearly understood. The purpose for building this system needs mentioning, too. The scope and limitation of this project are required to be recognized before starting the project as well. Also, the feasibility analysis needs conducting to examine the key aspects of the project.
15
Analysis: In this stage, the developer will carry on research about current situation of database applications. The main deliverable for this stage is the literature review, which states out the research related to our topic. Additionally, in this stage, developer has to understand users’ requirement by gathering information via interview with users. It is necessary to realize users’ requirement before starting developing this application.
Design: Design phase is the stage which will decide how the system will operate in the future. For this stage, developer should prepare the application framework, the diagrams (Activity Diagram, Use Case Diagram, Class Diagram) and Application interfaces as the deliverables.
Implementation: This is the final stage in SDLC, which involves the actual construction and installation of the application. It refers to the final process of moving the solution from development status to production status .In this stage, the application is installed and the application is in the steady-state production. Also, this stage covers the maintenance of the application and any further updates in the future.
Since prototyping-based methodology is used in this project, the prototypes will be given to users to ask for their feedbacks. System will gradually be completed based on users’ recommendation.
16 3.3 Tools and Software involved
3.3.1 Eclipse Integrated Development Environment (IDE)
Eclipse is an open source, extensible, multi-language software development environment, comprising an IDE (Integrated development environment), a Java EE support, a graphical HTML/JSP/JSF editor, database management tools and a library of plug-ins for programmers to develop their program.
3.3.2 Sun Java SE Development Kit (JDK)
The Java Development Kit (JDK) is an Oracle Corporation product aimed at Java developers.The JDK has as its primary components a collection of programming tools. With this, we can quickly build web-based as well as full-featured applications.
3.3.3 My SQL Query Browser 5.5
The MySQL database is one of the world's most popular open source databases because of its high performance, high reliability and ease of use. It is being used by many of the world’s largest organization to develop and maintain their systems. Also, MySQL can run on multiple platforms like Linux, Windows, Mac OS, Solaris, thus we can flexibly use it in our system.
3.3.4 Apache Tomcat Server 7
Apache Tomcat is an open source web server and servlet container developed by the Apache Software Foundation (ASF). Tomcat implements the Java Servlet and the Java Server Pages (JSP) specifications from Oracle Corporation, and provides a "pure Java" HTTP web server environment for Java code to run.
17 3.4 Project activities
3.4.1 Data Collection
There are two types of data, which are primary data and secondary data. Primary data refers to the data gathered based on our own objective and designed by us. It has not been previously published elsewhere yet. Data is observed and collected directly from the source of information. The primary data will serve for the researcher’s own purpose.
Secondary data, on the other hand, is the data which already exists. This data is not originated by the investigator but collected by other people. This type of data usually comes from newspaper, magazines, articles, books, reports, journals, and so on. The main advantage of this type of data is the relevance of it. We can obtain the secondary data easily and conveniently. Also, it can save our time and finance for data gathering. However, since this data is not developed based on our own requirement, it is very difficult to find secondary data which exactly fulfils the needs of the current research. Thus, we need to extract only the relevant information to serve our investigation.
Primary data: a semi-structured interview has been carried out to understand users’ requirements. In the interview, both closed-ended questions and open-ended questions were used to gather information from users. Closed-open-ended will give a specific answer from users but could not explain the way the answer is. Thus, open-ended questions are needed to help gather richer information. Please refer to the Appendices for the interview plan and interview transcripts.
18
Secondary data: information gathered from the research conducting about related projects. The research was performed in articles, scientific journals and other relevant papers both on internet and in the university library.
3.4.2 Data Analysis
For this project, the data gathered is qualitative data. Thus, the analysis was generated based on the questions asked in the interview. First, all the answers of random users were collected and specified. After that, the result was analyzed and discussed. There are some techniques which can be used for qualitative analysis, such as observer impression, frequency count technique or coding. During the research, we have to use several techniques altogether to analyze the gathered data. The result of the interview and the data analysis are discussed in Chapter 4: Result and Discussion.
19 3.5 Key Milestone
The key milestone for this project is shown as the following figure:
Figure 6: Key milestones of the project
This key milestone includes all the important activities taken places in the two semesters. The main activities including in the project are: understanding users’ needs, conducting research, gathering users’ data, preparing the tools and devices involved, developing the application, performing the testing and gathering the feedbacks from users. Besides, all the documents needed should be completed within the assigned time frame.
20 3.6 Gantt Chart
21
CHAPTER 4
RESULTS AND DISCUSSION
4.1 System Planning Analysis:
4.1.1 Data Gathering & Analysis:
A semi-structured interview has been conducted to five (5) potential users for this application. Interviewees include IT students, non-IT students and an employee from an auditing firm. This interview took approximately half an hour for each person. There were seven (7) main questions asked during the interview and a few additional questions to help clarify the points of views of interviewees. One interviewee was abroad and the interview was conducted via Skype, thus it could not be recorded. Others were recorded during the interview sections. After taking notes of the answers from interviewees, I have summarized the opinions, ideas as well as recommendations from the 5 respondents.
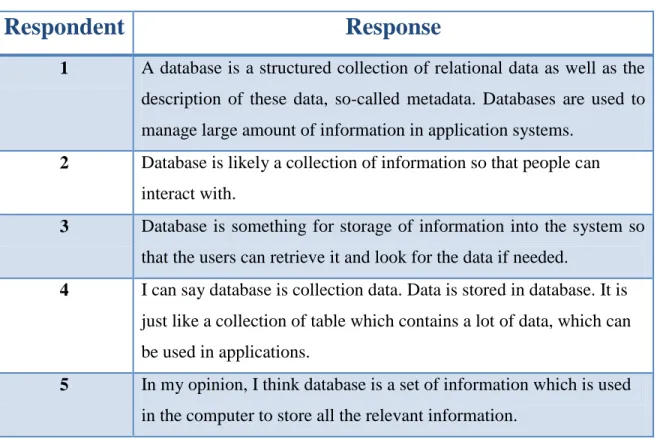
Users’ Understanding about Database:
Table 1 presents the responses from each interviewee on the question “What do you know about database?” Based on the answers from the interviewees, it can be summarized that interviewees have a general understanding about database as a collection of data used for storage of large amount of information in application systems and for retrieval purposes. The details of answers from interviewees are listed in the following table:
22
Table 1 Users’ Concept of Database
Respondent
Response
1 A database is a structured collection of relational data as well as the description of these data, so-called metadata. Databases are used to manage large amount of information in application systems.
2 Database is likely a collection of information so that people can interact with.
3 Database is something for storage of information into the system so that the users can retrieve it and look for the data if needed.
4 I can say database is collection data. Data is stored in database. It is just like a collection of table which contains a lot of data, which can be used in applications.
5 In my opinion, I think database is a set of information which is used in the computer to store all the relevant information.
Activities with Database:
Table 2 shows the answers from respondents when they were asked regarding to the activities they usually do with a database. From the responses, there are several activities which are often performed: selection, table joining or data update. The answers are as in the following table:
Table 2 Users’ activities with database
Respondent
Response
1 The main activity with clients’ databases is querying the necessary data to use as customized audit reports. In line with these data queries, we usually use select statements with detailed query conditions. Nested query, grouping and table joining statements are also used frequently, especially in the database systems with high
23
level of data relationships. In addition, since the tables and column headers are usually named in a coded naming convention for programming purpose, we also use alias assignment statements for these names for an easier understanding of long queries.
2 Most of the time, I want to sort the information in my table. I also want to add more records or update the information. I also access the information from the database. I rarely work with the database, just work with the excel files during events.
3 Usually I need to key in the data. I meant, I have to input information into the database. Sometimes, I need to find specific information from the database which suits to my requirements for my work. 4 I learned about database in Structure Programming and Database
Course. We learned how to create table and also select data from table. Recently, I have also learned about database usage in VB.NET. Basically, I learned about how to make table, add data to table, and get data back from the table.
5 Activities I usually work with database is updating the data. Also, adding the new values into the table is one of my frequent activities. I need to extract the data to generate the meaning and valuable data needed for my work, too.
Techniques used to interact with database:
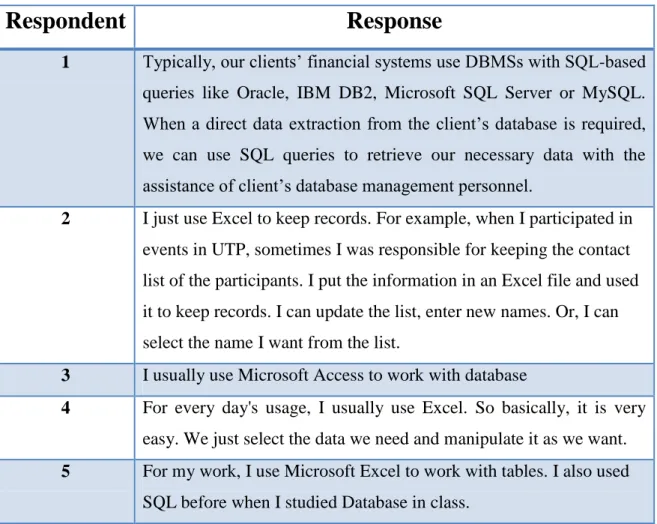
This table displays the interviewees’ responses to the question mentioning about the techniques they prefer using to work with database. Basically, non-technical users usually choose Excel as a method to work. For technical users, their options may vary: Microsoft Access, Oracle or My SQL.
24
Table 3 Users’ techniques to interact with database
Respondent
Response
1 Typically, our clients’ financial systems use DBMSs with SQL-based queries like Oracle, IBM DB2, Microsoft SQL Server or MySQL. When a direct data extraction from the client’s database is required, we can use SQL queries to retrieve our necessary data with the assistance of client’s database management personnel.
2 I just use Excel to keep records. For example, when I participated in events in UTP, sometimes I was responsible for keeping the contact list of the participants. I put the information in an Excel file and used it to keep records. I can update the list, enter new names. Or, I can select the name I want from the list.
3 I usually use Microsoft Access to work with database
4 For every day's usage, I usually use Excel. So basically, it is very easy. We just select the data we need and manipulate it as we want. 5 For my work, I use Microsoft Excel to work with tables. I also used
SQL before when I studied Database in class.
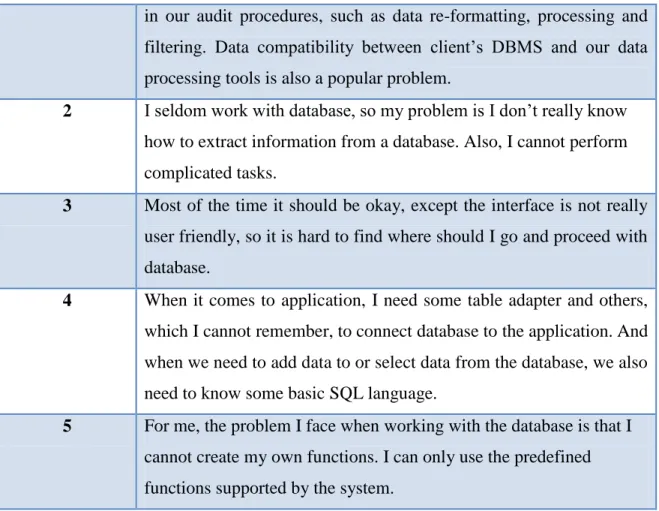
Problems faced when working with database:
Table 4 presents the responses from interviewees when they were asked about problems encountered when working with database. A summary of problems which users usually face with when they process with database is in the following table:
Table 4 Problems undergone with database
Respondent
Response
1 In term of data extraction, we must understand how we are going to extract the data we need, including data structure and relationships. Besides, extraction of large data amount may also cause difficulties
25
in our audit procedures, such as data re-formatting, processing and filtering. Data compatibility between client’s DBMS and our data processing tools is also a popular problem.
2 I seldom work with database, so my problem is I don’t really know how to extract information from a database. Also, I cannot perform complicated tasks.
3 Most of the time it should be okay, except the interface is not really user friendly, so it is hard to find where should I go and proceed with database.
4 When it comes to application, I need some table adapter and others, which I cannot remember, to connect database to the application.And when we need to add data to or select data from the database, we also need to know some basic SQL language.
5 For me, the problem I face when working with the database is that I cannot create my own functions. I can only use the predefined functions supported by the system.
Difficulties with SQL (if any):
This table lists down all the answers from interviewees for the question: “Do you face any difficulties with SQL?” This question is only applicable for interviewees who have known about SQL. The difficulties with this text-based query are the syntax complication and error- exposure risk. Details of the answers are:
Table 5 Difficulties with SQL
Respondent
Response
1 SQL query requires certain technical knowledge and practices of database and might cause difficulties for business users to query, even though they are familiar with the database table structure and relationship. Besides, although the structure of SQL languages is
26
quite similar, different DBMSs might have minor syntax differences that can make an SQL query script doesn’t work. Preparing a complex nested SQL query on multiple tables is also a time-consuming task, even with experienced database administrators. Beside the potential syntax errors due to the complexity of the query, it is not easy to test and debug an SQL script, especially when the script is written by another person.
2 Not relevant since respondent does not know about SQL
3 SQL is complicated, especially the code. We have to remember the syntax.
Also, I may create syntax errors when writing the code, then, it takes time to fix the errors, too.
4 The problems come when we apply the syntax. For inexperienced programmer like me, it is complicated just to select or add data into the table, especially when the table contains a lot of rows and columns and many conditions applied. Yes, it is also time consuming. We need to type command manually, which are also prone to errors. 5 Usually, it is very complicated to use SQL. The syntax of SQL is
hard to remember. Sometimes, it may confuse the users, especially, in the nested tables. If we use the simple syntax for the complicated or nested tables, we need to use a series of sequential syntaxes. It may cause errors when we write them.
Recommendations for an ideal diagram:
Table 6 displays the responses from interviewees when they were requested to describe their expected diagram. This question aims to gather users’ expectation about a diagram. Interviewees had suggested many different forms of diagrams. Details for answers can be found in the following table:
27
Table 6 Recommendations for an ideal diagram
Respondent
Response
1 A database diagram should clearly describe the relationships between tables. Data properties might not necessarily be described in details, but table names, column headers and key fields should be presented in a visual layout so that user can know exactly which pieces of data they need in each table. The whole diagram should be supported with a drag-and-drop user interface, so that user can re-organize the diagram as they desire for a better view.
For a diagram with many tables and relationships, the diagram should be drawn in a reasonable layout so that the lines showing table relationships do not cross others too much. These lines should have different colors and styles (dash, dot, arrows…) so that users won’t be confused if there are too many crossed lines.
2 I want to view a less rigid and less scientific diagram. I want a more specific picture/icon to represent the diagram. For example, if customer, I want to see it like a person icon. I want the characteristics of the tables to be displayed only when I click on the name of the table. I do not want to view so many words in the diagram. For the interaction with the diagram, I prefer clicking than drag-and-drop since I may mistake in choosing a nearby attribute. I also want the diagram to be displayed in the 3-Dimensional. Should be simple and more eye-catching so that even inexperienced users can easily understand it.
3 One button, when you click, it will appear in a pop up window/dialogue, then user can key in into the diagram. After that, users can close the pop up window and process with another section. What I meant is there is a big table, then other tables or buttons will be inner the table. For selecting, maybe it will have a drop-down box for users to select certain value of the attributes.
28
4 I think it would be better if you can give us the diagram that looks like the folder tree. And also the dialogue box where we can insert the conditions we want. I think tick box and drop down menu will also be useful and make task easier.Yes, the column should also be shown and it is also beneficial if you can provide us the rows also. 5 As my experience, there are some cases when the table may contain
many fields. Thus, I think there should be a search box in the table name, so that users are allowed to enter their desired field. If we make it like a table or a drop down list, it may be very space-consuming and users cannot focus on their requested field. In addition, I want the hidden feature for the diagram, so that only the selected tables are shown whereas the other tables are shaded or hidden.
Suggestions for the application
The last question which the interviewees were asked was about their suggestions for this application. Interviewees were told about the idea for this project and asked to add more suggestions to make it more practical. The summary of suggestions is listed in the table 7.
Table 7 Suggestions for the application
Respondent
Response
1 I think it would be great if the application has a feature to automatically generate the visual diagram with all of its relationship when user imports a data definition SQL script. You know, there are many tools – like the popular tool phpMyAdmin for MySQL – that provide a GUI for user to create a database schema, define tables and relationships and generate SQL script for these actions automatically. It would be convenient for users to import these scripts into your
29
application and get a diagram ready for them to interact.
2 I recommend you to update the information for the database. Sometimes, we need to update the data also.
3 I want your application to allow users to input into the data. Also, I want to upload a new database into your application and the diagram can be displayed to users.
4 I think it would also be nice if it can give us additional functionalities such as selecting data or adding data. I think functions such as easily select data would be nice. I hope it is as easy selecting rows and columns in Excel.Also, give us the ability to filter.
5 I suggest developing this application to become an educational application. It may become a self-study application for students who study database. Also, I hope this application can support other functions regarding to data update, insertion or deletion.
From the result of the interviews, it can be summarized as:
Inexperienced users have limited understanding about database. They perform their work by using the predefined functions only.
Users face problem with the current text-based query because of the syntax application and syntax errors.
Users usually perform inserting values into the table, retrieving information from a database and updating database.
Users want to have a more user friendly application so that those who have limited knowledge about database can easily work with it.
Some recommendations from users for the application for further development:
o Hidden attributes from the tables, which are displayed only when chosen by users.
o Pop up windows/dialogues should be supported in the application to make the activity simpler for users.
30
o User friendly is required for inexperienced users to work with database.
o More supports for users (values of attributes should be displayed, too)
Based on the result of the interviews with selected interviewees, we can summarize the following problems and user requirements and propose the solution for this project:
SQL queries based on text-based concept may cause difficulties to users, thus, it should be a new method to generate SQL queries. As a result, this application is built to generate the SQL queries based on user’s interaction with diagram.
Inexperienced users require a user-friendly application which is easy to use and easy to understand. Consequently, this application needs simple but attractive interfaces together with proper and detailed instructions for users.
Diagram should clearly state the relationship among tables in the database schema. However, it needs be simple for inexperienced users, too. Therefore, the diagram designed in this application is easy to view and understand.
31 4.1.2 Diagrams
4.1.2.1 Activity Diagram
For this application, the activity starts when user clicks on the selecting a database from the list of databases available in the system. The application will display the corresponding diagram for the selected database. Then, users can interact with diagram to get the desired SQL queries. The activity will end when user decides to stop interacting with diagram for next query. The following figure represents the activity diagram for this application:
32 4.1.2.2 Use Case Diagram
This application is a personal application, thus it has only one type of user: application user. Figure 4 below shows the overall functions that the application user can do:
Figure 9: Use Case Diagram
The user of this application can have three main functions as stated in the diagram, which are: database selection, diagram interaction and next query confirmation.
33 4.1.2.3 Class Diagram
The class diagram describes the class name, attributes and methods for each class in the application. In fact, this class diagram aims to describe this application, not for any specific database in the list. Figure 5 displays the class diagram:
34
4.2 System Design:
Design phase is also considered as one of the most challenging parts in system development life cycle phase. In this phase, the design of the system must be carefully developed. This phase is to ensure that user’s interactivity with the system meets user’s expectation.
4.2.1Architecture
The SQL formulator application’s architecture can be summarized in the following figure. As shown in the Figure 11, it has three main components which will be described in details in Architecture Entities Description:
1) The Database 2) The Web Server 3) The Web Application
There are numbers web browsers available for users, however, due to time limitation; this application is developed for Mozilla Firefox solely.
35
4.2.2 Architecture Entities Description
Database
The database stores all required information that can be manipulated from the application using SQL statements. The database server for this system is MySQL which is an open source database server. The database system comprises of a Windows system that runs a MySQL Database with installed JDBC (Java Database Connectivity) drivers and connectors. The hardware architecture which this system runs on is local host using developer’s laptop. The hardware specifications include Intel® Core™ 2 Duo T6600 @ 2.20 GHz with a clock speed of 1584MHz and a 300.0 GB Hard drive running on 3 GB of DDR2
DSRAM.
Web Server Module
The web server runs on the same hardware with the database server. It uses the Apache Tomcat Server 7, server software available for the Windows operating system.
Web application
In this application a web template is designed to accommodate users with their interaction to the system. Java Server Page (JSP) is used to serve most of the pages in the system application. HTML (Hypertext Markup Language) together with JSP and CSS are used to generate aesthetical and user-friendly interfaces. Also, Ajax (Asynchronous JavaScript and XML) – a technique for creating fast and dynamic web pages – is applied to support creating interfaces.
The web application acts as the medium between the database system and the user interface as it retrieves the information stored in the database and displays it on a web page for a web browser to view the result.
36
4.3. System Implementation:
This is the phase where the programming of a prototype takes part as well as the installation of relevant software and their configurations. The processes in this phase are:
1. Software installation. 2. Software configuration.
3. System functionalities development.
Below are the descriptions of the functions and scopes for the system prototype: Load the page:
This page is the first screen of the application. It serves as a loading page and will be displayed in a few seconds and the program will directly go to the home page.
Figure 12: Welcome page.
View the homepage:
On the navigation bar, there are several options for users to select: Home page, About us, Program and FAQ. Users can click on the menu to choose a specific page:
37
(a) Home Page
38
(c) Program
(d) Frequently Asked Questions (FAQ) Figure 13: Interfaces of the program
Select Database Schema and View the Diagram
For the main functions of the application, user needs to choose the “Program” in the navigation bar. The list of database existing in the system will be displayed for users. When user selects one specific database, the diagram of it will appear on the screen:
39
Figure 14: Diagram for database schema.
In this diagram, the circles represent the tables, and the lines connect these tables which have relationships. As the requirement for the application is that the diagram need to be easy to understand, so the diagram shows to the users only the tables in the database schema.
View the Relationship between tables:
In order to view the relationship between two specific tables which is represented by the connection line, users need to click on the line. A pop up window will appear, showing the relationship of the two selected tables.
40
Figure 15: Table relationship interface
Formulate SQL queries:
This application is developed to generate the three main types of SQL queries: Projection, Selection and Join Statement.
Projection:
Based on user’s selection either on the table name or attribute name, the SQL statement will be generated automatically in the text box. The Submit button allows user to submit this SQL to the database. The result of this SQL query will then be returned back to the user.
41
(a) Automatic SQL query generation.
(b) Result of the SQL query Figure 16: Projection statement formulation
Users are allowed to select specific attributes from the table. To achieve that, users need to click on the attribute name and shift + click to select multiple attributes.
42
(a) Automatic SQL query generation.
(b) Result of the SQL query
Figure 17: SQL projection for selected attributes Selection:
To add conditions for the SQL statement, there is the button “Add condition” on the page. By clicking this button, users can select multiple conditions from the attributes available on the table. There is a question mark next to the attribute name, which supports users to formulate the condition. After inserting the condition, user click
43
button name “Submit SQL condition” to let the application update the SQL
statement. If users want to add more conditions, repeat the process from clicking the question mark.
From the second condition onwards, users have to select either “AND” or “OR” for the statement.
(a) SQL query formulation
(b) Result of the SQL query
44 Join:
In order to perform joining two tables, users first select one table, and again, use shift + click to select the second table. For joining tables, users can also perform selecting multiples attributes and adding conditions (if any).
(a) SQL query formulation
(b) Result of the SQL query Figure 19: SQL join statement formulation
45
Users can apply selecting multiple attributes or adding conditions when perform joining tables. The following figures are screenshots of this case:
(a) SQL query formulation
(b) Result of the SQL query
46
4.4 Functionality Testing:
Once the application is developed, a functionality testing is conducted to evaluate the usability of it. Totally, there are 12 cases in the testing plan for users to perform projection, selection and tables join. The Functionality testing cases are described in the Appendix C. The result of the functionality testing can be summarized as following:
Projection: The application can execute the projection for all attributes and selected attributes in a table. Users click on the table names or specific attributes name to alert the application about their expected SQL queries.
Selection: SQL select statements and the corresponding records from database have been generated correctly. Users can add conditions for SQL queries for selecting a group of records that satisfying the conditions.
Join: The application can manage to formulate the table join statements for all cases: all attributes or selected attributes together without conditions or without conditions.
It can be concluded that this application has successfully completed the main functions as defined above. Please refer to Appendix D for the detailed results of this testing.
47
CHAPTER 5
CONCLUSION AND RECOMMENDATIONS
5.1 Conclusion
Based on the results of research and interview, it is concluded that current applications proving the text-based query method have several drawbacks. Users who are inexperienced in processing with database find several problems in generating queries to extract database. Thus, there is a demand for an alternative method which is easier for users to understand and process.
As a result, this project has been conducted and achieved the aforementioned objectives: A research on relevant techniques and current applications with similar concept was carried out and presented in chapter II: Literature Review
Interviews with groups of potential users were held to obtain user requirements. The respondents were analyzed afterwards and the results were reported in chapter IV: Results and Discussion, part 4.1.1: Data gathering & Analysis. Based on this result, the system flows and system architecture were designed before the implementation phase took place. Please refer to chapter IV: Results and Discussion, part 4.1.2: Diagrams and chapter IV: Results and Discussion, part 4.2: System Design for further details.
An application has been developed to complete the functions expected by users. Screenshots and explanations of the application’s functions were described in chapter IV: Results and Discussion, part 4.3: System Implementation.
Lastly, a functionality testing was conducted to evaluate the usability of the application. The result of this testing was summarized in chapter IV: Results and Discussion, part 4.4: Functionality Testing.
48
5.2 Recommendations:
The project has been accomplished and an application was developed to solve the aforementioned problems. For further development, there are some recommendations on this project:
Due to time constraint, only the functionality testing was conducted. In the future, a usability testing should be carried out to exactly evaluate the application’s effectiveness, efficiency and user satisfaction.
The application should support users to perform SQL queries with their own database. One drawback of this application is not supporting the user-defined database. To enhance this application, it should be considered.
There are only specific types of SQL queries are supported in this system. For further development, it should fulfill more users’ requirements of SQL queries types.
49
REFERENCE
[1] Database. (2012). Retrieved July 10, 2012, from Wikipedia:
http://en.wikipedia.org/wiki/Database
[2]ANAND M. MAGAR VINAY S. KANDUL, R. S. (2012). Web-based Query Builder. International
Journal on Computer Science and Engineering , 552-556.
[3]Michele Angelaccio, T. C. (1990). Query by diagram: A fully visual query system . Journal of
Visual Languages & Computing , 255-273.
[4]Peter Sawyer, J. A. (1995). Database systems: challenges and opportunities for graphical HCI.
Interacting with Computers , 273-303.
[5]Francesca Benzi, D. M. (1999). VISIONARY: a Viewpoint-based Visual Language for Querying Relational Databases. Journal of Visual Languages and Computing , 117-145.
[6]Siaw, K. (1998 ). A visual object-relationship query language for user database interaction.
Telematics and Informatics , 103-119.
[7]L. Cinque, S. L. (1991). An expert visual query system. Journal of Visual Languages &
Computing , 101-113.
[8]Ilker, S. (2001). Implementation of Data Flow Query Language.
[9]Zinovy Diskin, U. W. (2008). A Diagrammatic Logic for Object-Oriented Visual Modeling.
Theoretical Computer Science , 19–41.
[10]N. H. Balkir, E. S. (1996). VISUAL A graphical icon-based query language. Cleveland. [11]Sônia Fernandes Silva, T. C. (1999). Graphical Interaction with Historical Databases.
Scientific and Statistical Managment, (pp. 184 - 193).
[12]Codd's Theorem. (2012, July 4). Retrieved October 17, 2012, from Wikipedia:
http://en.wikipedia.org/wiki/Codd%27s_theorem
[13]NARAYANAN, A., & SHAMAN, T. (2002). Iconic SQL: Practical Issues in the Querying of Databases through Structured Iconic Expressions. Journal ofVisualLanguages and Computing , 623-647.
[14](n.d.). Retrieved June 17, 2012, from Active Query Builder: http://www.activequerybuilder.com
50
[15]Hickman, M. (n.d.). How to Use RAD Methodology for a Customer Service System.
Retrieved July 29, 2012, from EHow: http://www.ehow.com/how_7677030_use-methodology-customer-service-system.html
[16]Alan Dennis, B. H. (2005). System Analysis and Design with UML Version 2.0. John Wiley&Son,Inc. .
I APPENDIX A- Interview Plan
Diagrammatic-based query formulator Le Ngoc Ha – BIS – 14153
Final Year Student
University Technology PETRONAS
INTERVIEW PLAN
Introduction of interviewer:
Hello, my name is Le Ngoc Ha. I am currently final year student of Business Information System, University Technology PETRONAS. As a fulfillment for my Bachelor of Business Information System, I need to accomplish a final year report. Thus, I am seeking for your kind cooperation to support my final year project. Generally, my final year project is a web-based application which works with database. As a user, you can select an existing database, and the application will display to you the corresponding diagram. More than that, users are allowed to interaction with the diagrams to extract the requested database. So, I hope you can spend your precious time to help me answer some questions related to this topic.
Main questions Additional questions Clarifying questions
1) Can you tell me what do you know about database? 2) What is your experience in processing with a
database?
3) What techniques do you usually use to retrieve data
Can you explain a little more about it?
II from a database?
4) What types of activities do you usually do with database? For e.g: you select some specific information that serves for your own purpose, or update information. Can you describe your most frequent activities?
5) Are you having difficulties in using the mentioned techniques?
6) Do you know there are applications to help us interact with database? Do you use it?
7) Do you know there is a specific language called SQL to help you interact with database?
8) Have you ever heard about an application which allows users to interact with diagram and then the queries are created automatically based on the user’s interaction?
9) If you request for a diagram, what features you want
If yes, are you able to do all the things you need?
If no, how do you feel if you can compose your own function? If yes, what is your opinion about SQL? Do you face any problems with using SQL?
III to view in this diagram? (e.g: table name. attribute,
relationship, image, icons?)
10) Do you have any concerns regarding to my idea I just presented? Are there any matters with the
diagrammatic-based query formulator idea that you feel worrisome?
11) Do you have any suggestions for my application? (e.g: add any more feature, your expectation for this application)
![Figure 2: VQS Diagram Sample. [5]](https://thumb-us.123doks.com/thumbv2/123dok_us/1370544.2683536/16.918.267.719.397.760/figure-vqs-diagram-sample.webp)
![Figure 3: VORQL User Database Interface. [6]](https://thumb-us.123doks.com/thumbv2/123dok_us/1370544.2683536/17.918.218.771.542.959/figure-vorql-user-database-interface.webp)
![Figure 5: The prototyping-based methodology [16]](https://thumb-us.123doks.com/thumbv2/123dok_us/1370544.2683536/22.918.171.822.388.729/figure-the-prototyping-based-methodology.webp)