Customer Analytics Projects: Addressing Existing Problems with a
Process that Leads to Success
Inna Kolyshkina
Institute of Analytics Professionals of Australia 20, 9-19 Nickson Street Surry Hills NSW 2010
Simeon Simoff
University of Western Sydney NSW 1797, Australia [email protected]
Abstract
This article explicitly outlines an approach designed to allow optimal utilisation of Analytics in the industry setting. The paper focuses on the key stages of the Analytics process that have not been identified in previous Analytics methodologies and draws on industry, consulting and research experience to show that correct design of the project trajectory can allow the industry to fully realise the benefits that Analytics has to offer. As the case studies provided demonstrate, it is often the skipping of key stages, especially the preliminary analysis stage, that are currently responsible for preventing success of an Analytics project. It has been shown how, using the outlined approach, project can achieve maximum effectiveness and business buy-in.
Keywords: Customer Analytics, Industry Analytics, Data Mining Effectiveness, Analytics Projects Management, Analytics Industry Case Studies.
1
Introduction.
The vast amount and complexity of the information we have to deal with on a daily basis is a challenge for contemporary business decision makers. From a business perspective analytics can be defined as a subset of what has come to be called business intelligence—a set of technologies and processes that use information and data to understand and analyze business performance (Davenport and Harris, 2007). .
“In today’s competitive, globalized market where not much more than the making of good decisions separates competitors from each other, analytics is the emerging new business adviser, a guide that utilises the business data to generate guidance regarding making better business decisions.” (Davenport and Harris, 2007). The
Copyright © 2007, Australian Computer Society, Inc. This paper appeared at the 6th Australasian Data Mining Conference (AusDM2007), Gold Coast, Australia, 3-4 December, 2007. Conferences in Research and Practice in Information Technology (CRPIT), Vol. 70. P. Christen, P. J. Kennedy, J. Li, I. Kolyshkina and G. J. Williams, Eds. Reproduction for academic, not-for profit purposes permitted provided this text is included.
science of analytical reasoning provides the reasoning framework upon which strategic and tactical analytics technologies are built.
“At a time when companies in many industries offer similar products and use comparable technology, many of the previous bases for competition are no longer viable. In a global environment, physical location is frequently not a source of advantage, and protectionist regulation is increasingly rare. Proprietary technologies can often be rapidly copied and attempts to achieve breakthrough innovation in products or services often fail. What's left as a basis for competition is execution and smart decision making. An organisational commitment to and developed capability of Analytics is enabling market-leading companies to succeed in the rapidly evolving arena of global competition.” (Davenport and Harris, 2007) The information and data mining software systems facilitate the analytical reasoning process, providing humans with means to deal with the enormous amount of data and information generated in various areas of human endeavour. Since its inception in the late 80s, data and information mining technologies have reached the level of embedded technology, coming as part of modern data management and analysis suites. However, technology is only one of the necessary conditions for achieving competitive advantage. The issue of Analytics not being fully utilised in organisations due to lack of a clearly defined analytics process has been recognised for some time. In the late ‘90’s – early 2000’s a number of methodologies was developed to address this issue. Among them CRISP-DM (Chapman, et al., 2000) is perhaps the best known and broadly used iterative data mining methodology. However such methodologies are focussed primarily on the technical aspects of the data mining process with little attention to the business aspects of the overall Analytics process (Pyle, 2004). For instance, “Business Understanding” is part of CRISP-DM, however, little is provided about how that actually can be done. There is an embedded assumption that the business analysts will somehow communicate with the data miners and in this communication the data mining models will be related to business key performance indicators (KPIs). However, industry leaders have pointed out the existence of a communication gap between data
mining experts and business domain experts (Fayyad, 2004). This gap, together with some related issues, has been explored in Van Rooyen’s (2004) critical evaluation of the project management utility of CRISP-DM and Data Mining Projects Methodology (DMPM) of the SAS Institute, in a business decision-support environment. Recently there have been attempts to improve existing Analytics methodologies and allow them to become more effective and reliable in providing useful insights in business contexts. A notable contribution to the field is Van Rooyen’s (2005) Strategic Analytics Methodology (SAM). In the last few years there has been an improvement in the use of Analytics in business settings. However, it is important to stress that the potential value of Analytics has not been fully realised or utilised in business settings as yet.
This paper presents an Analytics process approach that aims to maximise the value-add of Analytics projects. The process draws on the extensive knowledge and experience gained from industry, consulting, research and education activities in Analytics. The paper focuses specifically on the key process stages that have not been identified or given sufficient attention in previous Analytics methodologies. Further the paper is organised as follows. Section 2 considers the reasons why analytics projects may fail. Section 3 discusses solutions to the problems discussed in Section 2. Section 4 illustrates and reflects on the practical application of the stage model of the Analytics process.
2
Why do Analytics Projects under-deliver?
Analytics is a new area and as such, is currently hindered by two main issues:
- the lack of business acumen and experience on the part of the analysts in business contexts, as well as; - limitations of the awareness of the potential value of Analytics in the business world.
Although, these issues are temporary in nature, they influence the outcomes of Analytics efforts. As a result it is not unusual for an Analytics project to under-deliver. This is widely recognised in the industry. Citing Dragoon (2006), “many segmentation efforts today are an exercise in futility... Organizations often wind up with segments that drain resources, instead of with segments that lead to more effective ways of running the business or meeting customers' needs.” Academic research has also recognised these problems (Van Royeen, 2005).
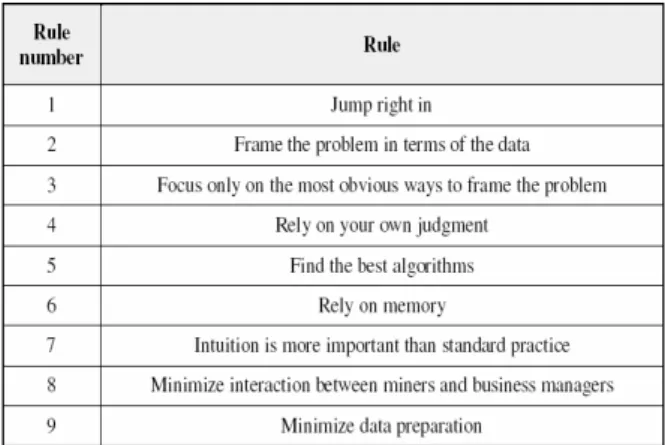
The specific reasons behind the value-add potential of Analytics not being fully realised have been discussed since late ‘90s – early 2000’s. At that time, the reasons suggested by industry experts (Fayyad, 2004) and Pyle (see Figure 1 - Rule 2, 4, 5, 7, 8), were mainly surrounding ineffective communication between analysts and business institutions due to business institutions’ lack of knowledge about Analytics’ capabilities. The reasons also included such factors as analysts’ focussing on the technical solutions instead on the business solutions that are oriented at the impact on the bottom line.
Figure 1: Pyle’s nine rules for Analytics project failure (adapted from (Pyle, 2004))
The need to resolve this problem led to the development of approaches that would ensure the maximum value-add of Analytics. For example, in 1999-2000 two major data mining project methodologies were specifically designed to more effectively help in business settings, these were DataMining Projects Methodology (DMPM) (SAS Institute, 2000), and CRISP-DM (Chapman et al., 2000). However, while these approaches have been adopted by a substantial part of the Analytics community the capacity of Analytics projects has still not been fully realised. That these approaches have not fully covered the important features of an Analytics project is evidenced by the recent move to develop a new version of CRISP-DM methodology (CRISP-DM 2.0).
A detailed discussion and evaluation of the above approaches is presented in (Van Rooyen, 2004). Van Rooyen’s statement that “despite the potential for the output of data mining to support business decision making, data mining practitioners are still finding resistance to the uptake of data mining by the business community” (Van Rooyen, 2004, p. 86.) is confirmed by industry and consulting experience expressed at a number of Analytics conferences and other forums in Australia and internationally.
Part of the answer is in the fact that there are many examples of projects where Analytics has under-delivered. Further, we explore the nature of the factors that have undermined the success of Analytics projects, based on a number of case studies involving Analytics projects from across the industry, ranging from transportation to banking.
2.1
Lack of congruency between business issues
and analytics targets.
A widely recognised reason of Analytics projects’ failure is the lack of congruency between the issues seen as central by the business and the issues actually targeted and addressed by the Analytics projects. The reason behind this may be two-fold:
- It may be due to a lack of clarity of the problem to be addressed on the part of the business, or; - It can also stem from a lack of clarity and
specificity in understanding of the key issues on the part of the analysts.
Currently, this scenario is so common that the existing version of CRISP-DM includes a specifically designed step to allow the abandonment of the project for this very reason (see Van Rooyen, 2004).
A typical example from the industry that clearly characterises the above described issue, is that of a financial institution which had the objective of using Analytics to improve their mortgage customer retention strategy. In terms of the project objectives it was not clearly specified whether the project should be aimed at decreasing current customer churn within a certain period of time, and, if so, what this period of time is (for example within next 12 months), or at refining bank’s acquisition strategy so that customers applying for mortgage are better screened. The nature of the business goal would then require a unique analysis approach, which would lead to different outcomes and different implementations recommendations.
The lack of clear communication and understanding of the business’ main concerns and requirements in this project led to confusion and subsequently the project was delayed. This could have easily been avoided had there been a greater focus early on identification and clarification of project goals. This could have been carried out via a process of thoroughly interviewing the main stakeholders. However, lacking this step, the ill-defined goals fundamentally undermined the project from its inception.
It is important to note that industry and especially consultancy are becoming increasingly more effective in addressing this issue. Consultancies draw on their experience of clearly establishing client needs and providing fitting solutions. Also, industries where Analytics units are practically in the position of internal consultants to the business find that these units more often provide clear lines of communication for the early formulation of specific project objectives that match business requirements.
2.2
Lack of Analytics project management
expertise.
Another major reason for failure of Analytics projects is the lack of Analytics project management expertise, and, in particular, the habit of skipping important early stages in the Analytics project development process. These lead to such issues as the use of unreliable or incomplete data, lack of robustness, overlooking of important drivers of the business issues, and incorrect choice of Analytics tools.
Also, a related issue is project scope creep which sometimes leads to withdrawal of funding and to project termination.
All of these issues result not from the deficiency of Analytics as such, but from improper utilisation of this useful instrument. In other words, Analytics becomes a potentially valuable resource that has not been tapped into correctly. Such outcomes not only hinder organisation’s ability to compete, they unjustifiably undermine the credibility use of Analytics for improving business decision.
We use several case studies to illustrate different aspects of the problem.
2.2.1
Incomplete insights due to oversight of
important specific drivers of the business
issue that the project aimed to address.
A regional airline with separate branches in two states wished to increase its profit by choosing the right staff KPI’s. The Analytics project approach involved gathering the established KPI’s for combined operations, and correlating these with profit. However, the analysis was unsuccessful. The KPI’s selected (such as number of tickets sold) did not sufficiently drive profit. Upon review it was identified that the unclear outcomes of the analyses were due to unaccounted factors such as differences in the nature of the services provided by the two branches and significant environmental changes (emergence of a competitor within the industry and increases in fuel cost). In hindsight it is clear that having a preliminary step in the analysis process would have been fundamentally advantageous for the project. In other words the project was severely limited due to a lack of early clarification of the significant industry specific factors surrounding the data.
2.2.2
Using outdated Analytics techniques
leads to limited insights.
A major private health insurer wanted to address an increase in customer churn and rising numbers of expensive claims. More specifically, the company needed a way to identify potentially expensive claims to allow more efficient management and early intervention. Analytics was used to achieve these goals in the following way. Domain experts’ opinions were sought and used to identify the 5-6 factors which may influence churn. Cross tabulations and logistic regression modelling was used to see which customers are most at risk of churning based on the identified factors. Age was used as the main predictor of claim cost. Domain expertise was utilised to determine what other 5-6 factors may influence claim cost. Cross-tabulations were used to quantify the influence.
Upon completion of the analysis it was found that the project was not successful since the factors chosen for the analysis explained less than 40% of the claim cost and churn. Once again this is suggestive of a lack of early Analytics-business dialogue regarding the necessary steps to identify the significant factors impacting on the business outcome of interest.
2.2.3
Lack
of
proper
data
quality
assessment and preliminary analysis
gives misleading conclusions.
In the case of an insurance company, a model aiming to predict the probability of a workplace claim suggested the claimant’s salary to be the best predictor of that. This suggested that those who are paid more, were more likely to claim, which was a counter-intuitive result, not consistent with the domain expertise. Further data
investigation showed that the “claimant’ salary” field was filled out only after the claim occurred, otherwise the value was missing, and was read in as “0” by the data extracting tool. In other words, the fact of claim drove the fact of “claimant’ salary” field having value greater than 0, rather than salary value drove the probability of a claim.
2.2.4
Inappropriate choice of software
tool leads to productivity decrease
and poor staff morale.
A communications company was overwhelmed by number of cases of potential fraud to investigate. An Analytics model was designed externally and implemented in order to evaluate likelihood of fraud. The rationale was to screen potential fraudulent cases, and allow the fraud investigators to focus on those that are most likely to be fraudulent. However, the model merely provided the investigators with a numerical score. The users of the model were not given information of how and from what data the scores were generated by the model. Eventually, the investigators ended up ignoring the outputs provided by the model as they felt that top-scores were often not indicative of greater likelihood of fraudulent cases. They disregarded the output and retreated back to relying more on their own “hunches” than on fraud model output. As such the implementation of the model hindered, rather than improved team productivity and morale.
2.2.5
Non-implementable
insights
of
analysis
A major communication company wanted to predict customer churn by analysis of recent 2 months’ data on customer behaviour. The solution built predicted whether or not a customer left the company on the third month. The model achieved good technical results in terms of accuracy and robustness, however could not be implemented as after it was established that a customer was likely to leave next month, there was no time period when organisation could intervene in order to retain the customer.
2.2.6
Lack of stakeholders’ buy-in on the
implementing of analysis results.
Sometimes insights implementation does not happen due to the difficulty of the interpretation of the insights (for example, model scores without explanation of the practical meaning behind the figures), high implementation cost or lack of fit with the organisational strategy. Such issues can be prevented by constant communication, providing documentation, which interprets the analytics output in a clear, easy to understand form, and analyst’s understanding of organisational strategy and implementation cost.
2.2.7
Lack of monitoring and updating
processes.
Monitoring and updating is important as due to changes in economic environment, political situation and other
factors, analytics results become after a while out of date. There has to be a documented time frame for model review agreed with the business. This stage seems obvious, but often is not in place. For example, a mortgage retention model in a major bank had not been updated in 3 years which led to poor results in marketing campaigns based on the model in the third year of model deployment and as a result, affected trust between business and analytics units in the bank. Van Rooyen formulated this problem as “concept drift” in a broader way than it is formulated in machine learning and addressed it in (Van Rooyen, 2005).
3
How to Maximise Analytics Project Success.
In this section we present some solutions to the problems discussed in Section 2. We start with focusing on what needs to be put in place in an organisation to enable it to obtain maximum benefits from Analytics projects.
3.1
Enabling organisational awareness
3.1.1
Providing awareness at all levels of
management about the capabilities
of Analytics
A crucial point is the provision of awareness at all levels of management within the organisation of what Analytics can do for them. As Davenport and Harris (2007) note, “organizations that want to be competitive must have some attribute at which they are better than anyone else in their industry—a distinctive capability.” To achieve this, a critical factor is the awareness at all levels of the organisation that Analytics can add value to the business. Ideally, Analytics should be a trusted advisor to the business.
The necessary requirements for that to occur are:
• an awareness of all stakeholders at the senior and middle management level of what Analytics have to offer;
• the development of a blend of Analytics and business skills and knowledge within the organisation;
• development of effective project management approaches specially suited for Analytics projects. The development of a blend of Analytics and business skills and knowledge combined with knowledge and skills in project management approaches specially suited for Analytics projects should be an essential component in University analytics degrees.
3.1.2
Providing organisational awareness
at all levels about the keys to
successful utilisation of Data
To achieve Analytics success, organisation should ensure Availability, Quality and Accessibility of data, as well as developed data understanding.
3.2
Enabling knowledge and skills in Analytics
3.2.1
Updating Knowledge and Skills in
Analytic Techniques
The existing communication gap between analysts and business can be effectively reduced by encouraging development of analysts’ business acumen and related skills. Every year new, more effective Analytics techniques and tools are being developed. Industry analysts should constantly build awareness of:
- industry trends;
- approaches that have proven to be successful, and;
- new techniques and knowledge regarding skilful implementation of these techniques in analytics projects.
3.2.2
Updating Knowledge and Skills in
Analytic Software Tools.
Analytics software space is very dynamic, with new exciting players entering the market. In fact sometimes the degree of benefit from new software is surprising. For example, large organisations such as ATO get good value from using Open Source software in specialised projects as well as getting good return out of high-end multifunctional Analytics software. The lesson is: remain informed of new offerings at the Analytics software market to ensure that you get the right software for the job. Organisations would benefit by ensuring that analysts are given time to do these steps periodically.
3.3
Enabling the Analytics process
However, even if all of the necessary elements described in sections 3.1 and 3.2 are in place, the organisation needs a clear framework of the process that the Analytics project goes through. This is a key component to ensure that future Customer Analytics projects work.
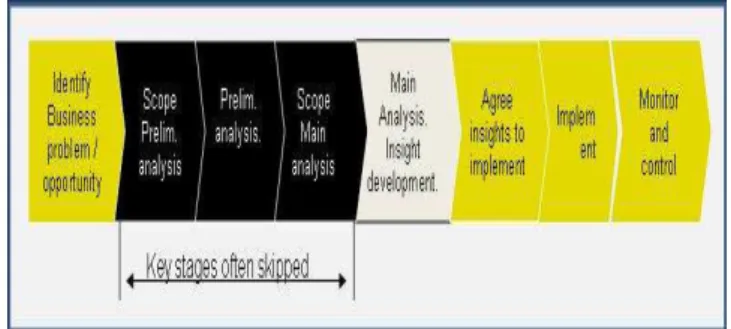
Figure 3 shows the steps in the process model of an Analytics project. While all steps in the model are crucial for the success of the Analytics project, most issues with Analytics projects currently arise due to the skipping of stages linked to the preliminary analysis. These stages involve thorough scoping and the discovery/resolution of any hidden issues and factors which may impact upon the trajectory or the quality of the main stage of analysis. The Preliminary Analysis step should precede the scoping stage of the main analysis phase, which will be driven and guided by the discoveries made during preliminary analysis.
3.3.1
Is the preliminary analysis stage
really necessary?
The preliminary analysis stage is essential in order to be able to scope the main analysis stage. Data can hide surprises and this stage allows uncovering and screening any hidden factors so that the main analysis stage is scoped correctly. The mentality is to prevent rather than
treat. For example, often stakeholders may try to influence the project by suggesting the technical approach that they tried in the past, but which might be inappropriate in the current project. In such cases the preliminary analysis’ stage’s results will provide the analyst with the information necessary to make informed, evidence-based decisions regarding the best Analytics techniques to apply and software to use. Clearly, if this is not addressed, main stage of analysis is likely to be compromised. For example, a lack of clarity in early project planning may easily lead to an inappropriate choice of analysis technique, and often it can result in using “tried and proven” but outdated Analytics techniques such as correlation analysis, cross-tabulations or linear regression. In such cases such a decision can impact the time frame and cost of the project due to decrease in productivity as well as hinder the quality of insights and the decisions based upon them. This can be prevented if Preliminary Analysis results are documented and explained to the business stakeholders.
Figure 3: Stage model of the Analytics project process.
3.3.2
Deliverables of Preliminary Analysis
To ensure maximum effectiveness, the deliverables of Preliminary Analysis should be as follows:
• Extracted preliminary data
• Documented basic data summaries and descriptions
• Confirmed data definitions
• Availability of the data fields required to achieve the project goals
• Documented identified data issues and recommendations how to deal with them
• Recommendations on the additional data (internal or external such as Mosaic scores) that may be required to achieve the project goals
• Documented insights to help shape the main stage of analysis such as recommendations on
• the most important data fields to use
• presence of homogeneous groups that should be analysed separately as well as any outlier groups
• Analytics techniques and methods to use
• software
• Documented insights/hypotheses/unexpected results that may need to be considered at the Main Analysis stage.
3.3.3
Relating results to business
The step “Discuss results with business. Agree insights to implement.” (shown in light grey background in Figure 3) is another key stage that sometimes is not fully emphasised. Unless the stakeholders’ buy-in is achieved and the business understands the insights, agrees with them, is happy to implement them and has a clear view on how to implement, there is a risk of the project insights not being correctly implemented or not being implemented at all. In case that occurs, it obviously would prevent the project of adding value and affect the level of credibility and trust between Analytics and business.
The remaining key steps were described adequately by methodologies such as Crisp-DM. “Monitor and Control” step and its importance has been discussed and described in detail in (Van Rooyen, 2005).
4
Implementing the stage model of the
Analytics process
In this section we illustrate and reflect on the practical application of the stage model of the Analytics process, presented in Figure 3 in order to resolve some of the issues presented in Section 2.
4.1
Using Preliminary Analysis Stage to
address the issues with Airline Customer
Analytics
In the case of the two-branch regional airline customer discussed in section 2.2.1, the preliminary analysis showed that all KPI’s were strongly correlated with each other. This discovery meant lack of validity of recommendations made by the previous analysis. It also established some discrepancies which pointed at lack of data necessary for correct insight development. The behaviour of the two branches to see if they can be combined or they behave differently, on the basis of this it was decided that the regions needed to be analysed separately.
Based on the results of preliminary analysis, a project plan was developed such that the analysis included relevant data such as, fuel competitor activities, cost and service charges. The use of a team of business domain experts and Analytics experts to interpret the Analytics results and selected the KPI’s that were strongly linked to sustainable increased profits. The project was a success as it delivered insights into what drives profit in each operation, and how structural change will complement the incentive program.
4.2
Using Preliminary Analysis Stage to
address the issues with Health Insurance
Analytics
When addressing the problem described in section 2.2.2 in the case of Analytics for Health Insurance, the preliminary analysis showed that different age groups have different churn and claim cost drivers. For example, customers aged over 60 were more likely to churn if they pay their premiums by physically attending branch. Additionally, the preliminary analysis allowed to do quick exhaustive search on 300 available data fields and identified all fields that were predictive of churn (about 25) and all fields that were predictive of claim cost (about 20). This increased dramatically the accuracy of results and built credibility with the business. In the main analysis stage, valuable and practical insights relating customer behaviour to claim cost were delivered. For example, the customers who had larger number of physiotherapy services were more likely to have a hospital claim. Overall, the project helped to identify strategies to retain high-value customers in risk of churning and helped the business forecast the expected increases in profit.
4.3
Expanding
the
range
of
Analytics
techniques to address the issues with the
customer
retention
in
a
Telecommunications Company.
The conservative part of the business community, in particular, in the industry as opposed to consulting, tends to be cautious of innovative sophisticated Analytics techniques. It is felt that it can hinder the buy-in of the stakeholders and adversely impact the project success. In this section we demonstrate the importance of the selection of the appropriate analytics technique during the Preliminary Analysis. Such selection may require “thinking out of the box” on the part of the analyst. In this example, the change was in the shift to another data source – unstructured and semi-structured text data and the implementation of recently developed text mining techniques and tools.
A major telecommunications company had many customers churning after 3 months. Insight was needed into which customers were at risk of leaving, why they were leaving, and which customers needed to be retained.
Text mining was implemented to inbound call centre records of the conversations between customers and staff. The analysis uncovered early warning signs of customer churn, allowing the development of strategies to “save” customers before they had committed to leaving the company. Furthermore, the project allowed the building profiles of the different segments of at-risk customers, showing their needs, motivations and their value to the company.
The insights from textual data provided the company with improved accuracy of churn prediction by 12%. The company was thus able to prioritise its retention resources on profitable, risky customers first, to deliver maximum return on investment.
5
Conclusions
Analytics is the tool that has the proven potential to give valuable insights into ways of helping organisations to address improving revenue growth, customer retention and other such fundamental goals. It has the value bringing into light key hidden factors holding a business back from achieving its full potential, and as such allow skilful ways of approaching overcoming the restraints posed by these factors. Foregoing such an advantage is the cost of not utilising the strength of Analytics as part of the company’s competitive artillery.
Among the necessary conditions for the success of Analytics projects in an organisation are proper data quality and availability, the right choice of analytics software and organisation’s awareness of analytics’ potential.
However, even if such foundation is in place, the effectiveness of Analytics is dependent upon whether a correct methodological approach is followed. This article explicitly outlines an approach designed to allow optimal utilisation of Analytics in the business context. As the case studies provided in this article demonstrate, it is often the skipping of stages, especially the preliminary analysis stage that are currently responsible for preventing success of an Analytics project. It has been shown that in practice these stages, which involve primarily effective planning as well as constant business-analyst dialogue, are absolutely crucial for the project effectiveness. Thus, paying careful attention to early design of the project trajectory can allow businesses from across the industry to fully realise the benefits that Analytics has to offer.
6
References
Chapman, P., J. Clinton, et al. (2000). CRISP-DM 1.0: Cross Industry Standard Process for Data Mining, CRISP-DM Consortium.
Chatfield, C. S. and T. D. Johnson (2000). Step by Step Microsoft Project 2000. Redmond, Washington, Microsoft Press.
Davenport, T. H. and Harris J. G. (2007) Competing on Analytics. The New Science of Winning. Harvard Business School press. Boston, Masssachusetts
Dragoon, A. (2006). How to do customer segmentation right. CIO Magazine, 8 March 2006, Accessed August 10, 2007
Fayyad, U. (2004). "Editorial." SIKDD Explorations 5 (2).
Ganti, V., J. Gehrke, et al. (1999). "Mining Very Large Databases." IEEE Computer 32(38): 6875.
Han, J. and M. Kamber (2001). Data Mining: Concepts and Techniques. San Francisco, Morgan Kaufmann Publishers.
Hastie, T., R. Tibshirani, et al. (2001). The Elements of Statistical Learning. New York, Heidelberg, Berlin, Springer-Verlag.
Klinkerberg, R. and T. Joachims (2000). Detecting Concept Drift with Support Vector Machines. In Proceedings of the Seventeenth International Conference on Machine Learning, San Francisco, Morgan Kaufmann. Pearce, I. J. A. and J. R. B. Robinson (1991). Strategic Management: Formulation, Implementation, and Control. Boston, Irwin.
Pyle, D. (1999). Data Preparation for Data Mining. San Francisco, Morgan Kaufmann Publishers.
Pyle, D. (2004). This Way Failure Lies. DB2 Magazine. 2004.
SAS Institute (2000). Data Mining Projects Methodology. Cary, NC, SAS Institute Inc.: 133.
Van Rooyen, M. (2004). An evaluation of the utility of two data mining project methodologies. In Simoff, S. J. and Williams, G. (eds), Proceedings of the 3rd Australasian Data Mining Conference, 6-7th December, 2004, Cairns, Australia, pp. 85-94.
Van Rooyen, M. (2005). Strategic Analytics Methodology. Master of Science Thesis, Faculty of Information Technology, University of Technology, Sydney.
Zikmund, W. G. (2003). Business Research Methods. Various, Thomson South-Western.