저작자표시-비영리-변경금지 2.0 대한민국 이용자는 아래의 조건을 따르는 경우에 한하여 자유롭게 l 이 저작물을 복제, 배포, 전송, 전시, 공연 및 방송할 수 있습니다. 다음과 같은 조건을 따라야 합니다: l 귀하는, 이 저작물의 재이용이나 배포의 경우, 이 저작물에 적용된 이용허락조건 을 명확하게 나타내어야 합니다. l 저작권자로부터 별도의 허가를 받으면 이러한 조건들은 적용되지 않습니다. 저작권법에 따른 이용자의 권리는 위의 내용에 의하여 영향을 받지 않습니다. 이것은 이용허락규약(Legal Code)을 이해하기 쉽게 요약한 것입니다. Disclaimer 저작자표시. 귀하는 원저작자를 표시하여야 합니다. 비영리. 귀하는 이 저작물을 영리 목적으로 이용할 수 없습니다. 변경금지. 귀하는 이 저작물을 개작, 변형 또는 가공할 수 없습니다.
Master's Thesis
A Reference Model for Big Data Analysis
in Shipbuilding Industry
Yonghyeok Lee
Department of Management Engineering
Graduate School of UNIST
2017
A Reference Model for Big Data Analysis
in Shipbuilding Industry
Yonghyeok Lee
Department of Management Engineering
A Reference Model for Big Data Analysis
in Shipbuilding Industry
A thesis/dissertation
submitted to the Graduate School of UNIST
in partial fulfillment of the
requirements for the degree of
Master of Science
Yonghyeok Lee
01. 06. 2017
Approved by
_________________________
Advisor
Changyong Lee
A Reference Model for Big Data Analysis
in Shipbuilding Industry
Yonghyeok Lee
This certifies that the thesis/dissertation of Yonghyeok Lee is
approved.
01.06.2017
Signature
___________________________
Advisor: Changyong Lee
Signature
___________________________
Minseok Song
Signature
___________________________
Marco Comuzzi
5
ABSTRACT
Global shipbuilding industry has gone through a tough time due to the reduction of shipping order quantities and shipbuilding tonnages since the global financial crisis of 2008. To overcome the challenges, big data analysis is expected to be an effective solution to increase the practical efficiency in the shipbuilding industry. After an organization applies big data analysis, benefits, such as better aimed marketing, more straightforward straight-forward business insights, client based segmentation, and recognition of sales and market chances, are anticipated. In the future, the key for competitiveness is finding an appropriate way of applying big data analysis. Although numerous studies for big data analysis are conducted, the studies tend to focus on the technical aspect of analyzing data including method, algorithm, and architecture. Therefore, it is required to study how to applying the analysis technique in the practice, specifically shipbuilding industry in this study. In this thesis, the reference model for big data analysis in shipbuilding industry is developed. The proposed reference model provides the big data analysis guideline according to four phases such as contract, design, production, and service. They are categorized based on value chain of shipbuilding industry. Each phase consists of three levels of big data analysis, e.g., category of analysis, analysis method, and detailed algorithm. Moreover, the importance of the analysis method is determined in order to increase the applicability of the reference model. To verify the validation of the model, experts of the shipbuilding industry consulted the model it is consulted by the experts of the shipbuilding industry.
7
Contents
I. Introduction ... 11
1.1.Research Background ... 11
1.2.Research Method ... 13
II. Related Works ... 15
2.1.Big Data Analysis in Manufacturing Industry ... 15
2.2.Big Data Analysis in Shipbuilding Industry ... 16
2.3.Reference Model ... 17
III. Value Chain in Shipbuilding Industry ... 18
IV. Development of A Reference Model for Big Data Analysis in Shipbuilding Industry ... 21
4.1.Overview ... 21
4.2.Data Analysis in Contract Phase ... 23
4.2.1. Contract Phase ... 23
4.2.2. Data Analysis Description ... 23
4.3.Data Analysis in Design Phase ... 28
4.3.1. Design Phase ... 28
4.3.2. Data Analysis Description ... 28
4.4.Data Analysis in Production Phase ... 38
4.4.1. Production Phase ... 38
4.4.2. Data Analysis Description ... 39
4.5.Data Analysis in Service Phase ... 60
4.5.1. Service Phase ... 60
8 V. Evaluation ... 68 5.1.Interview ... 68 5.2.Results ... 68 VI. Discussion ... 72 VII.Conclusion ... 74
9
List of Figures
Figure 1. Research Method ... 14
Figure 2. Vale Chain of Shipbuilding Industry ... 18
Figure 3. Overview of A Reference Model ... 21
Figure 4. Layers of A Reference Model ... 22
Figure 5. Analysis Composition in Contract Phase ... 24
Figure 6. Analysis Composition in Design Phase ... 29
Figure 7. Analysis Composition in Production Phase ... 40
Figure 8. Analysis Composition of Service Phase ... 61
10
List of Tables
Table 1. Description of Analysis Method for Contract Phase ... 27
Table 2. Description of Analysis Method for Design Phase ... 36
Table 3. Description of Analysis Method for Production Phase (1) ... 46
Table 4. Description of Analysis Method for Production Phase (2) ... 53
Table 5. Description of Analysis Method for Production Phase (3) ... 58
Table 6. Description of Analysis Method for Service Phase ... 67
11
I.
Introduction
1.1.
Research Background
The global shipbuilding industry has gone through a tough time due to the reduction of ship order quantities and shipbuilding tonnages since the global financial crisis of 2008. The current economical context is pushing companies to produce the product with less cost and better quality (Aramja, Kamach, & Chafik, 2015). In addition, the companies are required to do it faster and most of all in a cost effective manner. Furthermore, three major Korean shipbuilders recorded the substantial amount of loss, over seven trillion won for the third quarter in 2015, even though Korea is one of the top countries in the shipbuilding industry. Due to globalization, new competitors bring new tools and approaches to the market (Younus, Hu, Yong, & Yuqing, 2009). Although China’s shipbuilding industry has emerged lately as the new competitor in the market, it has experienced rapid growth with effective cost advantage. Most orders in the market were placed for bulk carriers and tankers sectors in which China has competitiveness on a global scale (Jiang, Bastiansen, & Strandenes, 2013). Now facing increasingly fierce competition and hostile environments, it is crucial for shipbuilders to find the next-generation growth of opportunities and make innovations in internal and external environments as one of the solutions, the big data analysis is promising.
The big data analysis is a data analysis based on big data. The data analysis is responsible for finding the hidden patterns, rules, and information from the data. Most researchers in this field use the term to describe how they refine the “ground” (i.e., raw data) into the “gold nugget” (i.e., information or knowledge) (Tsai, Lai, Chao, & Vasilakos, 2015). Big data refers to the explosion of available information. It is driven by the massive amounts of very high-dimensional or unstructured data, which are continuously being produced and stored with much cheaper cost than they used to be (Fan, Han, & Liu, 2014). These data are generated from online transactions, emails, videos, audios, images, click streams, logs, posts, search queries, health records, social networking interactions, science data, sensors, and mobile phones and their applications (Sagiroglu & Sinanc, 2013). The analysis of big data mainly involves analytical methods for traditional data and big data, analytical architecture for big data, and software used for mining and analysis of big data (M. Chen, Mao, Zhang, & Leung, 2014). After an organization applies some form of big data analysis, benefits, such as better aim marketing, more straightforward business insights, client based segmentation, and recognition of sales and market chances, can be anticipated. Specifically, the potential of big data analysis in the manufacturing industry is evaluated to make a positive impact, such as improved demand forecasting, supply chain planning,
12
sales support, developed production operations, and web search based applications (M. Chen et al., 2014; Manyika et al., 2011).
The existing studies of the big data analysis focused on the way of analyzing big data such as method, algorithm, and architecture. M. Chen et al. (2014) introduced the methods, architectures and tools for the big data analysis. In addition, Gandomi and Haider (2015) studied the analytic methods used for big data. Especially, the analytics related to unstructured data are described into various areas of text analytics, audio analytics, video analytics, and social media analytics. Zhang, Liu, Wang, and Gruen (2007) described the steps for planning the statistical analysis involving genome-wide data. H. Chen, Chiang, and Storey (2012) illustrated the application, data, analytics, and impacts of data analysis in domains such as science and technology, smart health and wellbeing, security and public safety, and others. The types of technology for analysis are introduced like RDBMS, data warehousing, data mining, and others. Moreover, the processing of big data for analysis was studied. Sandryhaila and Moura (2014) proposed the framework to cope with large-scale data for the analysis based on the discrete signal processing (DSP). Even though the techniques for big data analysis are important, there are only a few studies providing practical guidelines on how to apply analysis techniques in specific industries. The target areas for the analysis, which were studied in the literature, are broad like the whole industry and the effect of the analysis was conceptually described. Although the organization wants to analyze the data with the purpose of extracting useful values and providing suggestions or decisions, there is a problem on analyzing the data because they do not understand what value can be drawn by analyzing the data and how to apply it. The various potential values of different levels can be generated through the analysis of datasets depending on the applied areas in the industry. Therefore, it is required to provide a practical guideline for big data analysis specific to each industry, in this case, the shipbuilding industry.
This thesis proposes a reference model for big data analysis in the shipbuilding industry. The reference model is developed based on the value chain of shipbuilding industry. The value chain offers the overview of the area that big data analysis is applied to create the value. It is necessary to develop the reference model that considers the characteristics of the industry to offer the effective guidance. It provides the big data analysis guideline according to four phases, such as contract, design, production, and service. They are categorized according to the value chain of the shipbuilding industry. Each phase consists of three levels of data analysis, i.e., category of analysis, analysis method, and detailed algorithms. The level of guidance needs to be concrete and detailed for industry personnel to properly understand and utilize the big data analysis results. At the level of analysis method, the concrete guidance will be provided, such as data, detailed algorithms, and analysis result.
13
This paper is organized as follows. Section 2 starts with discussing related works. Then, Section 3 describes the value chain of the shipbuilding industry. Section 4 introduces the reference model developed in this study. The analysis methods by each phase will be explained. Section 5 presents the result of the interview with domain experts, which is used to validate the reference model. Section 6 has a discussion and Section 7 concludes the thesis.
1.2.
Research Method
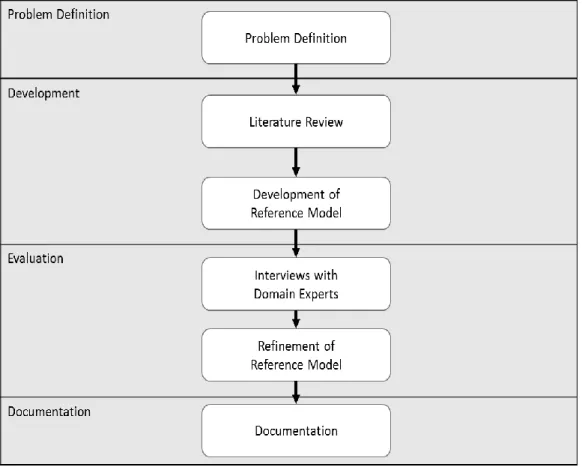
The reference model development discussed in this article was realized within a four-phase research method in Figure 1 derived from the method for reference model development (Ahlemann, 2009; Schütte, 1998). The research method is comprised of:
(1) Problem Definition. The research objective was defined and the problem domain specified as documented in the first section of this paper.
(2) Development. The second phase consists of two different activities:
(2a) Literature Review. Research conducted by other authors and organizations involving the shipbuilding industry, for example, data analysis in shipbuilding industry and the methods of applying big data analysis was also taken into consideration.
(2b) Development of A Reference Model. The initial development of a reference model was based on the knowledge obtained from the literature review.
(3) Evaluation. The objective of this phase was to validate, refine, and stabilize the initial reference model development.
(3a) Interviews with Domain Experts. The interview was conducted with experts in the shipbuilding industry with the objective of gathering further empirical evidence for the reference model in order to validate it. Possible improvements were discussed during the interview. The reference model would then be refined or redesigned if the interview results indicated that this was necessary. It was then concluded that the domain experts had reached a consensus on the reference model’s propositions. (3b) Refinement of a Reference Model. The experience gained from the interview was also used to refine the reference model.
(4) Documentation. The documentation of the reference model contains a description of the research method, the finalized reference model, and the interview results for empirical evidence.
14
15
II.
Related Works
2.1.
Big Data Analysis in Manufacturing Industries
Nowadays data is collected from all aspects in business, but the large volume of data would be of little use if it has not been effectively analyzed so that insightful information can be extracted and applied in the decision-making and business processes. Davenport (2006) argued that it is vital for business to compete on analytics, which means "the extensive use of data, statistical and quantitative analysis, explanatory and predictive models, and fact-based management to drive decisions and actions". In addition, big data analysis can be regarded as a sub-process in the overall process of insight extraction from big data and used as competitive differentiator to the company (Gandomi & Haider, 2015; LaValle, Hopkins, Lesser, Shockley, & Kruschwitz, 2010). There are four main goals of big data analysis: (1) to develop effective methods that can accurately predict the future observations; (2) to gain insight in to the relationship between the features and response for scientific purposes; (3) to explore the hidden structures of each subpopulation of the data, which is traditionally not feasible and might even be treated as ‘outliers’ when the sample size is small; (4) to extract important common features across many subpopulations even when there are large individual variations (Fan et al., 2014; Fan & Lv, 2008).
Big data refers to the data that is unable to be handled and processed by most current information systems or methods due to the explosion of available information (Fisher, DeLine, Czerwinski, & Drucker, 2012). In addition, Laney (2001) presented a well-known definition (also called 3Vs) to explain what is the “big” data: volume, velocity, and variety. These data are generated from online transactions, emails, videos, audios, images, click streams, logs, posts, search queries, health records, social networking interactions, science data, sensors and mobile phones and their applications (Sagiroglu & Sinanc, 2013).
Manufacturers have tremendous potential to generate value from the use of large datasets, integrating data across the extended enterprise and applying advanced analytical techniques to raise their productivity both by increasing efficiency and improving the quality of their products (Manyika et al., 2011). Big data analysis is applied in the manufacturing industry based on the value chain. The value chain provides an overview of the business area for the company or the industry. Manyika et al. (2011) describes the expected effect of big data with the value chain of manufacturing industry. The value chain is composed of research and development, supply chain management, production, marketing and sales, and after sales service. Sowar and Gromley (2011) proposed the analysis in the
16
steel industry. They mentioned that the value chain is the important in that it is the starting point for finding the advantage of the initial data analysis. Additionally, Patil and Giffi (2015) suggested the applicable analysis based on the value chain in the automotive industry. The analytics were described on each value chain and the cross value chain. However, the level of description for the analysis is not in detail and only enumerates the possible analytics. Therefore, the value chain based approach is used in the thesis to develop the reference model for the data analysis. The analysis will be explained specifically.
2.2.
Big Data Analysis in Shipbuilding Industry
Big data links ships, ports, ship inspection institutions, repair dockyards, and equipment suppliers, so it is expected to strengthen the competitiveness in the shipbuilding industry and coexistence between small, medium, and large-sized companies. Recently, with the intention of remote ship monitoring for better services for shipping customers, shipbuilders started to adopt new sensor technology by installing different sensors for different components on board and transmit data using satellite communications to land-based service centers, e.g., Health Monitoring System (HEMOS) by Rolls Royce Marine (Hao et al., 2015). After a while, builder companies realized that the collected sensor data could also help improve ships’ maintenance and future design. In addition, from the aspect of regulators, big data analysis on sensor enabled operation data can improve energy efficiency and environmental performance, safety verification and assessment, the monitoring of accidents and environment risks, and help regulators introduce more quantified regulations for the administration of ships and seas.
As importance of the big data analysis increase in the shipbuilding industry is, a few studies for using big data analysis in shipbuilding industry were conducted. In the maritime domain, H. Hwang, Kim, Shin, Song, and Nam (2016) defined the big data as the meaningful information generated by the navigation and communication equipment from the many ships on the ocean. Plus, they developed a vessel traffic display and statistic system based on AIS messages from the many vessels of maritime. Seunghee Oh and Lee (2015) proposed accident prediction mechanism using maritime big data, which comes from vessel traffic control system. However, these studies limited the sources of data and certain problems. There are more data that can be utilized. Big data analysis is necessary in shipbuilding industry in that it has a lot of opportunities. Furthermore, there is no practical guideline on how to apply data analysis technique in shipbuilding industry. The reference model should include overall big data analyses and provide the guidance for the analysis in shipbuilding industry.
17
2.3.
Reference Model
There is no mutual understanding of the term ‘‘reference model” (Fettke & Loos, 2004). Generally, one can distinguish between approaches that regard models as direct representations of reality and approaches that follow a constructive paradigm. The latter regard a model as a development of one or various modelers. In accordance with this, a reference model is defined as an ‘‘information model used for supporting the development of other models” (Thomas, 2006). The use of reference models is frequently based on the expectation that they can
accelerate the development of information systems (a time aspect),
reduce the associated costs (a cost aspect),
help to communicate innovative ideas and best practices (a quality aspect), and
reduce the risk of failure (a risk aspect) (Ahlemann, 2009).
Although widely accepted in business informatics, the term reference model is not always applied. The terms ‘‘standard model,” ‘‘framework” or ‘‘architecture” are frequently used as synonyms. However, the term, reference model, is used to share the information, not for the development of other models in this thesis. The reference model in the study is expected to accelerate the application of big data analysis, to reduce the associated costs, to help to communicate the ideas for applying the data analysis, and reduce the trial and error for the data analysis.
18
III.
Value Chain of Shipbuilding Industry
The shipbuilding value chain in Figure 2 is comprised of four major phases, i.e., contract, design, production, and service. The value chain is reorganized from the shipbuilding process of Korea Shipbuilding Industry Cooperative (KBIZ, 2012). The contract phase includes the phases of sales activities and marketing. The design phase includes the phase of design and project management. The production phase includes the activities required to build the ship such as assembly, marking, cutting, and others. Finally, the service phase includes maintenance, repair, technical training, and customer support. Comparing to other phases related to traditional values of shipbuilding, the service phase is expected as a new business model using huge amount of data accumulated for several decades.
Figure 2. Vale Chain of Shipbuilding Industry
Each component of the value chain is described as following:
Estimation. In order to obtain an order, shipbuilding company proposes the cost for the contract. Specification and cost of a ship are determined generally depending on requirements from ship-owners or clients.
Signing of contract. After discussions about specifications and cost of the ship, ship-owners and the shipbuilding company makes contracts for shipbuilding.
Design. Design process consists of four stages: initial design, basic design, detail design and production design. Initial design is a process for setting a concept of the ship and specification of vital materials. Basic design is a process for determining detailed specifications of the ship and making
19
drawings. Detail design is a process for verification of results from basic design and making drawings for fabrication stage. Production design is a process for making drawings of each part of the ship and setting process of forming and assembling.
Warehousing of structural steel. After purchasing structural steels from steel mill companies, the shipbuilding company stacks structural steels in a stockyard. The company cares about the method to take out necessary steels on each day and try to prevent the damage of steel during the storage.
Pre-treatment. Before steel cutting process, several preliminary processes are conducted to structural steels. For example, ‘shot blasting’ is a process to eliminate mill scales and debris on surfaces of structural steels by hitting surfaces with small iron beads or sand. ‘Primer painting’ is a process for painting steels before processes of forming and assembling to prevent rusting.
Structural steel forming process. For making components of blocks before assembly process, several work processes are done to structural steels. Although the forming process is composed of marking, cutting, and bending, each process has distinguishing properties compared to a structural steel assembly process.
Marking. Signs for work on the next stages are marked on steels. These signs are for gas cutting, bending forming and assembling.
Cutting. For making parts of components, structural steels are cut as drawings of blocks. As methods of cutting, there are gas cutting, plasma cutting, laser cutting and edge milling.
Bending. For making curved plates of blocks, structural steels are bent. As methods of bending, there are two categories: cold working and hot working. Cold working processes (Bending roller, Die-less forming, Universal Press) are for making steels as developable surfaces. Hot working processes (Line heating) are for making steels as undevelopable surfaces.
Structural steel assembly process. After making parts of components, parts are assembled as small components and blocks through assembly processes. Structural steel assembly process is composed of sub-assembly, unit-assembly, and grand-assembly. In a stage of Sub-assembly, small components composing of blocks are assembled. Due to these components are small and have light-weights, sub-assembly processes can be automated with a conveyor system. In the stage of Unit assembly and Grand assembly, small components and parts become blocks. Difference between unit assembly and grand assembly is the size of assembled blocks. Blocks assembled at grand assembly process are bigger than those from unit assembly process. Some blocks assembled at unit assembly process make up the blocks at grand assembly process, and others become the blocks of the ship directly.
20
Pre-erection. Before erection (assembly of blocks) in the dock, some blocks are assembled in pre-erection yard (between grand assembly shops and the dock).
Pre-outfitting. Before doing outfitting processes at the quay, some outfitting processes are done during pre-erection processes. Pre-outfitting processes reduce man-hours for outfitting processes and prevent reworks of following processes, especially painting processes.
Erection. Blocks from unit assembly, grand assembly and after pre-erection are assembled in the dock.
Painting. For preventing rusting, damages from waves and wind and sticking of seaweeds, painting processes are done to the ship. Painting processes are done during forming and assembly processes as well as erection processes.
Launching. If the ship (or the part of ship) is estimated to have enough buoyancy, the ship is transferred to the water. There are two kinds of launching processes: partial ship launching and full ship launching.
Outfitting at quay. Outfitting and finishing works like correction of deformations are done at quay after launching.
Commissioning. After finishing all production processes and before shipbuilding company delivers the ship to the owner, the ship is sailed on the sea and gets tested whether the ship satisfies the specifications like strength, velocities at specific drafts and stability as designed.
Naming. After finishing all production processes, the ceremony for naming the ship is hosted. Delivery. Completed ship is sailed off to the owner.
21
IV.
Development of A Reference Model for Big Data Analysis in
Shipbuilding Industry
4.1.
Overview
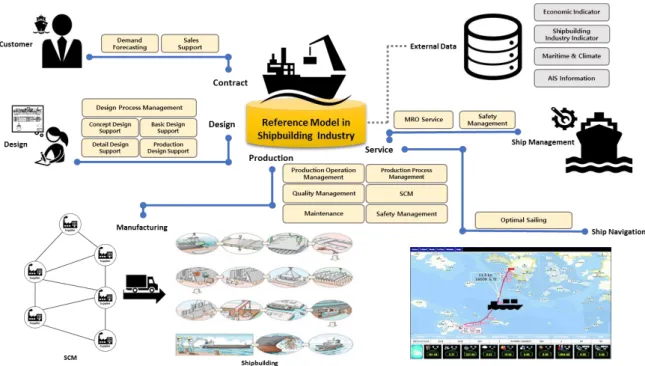
A reference model for big data analysis has been developed based on the literature survey and refined considering the feedback from the interview. The model is expected to work as the starting point for applying big data analysis to shipbuilding industry. It provides the applicable data analysis to shipbuilding industry according to the four phases of value chain in Figure 3, e.g., contract, design, production, and service. Each phase has categories of analysis related to tasks on each value chain. However, the categories of analysis on the production phase of the reference model are not accordance with the activities on the production phase of the value chain such as painting, erection, and others. The categories are more likely to depend on the division of department in the general manufacturing industry. It is because understanding of the applicable area for the data analysis is increased in terms of the practitioner. In the literature, the data analysis is utilized according to such categorization. The analysis composition for each phase will be explained in the following section.
22
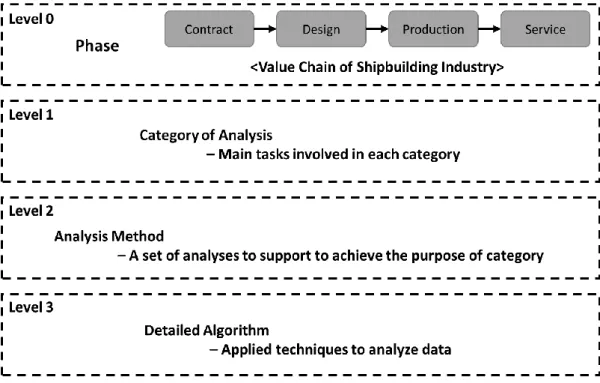
The reference model is composed of four layers in Figure 4, which are phase, category of analysis, analysis method, and detailed algorithm. There is a study for the big data analysis (H. Chen et al., 2012). This study provides application, data, analytics, and impact according to each area. Such an arrangement for the big data analysis was used in the thesis. In the reference model, data, detailed algorithms, results are provided at the level of analysis method. The category of analysis is equal to the level of applications in the literature. Also, the phase is compared to each area in the previous study. In addition, the reference model was tried to be specified as possible in that a specific industry was studied in our study. The phase is categorized according to the value chain of the shipbuilding industry. Each phase is composed of three levels of data analysis, i.e., category of analysis, analysis method, and detailed algorithm. Category of analysis is involved in main tasks or the issues in each phase. Considering the category, the analysis method supports to achieve the purpose of it. The analysis method is the major layer to provide the practical guideline for data analysis. It is described with data, detailed algorithm, analysis result, and related technology. The detailed algorithm is the applied techniques to analyze data. Other alternative algorithm having the equal purpose of analysis can replace the algorithm.
23
4.2.
Data Analysis in Contract Phase
4.2.1.
Contract Phase
The shipbuilding company highly depends on the demand of ship owners as shipbuilding is an order-made production industry. Moreover, the shipbuilding company is vulnerable to the market estimation for obtaining the ship order. As the competition in the global market increases due to emerging countries like China and the recession of shipbuilding industry holds out, major shipbuilders in the global market try to overcome these situations such as holding a conference to discuss about the prospect of new order market and countermeasure for the crisis. Big data is expected to be used in the contract phase of shipbuilding industry. It would help to forecast the demand in the market and support sales activity. Daewoo Shipbuilding & Marine Engineering (DSME) carried forward the development of forecasting model for a new demand of a ship in 2015. The model forecasts the new demand of a ship is based on the ship’s owner data, economic indicators, and ship sailing data. It complements the character of the shipbuilding industry in which it is hard to create new demand. Shipbuilding is a traditional order-made production industry that it is difficult for manufacturers to create new ship demands, unlike other manufacturing industries. DSME has tried to analyze data on cargo volumes, macro-economic indicators, and shipping-related indicators, and to preemptively discover new ship types and technology that will lead the market. Considering a sharp reduction in the ship order, demand forecasting of ship order and supporting sales activity are important to increase the amount of orders received. Therefore, the analyses to support these activities are described in the following section.
4.2.2.
Data Analysis Description
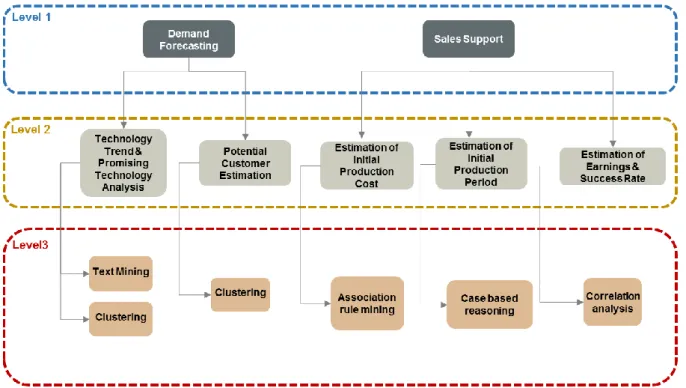
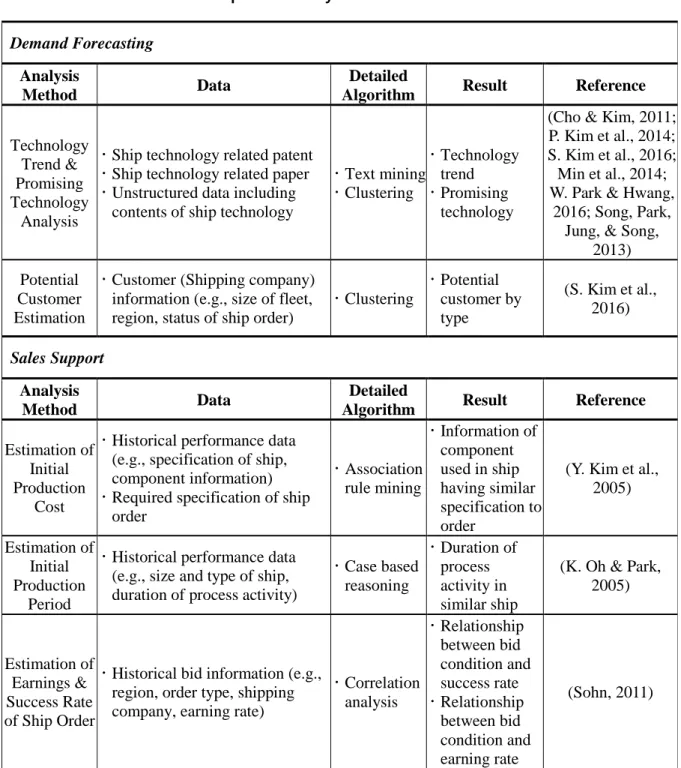
The analysis composition in the contract phase is in Figure 5. There are two major analyses on contract in the shipbuilding industry: demand forecasting and sales support. Demand forecasting is analyzed in detail: technology trend and promising technology analysis, and potential customer estimation. Sales support is further analyzed in three methods: estimation of initial production cost, estimation of initial production period, and estimation of earnings and success rate of a ship order. The analysis method descriptions are summarized in Table 1. Each analysis method is described as the following.
24
Figure 5. Analysis Composition in Contract Phase
Technology Trend & Promising Technology Analysis
As the ship and related technology develops, technology which is applicable to construct a new ship becomes various. The company is able to utilize technology in shipbuilding and to predict prospective technology in the future by analyzing technology trend and promising technology. The ship can be guessed based on the change of a technology trend. For example, if technology related to energy saving for the ship stands out, the company may expect that the demand of green ship will be increased. Unstructured data including the contents of ship technology such as ship technology related patent and paper is used for this analysis. In terms of detailed algorithm, text mining and clustering are used for the analysis. The trend of ship technology is verified from the change of primary key words by time as the result of applying text mining to the unstructured data related to ship technology. The importance of the keyword is evaluated based on the term frequency. Moreover, the result is visualized as word cloud. With text mining results, clustering is used to make a group composed of key words including affinity. Clustering results are visualized as cluster dendrogram. The cluster is adjusted by the distance between clusters. Finally, technology trend related to the ship and promising technology is derived as the result of the analysis method (P. Kim, Hong, & Koh, 2014; S. Kim, Nam, & Sun, 2016; Min, Kim, & Ji, 2014; W. Park & Hwang, 2016).
25
Potential Customer Estimation
Company in order-made production industry produces the product which is customized by customer requirements. It needs to manage customers to increase customer satisfaction and to obtain new order in the future. Potential customer estimation supports the company to prepare for demand by finding out the characteristics of the customers expected to make a new order. Classification information of customer groups is helpful to establish a marketing strategy considering customer property. Effective customer management will be conducted based on it. Customer (i.e., shipping company) information is used for this analysis. In terms of detailed algorithm, clustering is applied to the data. Applying clustering algorithm to the information of the current customer, including size of fleet, region, status of ship order, and others, customers are clustered depending on various standard in the information (S. Kim et al., 2016). Each cluster has the property for making a ship order. For example, customers are clustered by the size of the ship. Moreover, customers are grouped by the probability of marking a ship order in each cluster. In the end, clusters of the potential customer by standard are generated as the result of the analysis method.
Estimation of Initial Production Cost
It is crucial to rapidly deal with new order because the order quantity is not stable in order-made production industry. At the phase of contract, initial suggestion of the necessary cost involved in ship production that is suitable with the requirement of ship owner is significant. The expert has conducted existing estimation of the production cost. After the estimation, including the requirement of ship order, is requested, the expert examines the information and estimates the cost based on similar records with the information. The estimation result may be distorted by a subjective viewpoint on the expert and take a long time because it is conducted by each person. It is available to estimate the initial production cost more quickly and accurately through the estimation of the initial production cost based on the data. The requirement of the order and the historical record data including specification of ship, type and shape of ship, and component information, are used for this analysis. In terms of detailed algorithm, association rule mining is applied to the data (Y. Kim, Park, & Oh, 2005). This technique derives the associative relation among the primary specification of ship and the parts information corresponding to the specification. Given the required specification of the order, the most similar case is found. Finally, the parts used in the case are found out as the result of the analysis method. In addition, the initial production cost is estimated by using the unit cost of the parts to support sales activity for obtaining a ship order.
26
Estimation of Initial Production Period
Contract in the shipbuilding industry is concluded with the negotiation depending on the specification of the ship. As the existing calculation for the production period of the ship relies on the expert’s experience, the estimated period is not accurate. The accuracy of the estimated production period could be increased by using the historical record data. The data includes required specifications of ship order, size, and type, duration of process activity, and others. A more accurate estimation of the production period is available through estimation of initial production period. Moreover, it prevents excessive reduction of the production period to get the order by calculating reasonable production period using the data. In terms of the detailed algorithm, case based reasoning is applied to the data for the analysis (K. Oh & Park, 2005). Case based reasoning predicts the result of new case based on the results of the historical cases (Watson, 2001). It measures the similarity between the new case and historical cases. Then, it selects the case which is the most similar with the new case. The cases having similar specification to the requirement is searched on the historical data. Therefore, the process activity and the duration of it is verified on a similar shipbuilding case as the result of the analysis method. The overall production period is estimated using the result. It will be used as the estimated production period in the sales of contract.
Estimation of Earnings & Success Rate of Ship Order
When the shipbuilding contract is awarded on the way of competitive bids in shipbuilding industry, shipbuilders often tend to put up with the unfavorable bid conditions to obtain the order. Accordingly, it needs to consider the earning rate of getting the order as well as the success of that. Although the shipbuilders currently try to propose the favorable bid conditions based on the similar precedent, it takes a long time and the result may not be precise because the process of finding similar precedent is conducted manually. By analyzing the historical bid information such as region, order type, shipping company, earning rate and others, the reasonable bid condition will be derived. In terms of detailed algorithms, correlation analysis is applied to the data (Sohn, 2011). Correlation between the bid condition and success & earning rate is derived by the analysis using the data. The result will be used to make the bid condition which maximize the profit for winning the order.
27
Table 1. Description of Analysis Method for Contract Phase Demand Forecasting
Analysis
Method Data
Detailed
Algorithm Result Reference
Technology Trend & Promising Technology
Analysis
Ship technology related patent
Ship technology related paper
Unstructured data including contents of ship technology
Text mining Clustering Technology trend Promising technology
(Cho & Kim, 2011; P. Kim et al., 2014; S. Kim et al., 2016; Min et al., 2014; W. Park & Hwang,
2016; Song, Park, Jung, & Song,
2013) Potential
Customer Estimation
Customer (Shipping company) information (e.g., size of fleet, region, status of ship order)
Clustering Potential customer by type (S. Kim et al., 2016) Sales Support Analysis Method Data Detailed
Algorithm Result Reference
Estimation of Initial Production
Cost
Historical performance data (e.g., specification of ship, component information)
Required specification of ship order Association rule mining Information of component used in ship having similar specification to order
(Y. Kim et al., 2005)
Estimation of Initial Production
Period
Historical performance data (e.g., size and type of ship, duration of process activity)
Case based reasoning Duration of process activity in similar ship (K. Oh & Park, 2005) Estimation of Earnings & Success Rate of Ship Order
Historical bid information (e.g., region, order type, shipping company, earning rate)
Correlation analysis Relationship between bid condition and success rate Relationship between bid condition and earning rate (Sohn, 2011)
28
4.3.
Data Analysis in Design Phase
4.3.1.
Design Phase
The design in shipbuilding industry consists of four stages: initial design, basic design, detail design and production design (J. Oh, Park, Kim, & Jung, 2014). At the stage of the initial design, a concept of ship satisfying the requirement of the ship owner and the primary specification is determined. The basic design describes the process of determining the detailed specifications of the ship such as arrangement of equipment including navigation devices, housing facilities, electrical devices, and others. Moreover, the overall construction drawings are made. The drawings made at the stage of basic design is specified in detail to be understandable to the worker on the production field at the stage of detailed design. In addition, the results of basic design are verified on the detailed design. Lastly, a shop drawing of each part of the ship is made and procedures of forming and assembling are planned at the stage of production design. More than 12 months are averagely sent on the phase of design in shipbuilding process. Moreover, there are unnecessary cycle of tasks because the frequent change of design is general in shipbuilding industry and it causes to carry out the task related to the change. These rework and irrelevant cycle of the tasks need to be handled in terms of the whole process of the design. The big data analysis is able to support design phase by solving some issues on each stage of design. As the result of the analysis, it is expected to reduce the additional time for working and increase the efficiency. Considering these issues on the design, the analyses are proposed in the next section.
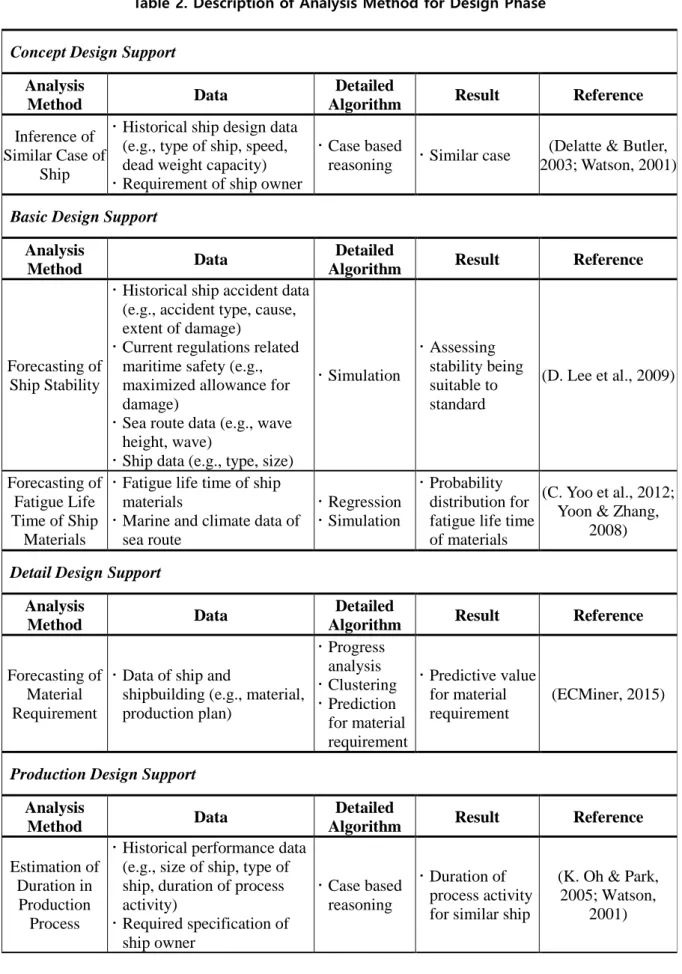
4.3.2.
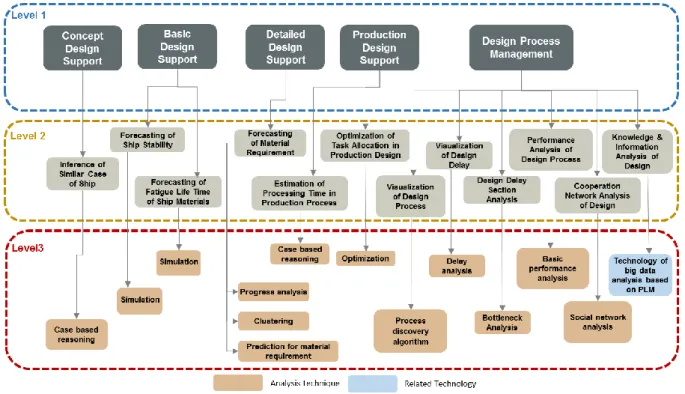
Analysis Description
The analysis composition in design phase is in Figure 6. There are five major analyses on design in the shipbuilding industry. They are initial design support, basic design support, detail design support, production design support, and design process management. These are developed considering the characteristic of design in the shipbuilding industry. Firstly, initial design support has an analysis method, inference of similar case of ship. Secondly, the basic design support is composed of two analysis methods. They are forecasting of ship stability and forecasting of the fatigue lifetime of ship materials. Thirdly, there is an analysis method, forecasting of material requirement, in detail design support. Production design support has two analysis methods, which are estimation of duration in production process and optimization of task allocation in production design. At last, there are four
29
analysis methods on design process management. They are visualization of design process, performance analysis of design process, diagnosis & visualization of cooperation network of design, and knowledge & information analysis of design. The analysis method descriptions are summarized in Table 2. Each analysis method is described as the followings.
Figure 6. Analysis Composition in Design Phase
Inference of Similar Case of Ship
Initial design stage in shipbuilding industry draws the optimal concept of ship satisfying the requirement of ship owner such as classification of freight, carrying capacity, size, speed, and expected route. The concept of ship is generally drawn depending on the experience of the designer. However, the empirical approach to derive the concept of ship is not reliable because the subjectivity of the designer may affect the process of drawing the concept. It needs to determine the basic performance of ship and the primary specification using the historical ship design data (Delatte & Butler, 2003). The data includes the type of ship, dead weight capacity, speed, the requirement of ship owner, and others. In terms of detailed algorithm, case based-reasoning is applied to the data. Case-based reasoning predicts the result of a new case based on the results of the historical cases (Watson, 2001). It measures the similarity between a new case, which is the requirement of ship owner, and the historical cases. If
30
the importance of each requirement is available, it will be considered as the weight when measuring the similarity. Then, it selects the case, which is the most similar with new case. As the result of this analysis method, the historical shipbuilding case, which is the most similar to the requirement, is selected. Based on the selected case, the value of design is referenced for the initial design.
Forecasting of Ship Stability
Current regulation related to the maritime safety suggests the standard for the stability such as the limitation of capacity depending on size and type of ship. However, the regulation is insufficient because it does not cover the stability considering the property of ship and sea route. Furthermore, the alternative of design is needed to increase the stability by evaluating the damaged stability considering the characteristic of the ship and sea route. It is assessed whether the design result is satisfied with the standard for the stability through forecasting of ship stability (D. Lee, Choi, Park, Kang, & Lim, 2009). Such analysis uses the data such as historical ship accident data (e.g., accident type, cause, extent of damage), current regulations related maritime safety (e.g., maximized allowance for damage), sea route data (e.g., wave height, wave), ship data (e.g., type, size), and others. In terms of detailed algorithm, simulation is applied to the data. Before implement simulation, the scenario of damaging ship is generated from the historical ship accident data. Simulation is conducted with setting actual wave state as the variable to predict the damaged stability. It is decided that the designed ship has the damaged stability accord with the standard if the measured damaged stability is under the maximized allowance of damage. In the case of exceeding the allowance, the alternative will be designed to correspond to the standard.
Forecasting of Fatigue Lifetime of Ship Materials
Fatigue lifetime
refers to the number of repetitions or the time until the structure is
destroyed when loads are repeatedly applied to the structure. The ship's fatigue lifetime needs
to be considered in the design process as the standards of ship design that can be operated in
extreme environments such as the North Sea are recently tightened. Materials with the high
fatigue lifetime would be derived through foresting of fatigue lifetime of ship materials. The
data such as fatigue lifetime of ship materials and
marine and climate data of sea route. Regression and simulation are applied to the data for the analysis. The value for the forecasting model of fatigue lifetime is calculated using the regression (C. Yoo et al., 2012). Moreover, the variables are randomly31
generated for the simulation. The effect of each variable to the fatigue lifetime is analyzed as the distribution of fatigue lifetime is derived from random variables. As the result of this analysis method, the distribution of fatigue lifetime is created, which considers the actual sea route. The distribution describes the accumulated probability that materials are destroyed before the applying of weight is repeated in N times, when N is the number of a cycle (Yoon & Zhang, 2008). Such a result supports the decision making on selecting the materials on the stage of basic design.
Forecasting of Material Requirement
In the case of custom-made materials used in shipbuilding, the required quantity should be predicted and materials would be ordered in advance before actual use. Material requirement needs to be predicted and ordered at the stage of the design so that materials can be procured before shipbuilding. The order for the materials when they are needed causes the delay of work because the custom-made materials takes a long time for the production. The material requirement is predicted through the analysis using the data. Data of ship and shipbuilding such as material and production plan is used for the analysis. In terms of detailed algorithm, the property of material requirement is derived by analyzing how the trend of material usage changes as time goes on. The ships are clustered based on the property and the standard for classification of the ship is reestablished. The forecasting model of material requirement predicts material requirement by the type of ship and the quality.
Estimation of Duration in Production Process
The way of operating the actual production process is planned at the stage of production design. Production planning is conducted depending on the experience of the worker on the actual work-site operations. Reasonable production planning is important based on the proper evidence because loss in the profit is caused by the compensation for the delay that actual work is not implemented according to the plan. The data driven production planning will be conducted through the estimation of duration in production process. The data is historical performance data such as size of ship, type of ship, duration of each process activity, and required specification of the ship owner. In terms of the detailed algorithm, case based reasoning is applied for the analysis. The most similar case to the requirement of ship order is found from the historical record data by using cased based reasoning (Watson, 2001). The duration of each production process of the selected case is used to make a production plan for shipbuilding of a new order (K. Oh & Park, 2005). As the result of this analysis method, the similar ship and the duration
32
of each process activity of it are generated from the similar case to the requirement of the ship order. This information is used as the basis for the production planning.
Optimization of Task Allocation in Production Design
Tasks of production design requires the longest working hours among the stages of design. In addition, it directly or indirectly affects the productivity improvement because it is related to the production of a ship. Production design tasks have a precedence relationship due to the process based work of it and the following task can start after the precedent task ends. The production design for a specific block usually takes about one month because a worker is responsible for production design for a specific block. The current allocation of the tasks is determined by the situation of the field relying on the experience and knowledge of the production design manager. It is necessary to consider experience, ability and past performance of the worker to allocate effectively tasks. The data driven approach is able to consider them. The effective allocation of production design tasks is implemented through optimization of task allocation in production design (Son & Kim, 2012). The data is the task data of production design such as level of difficulty of task and standard duration of task. Furthermore, worker data for task is used such as the experience of design tasks, performance, and others. In terms of detailed algorithm, Hungarian algorithm of optimization is applied to the data. The algorithm is generally used to solve the optimal allocation problem given tasks and workers which are one or more. As the result of the analysis method, the production design tasks are allocated to the workers when the total sum of duration is minimized.
Visualization of Design Process
During the design of the ship, the complex stream of design works appears because there are many works transferring due to the changes of the design. Due to the complex stream of the design work, it is difficult to understand the relationship among the design works clearly. By visualizing the stream of design works and establishing the design process model based on the event log of the design work, it is possible to understand the relationship among the design works. The data needed is the event log of design: for example, caseID, activityID, timestamp, and originatorID. The algorithm for analysis is process discovery algorithm. By using process discovery algorithm (ex. α-algorithm, Heuristic Mining, Fuzzy Mining, and Genetic Mining), it is possible to set and visualize the process model. The result of the analysis is the process model that treats each design work as an activity.
33
Visualization of Design Delay
The stage of designing the ship takes over twelve months on average. If the delay occurs on the design stage, it would affect the schedule of shipbuilding. Due to the delays on the design process occurring in practice, it is needed to understand the period that delay occurs, and the stream of the works. By visualizing the delays on the design stage, it is possible to know the current state of the delay on each design process, and the cause of the delay. The data for analysis is the event log of design (ex. caseID, activityID, timestamp, and originatorID). Delay analysis method is applied to the data, as the method for analysis. From comparison and analysis between the plans and actual data, it is possible to describe the current state of the delay on each design work according to the period of the delay. If certain work is delayed over the certain period, the work can be judged as the cause of the delay on the next design stage, and the target to reduce the delay. From the analysis, it is possible to visualize the number of delaying days, and understand the current state of the delay on design works according to the period of the delay.
Design Delay Section Analysis
When a new order of change comes on the stage of designing the ship, the delay on the design works occurs frequently because some of the completed works should be reworked. Due to the design processes being in progress simultaneously by many workers, and transferring the works happen frequently, it is needed to diagnose the delay in the viewpoint of the process. The data to analyze is an event log of design, such as caseID, activityID, timestamp, and originatorID. There are two methods to analyze the data. The first one is process animation. The progress of the works can be animated based on the process model generated by the event log data. The bottleneck point can be found by visualizing the speed of the progress on each design work, and the workload concentrated in a certain section. The other one is performance analysis with process model. With performance analysis with process model, it is possible to know the section and the work that consume long time on the process model. The result of the analyses is the bottleneck point on the design process.
34
Performance Analysis of Design Process
For effectiveness of the design process, it is needed to analyze the performance of the design process according to the performance on each work and worker, and the workload on the design process. By analyzing performance of the design process on each case, work, and worker, according to the frequency of the work and the time consumed, it is possible to diagnose the current state of the process. The data for analysis is the event log of design (ex. caseID, activityID, timestamp, and originatorID). The method to apply to data is basic performance analysis. By analyzing performance of the design process on each case, work, and worker, it is possible to diagnose the current state of the process based on the frequency of the work and the time consumed. By calculating working time and waiting time based on the event log, the simple statistics like minimum, maximum, and average value can be calculated. In addition, the basic performance analysis visualizes the result as graphs like bar chart, pie chart, meter chart, and time chart. The result from the analysis is the performance graph in various viewpoints like cases, works, and workers.
Cooperation Network Analysis of Design
However, many workers design the ship together during the stage of the ship design so transferring works among the workers happens frequently. For improving the efficiency by managing the overall design process, it is needed to understand and manage the work stream among the workers. By establishing the cooperation network among the workers designing, it is possible to understand the primary work stream among the workers, and the primary workers. The data needed is an event log of design: for example, caseID, activityID, timestamp, and originatorID. The method for analysis is social network analysis. Social network analysis shows the relationship among the workers according to works transferred. The node meaning the worker, who has high frequency of performing the work, appears big. It is possible to visualize the primary relationship above the standard, according to the frequency of the relationship among the workers. From the analysis, the social network among the workers who transfer their works to each other is visualized.
35
Knowledge & Information Analysis of Design
The error of the design found at producing/installing/operating/decommissioning, occurs safety problems and the economic loss. However, it is difficult to find inefficiency and errors on the design process with manpower. If the inefficiency and the errors are prevented in advance by using big data analysis, it is possible to improve the competitiveness of production. By analyzing the data accumulated on PLM (Product Lifecycle Management, a system for controlling the data and information of the ship and offshore platform), and finding and resolving the problems in advance, it is needed to support the decision making for designers and managers to take action effectively. The related technology is a technology of big data analysis based on PLM. When the high-quality data analyses technology, big data analysis to PLM is supported. To realize the technology, five things are needed: I) a multi-dimensional data model for analyzing PLM data; II) a system of online analytical processing and visualization for analyzing PLM multi-dimensional data; III) a model and an engine of data mining for analyzing PLM; IV) PLM data structure integrated with internet of technology things; V) a technique of big data analysis for the internet of things. By analyzing the data accumulated on PLM, for example, component masters, the structure of the product, and the design information on drawings, it is possible to extract patterns of designing and non-standardized design knowledge. By analyzing the data accumulated on PLM, and understanding the various errors, it is also possible to prevent the safety problems and the economic loss in advance when the errors are found in designing, operating, and decommissioning.
36
Table 2. Description of Analysis Method for Design Phase Concept Design Support
Analysis
Method Data
Detailed
Algorithm Result Reference
Inference of Similar Case of
Ship
Historical ship design data (e.g., type of ship, speed, dead weight capacity)
Requirement of ship owner
Case based
reasoning Similar case
(Delatte & Butler, 2003; Watson, 2001)
Basic Design Support
Analysis
Method Data
Detailed
Algorithm Result Reference
Forecasting of Ship Stability
Historical ship accident data (e.g., accident type, cause, extent of damage)
Current regulations related maritime safety (e.g., maximized allowance for damage)
Sea route data (e.g., wave height, wave)
Ship data (e.g., type, size)
Simulation Assessing stability being suitable to standard (D. Lee et al., 2009) Forecasting of Fatigue Life Time of Ship Materials
Fatigue life time of ship materials
Marine and climate data of sea route
Regression
Simulation
Probability distribution for fatigue life time of materials
(C. Yoo et al., 2012; Yoon & Zhang,
2008)
Detail Design Support
Analysis
Method Data
Detailed
Algorithm Result Reference
Forecasting of Material Requirement
Data of ship and
shipbuilding (e.g., material, production plan) Progress analysis Clustering Prediction for material requirement Predictive value for material requirement (ECMiner, 2015)
Production Design Support
Analysis
Method Data
Detailed
Algorithm Result Reference
Estimation of Duration in
Production Process
Historical performance data (e.g., size of ship, type of ship, duration of process activity) Required specification of ship owner Case based reasoning Duration of process activity for similar ship
(K. Oh & Park, 2005; Watson,
37 Optimization of Task Allocation in Production Design
Task data of production design (e.g., level of difficulty of task, standard duration of task)
Worker data for tasks
Optimization
Optimized allocation of tasks
(Son & Kim, 2012)
Design Process Management
Analysis
Method Data
Detailed
Algorithm Result Reference
Visualization of Design
Process
Event log of design (e.g., caseID, activityID, timestamp, originatorID)
Process discovery algorithm
Process model (S. Kim et al., 2016)
Visualization of Design
Delay
Event log of design (e.g., caseID, activityID, timestamp, originatorID)
Delay analysis
Current state of
design delay (S. Kim et al., 2016)
Design Delay Section Analysis
Event log of design (e.g., caseID, activityID, timestamp, originatorID) Process Animation Performance Analysis with Process Model Delay section
and task (S. Kim et al., 2016)
Performance Analysis of Design Process
Event log of design (e.g., caseID, activityID, timestamp, originatorID) Basic performance analysis Performance of case/task/worke r (S. Kim et al., 2016) Cooperation Network Analysis of Design
Event log of design (e.g., caseID, activityID, timestamp, originatorID)
Social network analysis
Social network (S. Kim et al., 2016)
Knowledge & Information Analysis of
Design
Related technology: technology of big data analysis based on
38
4.4.
Data Analysis in Production Phase
4.4.1.
Production Phase
Shipbuilding industry has three properties: labor-intensive, capital-intensive, and technology-integrated. Shipbuilding industry is the industry of comprehensive fabrications; ships are constructed with numerous materials and components in the extensive scale, compared to products from other manufacturing industries. Simply, the shipbuilding process can be described as cutting huge steels, welding them, and making the structures of the ship. These processes are complicate works and demand lots of labor. In addition, for shipbuilding, the shipbuilding company should get fabrication yards equipped with huge facilities like building berths, docks and cranes and secure funds for management. Due to the market of shipbuilding being worldwide and a single market, the competitiveness of cost and technology is very important as well. Works of shipbuilding need combination of various types of technology like shipbuilding engineering, mechanical engineering and electronic engineering. The competitiveness of the shipbuilding company is, therefore, determined by the types of technology for design and production.
The procedures of shipbuilding are conducted through forming of various materials and components, sub-assembly and grand assembly so smooth procurements for materials and components and swift construction of components, piping and blocks are the primary factors for delaying the period of delivery. Compensation for delaying makes profitability of shipbuilding deteriorate. In order to manage supply chains effectively and installing pipes on right time, the needs for application of big data analysis exist. Although automation of processes in shipbuilding is inadequate compared to those of other manufacturing industries, the quality and quantities of data collected during construction of the ship are expected to improve because of the improvement of the concerned types of technology and reduction of cost for introducing the sensors. Considering the current circumstances of shipbuilding industry mentioned above, the importance of the application of big data analysis is expected to increase gradually.
With the application of big data analysis to improve efficiency of shipbuilding procedures including improvement of the types of technology related to shipbuilding, management of supply chains, installation of pipes on the right time, etc., the competitiveness of shipbuilding industry appears to be strengthened.
39
4.4.2.
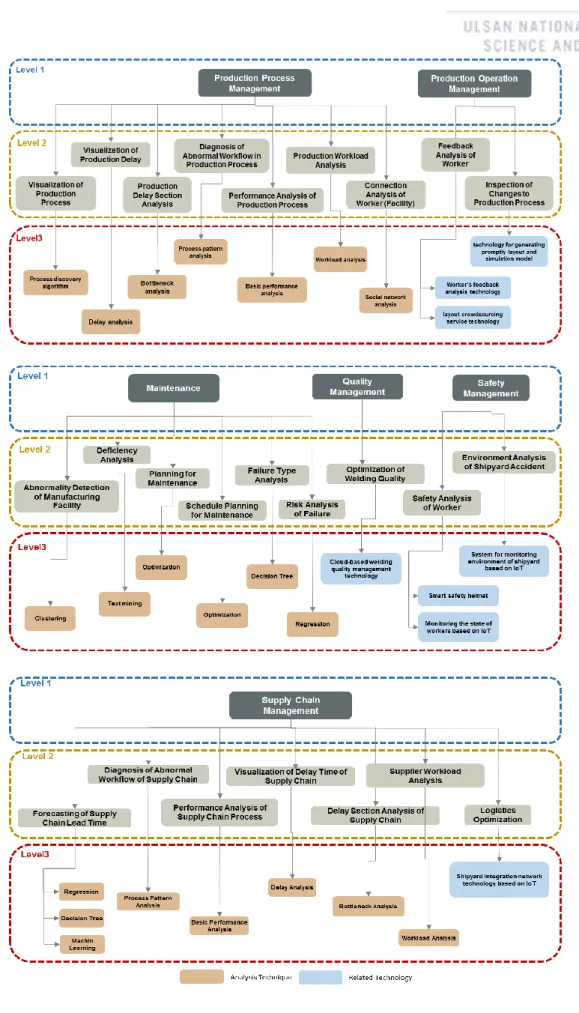
Data Analysis Description
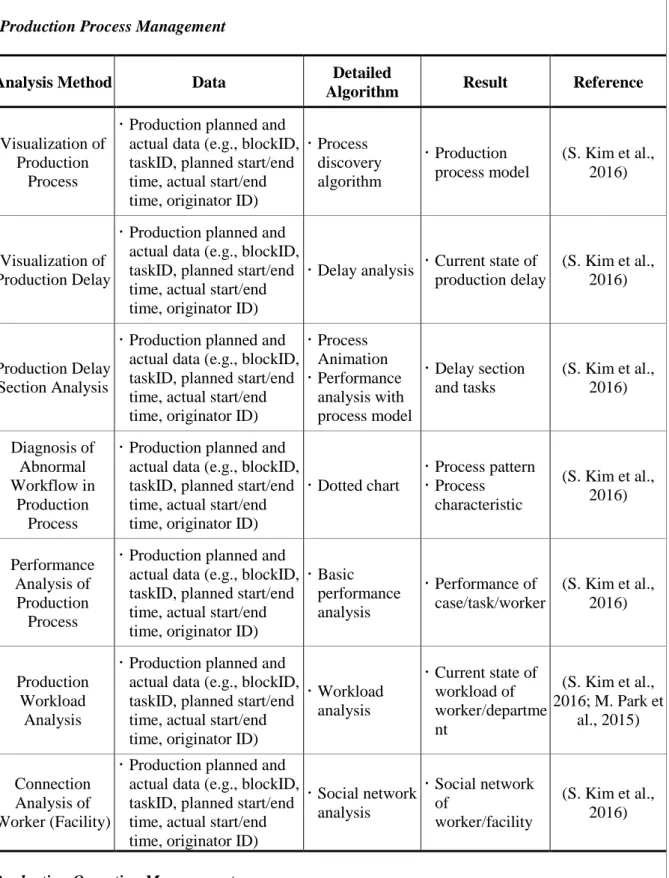
The analysis composition in production phase shows in Figure 7. There are six major analyses on production in shipbuilding industry: production process management, production operation management, maintenance, quality management, safety management, and supply chain management. These are developed by considering of the characteristic of production in the shipbuilding industry.
Firstly, production process managements have visualization of production process, visualization of production delay, production delay section analysis, diagnosis of abnormal workflow in production process, performance analysis of production process, production workload analysis, and connection analysis of the worker (facility). Production operation management is composed of two analysis methods: feedback analysis of the worker, and inspection of changes to the production process. Thirdly, maintenance has abnormality detection of manufacturing facility, planning for maintenance, schedule planning for maintenance, failure type analysis, risk analysis of failure, and deficiency analysis. Quality management includes optimization of welding quality. Safety management has two analysis methods, safety analysis of the worker, and environment analysis of the shipyard accident. Lastly, there are seven analysis methods on supply chain management: forecasting of supply chain lead-time, diagnosis of abnormal workflow of supply chain, performance analysis of supply chain process, visualization of delay time of supply chain, delay section analysis of supply chain, supplier workload analysis, and logistics optimization. The analysis method descriptions are summarized in Table 3 ~ 5.
40