H
OW TO INTERNALIZE CONGESTION COSTS
THROUGH A PRICING SCHEME IN THE
METROPOLITAN AREA OF
M
ADRID
Floridea Di Ciommo, Senior researcher, TRANSyT- Universidad Politecnica de Madrid, Spain
Andrés Monzón, Professor, E.T.S.I. Caminos, Canales y Puertos – UPM
Abstract
Following the EU policy oriented to implement a tolling system based on social marginal costs, Spain is studying the implementation of an interurban road pricing scheme. In particular, a main result from the Spanish Road Pricing Model suggests that a road pricing scheme based on the congestion costs makes sense only in the reduced number of metropolitan highways and can be used to manage the travel demand in an urban and metropolitan context. In consequence, the analysis of this paper is focused on the results of the simulation of a toll-ring defined as a combined toll (access and distance toll based scheme) applied on the one of the more congested ring of the Madrid Metropolitan Area, the M40. The results are analyzed in terms of efficiency and equity criteria. Finally, the results of the implementation of a toll-ring pricing policy show a clear increasing level of socio-spatial inequalities. In fact, when the users have a viable road alternative, the burden of the toll-ring is equally distributed, if not, the burden of toll ring affects more the less wealthy people.
INTRODUCTION:
ROAD PRICING STRATEGY TO INTERNALIZE
CONGESTION COSTS
Among the interurban road pricing policies, the metropolitan road tolling policies need to be differently analyzed because of its specific characteristics. In fact, the urban and metropolitan areas intercept most of the daily journeys which contribute to congestion and which are very sensible to the toll because of their daily frequency.
Following the EU policy (Towards fair and efficient pricing in Transport, 1996) oriented to implement a tolling system based on social marginal costs, Spain is studying the implementation of an interurban road pricing scheme (Di Ciommo, Monzón and Fernandez, 2010). A starting point is that prices should reflect the marginal social cost imposed on society by consumption of the good (v-km travelled). When car users decide to travel additional kilometres they impose additional costs (Nash, 2007):
• on themselves (operating and time costs)
• on the infrastructure-provider (maintenance and operation costs)
• on other users (delay and congestion cost)
• on the rest of society (accident, climate change, pollution and noise).
Costs to other users and to the rest of society are referred to as external costs. These costs, specially the congestion costs, in general, are higher in the metropolitan areas than in the other areas.
A main result from the Spanish Road Pricing Model (META, 2007) in terms of policy implications suggests that a road pricing scheme based on the congestion costs makes sense only in the reduced number of metropolitan highways and can be used to manage the travel demand in an urban and metropolitan context, like the Madrid Metropolitan Area.
The objective of this paper is to evaluate how internalize a congestion cost by a toll-ring scheme in a metropolitan area like Madrid. In particular, the analysis is focused on the results of the simulation of a toll-ring defined as a combined toll (access and distance toll based scheme) applied on the one of the more congested ring, the M40. The results are analyzed in terms of efficiency and equity criteria.
MADRID MOBILITY PATTERNS AND SPRAWLS PROCESS
Madrid is experimenting an intensive sprawling process. During the last fifty years, Madrid changes its urban organization: from a monocentric city became a policentric metropolis. The metropolitan bounds of Madrid enlarged including an higher population in respect of the municipality of the city center. If the population of Madrid multiplies itself for 1,9 during the last 60 years, the Madrid Metropolitan Area (MMA) multiplied that for 26,1. The current demographic evolution shows that the municipality of the city center looses population: its demographic weight in respect of the metropolitan area changes from 65% to 52% between 1985 and 2006. Considering the demographic density in the new suburbs, the new metropolitan periphery is characterized by a lower residential density, produced by a dispersed residential zone and a fragmented urban landscape. In this context, the urban land increased much more than the population. Up
to now, measures intended to channel or direct such urban sprawl have rarely been applied (Monzón and De la Hoz, 2009).
In the MMA, the car ownership rate is almost 550 per 1,000 inhabitants, which is the highest motorization rate among the Spanish regions. The phenomenon of the suburbanization of both residence and employment along with the increase of car ownership is prompting new transportation trends in the MMA, increasing the congestion phenomena especially on the metropolitan rings of M40 and M30 during the peak hours.
Figure 1. Madrid Metropolitan Area, city center and rings location.
The mobility survey developed on the Madrid Metropolitan Area shows that from 1996 to 2004 the number of mechanized trips increased by 52%, whereas the population increased only by 14%. An efficient way to manage the increasing car travel demand could be the implementation of a metropolitan toll in the more congested road sections, associated with an urban planning policy.
MMA
N
M40
M30
INTERNALIZING EXTERNAL COSTS BY A CONGESTION PRICING
STRATEGY IN THE MMAThe evaluation of internal and external cost is an essential and effective way to charge road users. Economic theory suggests social marginal cost pricing as the optimal pricing principle for charging the use of transport infrastructure, especially in the metropolitan areas.
The Spanish road pricing model (META, 2010) has developed an easy-to-apply pricing methodology, based on a bottom-up approach. The main variable is the AADT (Average Annual Daily Traffic, daily flow) applied to accurately estimate generalized road transport costs for each kind of vehicle and each type of road. Based on the current Spanish road network, the META model estimates all social costs: internal costs (fuel, vehicle maintenance, labor, insurance and tax) and external costs (infrastructure, congestion, accident and environmental nuisances). Computed for the 13,156 km of interurban highways network, the model calculates the costs for each vehicle type (Car, HGV, LGV and bus) and for each road network section following the interurban road characteristics (AADT, capacity and traffic composition for each section of highway network).
The two main results of META model for costs in terms of policy implications suggest to moderate the construction of new interurban road infrastructures in Spain and to analyze congestion before building new metropolitan roads (Di Ciommo et al. 2010). A road pricing scheme based on congestion costs makes sense only in the reduced number of metropolitan highways and can be used to manage the travel demand in an urban and metropolitan context. In this case, the marginal costs can be the principle to define a congestion road pricing like a toll-ring in MMA (Inge et al. 1996). The aim of a cost model is to estimate the external costs produced by the road users and to assign them with a cost equivalent charge. Consequently, it is necessary to consider a formulation that allows assessing the total, average, and marginal costs in order to establish the most adequate toll to internalize the externalities produced by road traffic. The applied methodology defines the total cost function (CT), which is expressed depending on the hourly traffic flow. Initially, 4 different vehicle categories were considered (a standard private vehicle with a 2 liter engine I1 , an 18tons bus for passenger transportation I2, an 18-20 tons rigid truck, I3, and articulated heavy vehicle for freight transportation, I4). The final expression for the total costs in euro per vehicle-km is given by:
(
I1,I2,I3,I4)
C
The external costs derived from road traffic can be classified according to their nature as congestion costs, environmental costs (noise, climate change, pollution), costs of accidents and, in some cases, infrastructure (CE Delft, 2008). The final road traffic social cost function is an additive function of these costs:
TA TENV TI cong TO T C C C C C C = + + + + (2) TO C
Operation costs (fuel consumption and travel time) cong
C
Congestion cost: travel time cost and additional consumption costs during congestion
TI
C Maintenance and operation costs for infrastructure
TENV
C
Environmental costs (CO2, atmospheric pollution and noise costs) TA
C Costs of accidents
The marginal external cost, for each kind of vehicle, is obtained deriving the total external costs function:
(
)
1 4 3 2 1 1 , , , ' I I I I I C C T ∂ ∂ = (3)In this paper, we mainly focus on the congestion costs that represent mainly the difference between internal and social marginal costs. These costs represent the basis for a toll-ring scheme in a metropolitan area and we use the average operation costs and the congestion costs estimated by the META model in the travel demand simulation model.
One of the most popular “congestion pricing policies” is the toll-ring scheme used in Oslo (such as Trondheim and Bergen) and in Stockholm, where the vehicles are taxed when entering or exiting the city centre, especially during peak periods. In fact, a toll-ring scheme discourages orbital diversions, achieving higher efficiency and environmental benefits.
CONGESTION PRICING: A TOLL RING SCHEME IMPLEMENTATION
A combined toll based on an access and distance scheme is simulated in the metropolitan highway M40 during the peak hour (8-9 a.m.).M-40 is the main metropolitan ring looping surrounding Madrid; with a total length of 63.3 km, looping around the city at a mean distance of 10.1 km to the city center. Furthermore, it is the only one of the several ring roads serving Madrid that runs as a full-fledged motorway for all its length (the inner ring, M-30, has a span about 2 km long at the northern arc that are not freeway-grade, having level crossings and traffic lights, and M-45 and M-50 are not complete rings). Some road sections of the M40 represent the most congested in Spain, like showed by META. In consequence, we set up the toll in all the links of entrance to the inner ring delimited by M40 and the links of the M40 as well. The combined access and distance based scheme is estimated around 1.0€+0.1€/veh-km: 1.0€ represents the entrance to the inner ring and 0.1€/veh-km is the toll based on the travelled distance.
TOLL RING SCHEME EFFECTS ON CONGESTION
The following tables shows the results of the simulation obtained from VISUM in terms of traffic volume (v-km) and current travel speed of the whole network, the M30 and M40 rings, and the city center, respectively.
Table I- Hourly traffic volume and average speed in the reference and toll-ring scenarios Affected
roads or city areas
Reference scenario: without toll Toll-ring scenario: with toll Traffic flow (1000 v-km) Speed (km/h) Traffic flow (1000 v-km) Speed (km/h) Total Network 6,516 42 6,529 42 M40 728 57 649 70 M30 363 55 370 54 City Center 29 37 29 37
Analyzing these results, we remark a clear melioration in the M40 (70 km/h in the Toll-ring scenario versus 57 km/h in the reference scenario), without a real prejudgment for the other road ring (M30) and the city center. The travel demand model used for this toll simulation considers only the private car traffic: in other words the travellers cannot change their mode choice, neither the travel time. So the whole network traffic volume and current speed retain whatever with toll or not.
From Table I, firstly we could see the hourly traffic volume and travel speed changed significantly in the tolled area. The traffic volume decreases 11% in the M40 and the travel speed increase 23%, without affecting the traffic flow in the M30.
EFFICIENCY AND EQUITY ANALYSIS ON SELECTED ROAD SECTIONS
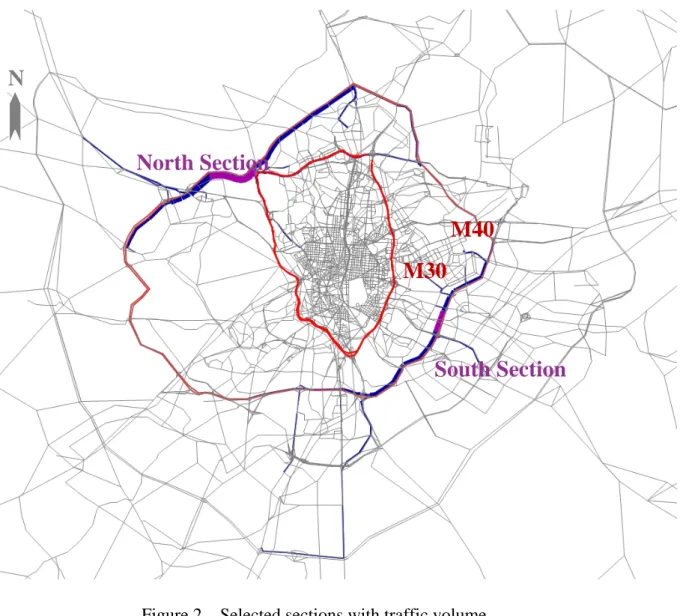
OF M40To realize an analysis in terms of the efficiency and equity terms, we compare the congestion pricing simulation in two different road sections located in the south and north of M40, like showed by the Figure 2. In this way, we can analyze the influence of the metropolitan toll in different areas of Madrid.
We present the information of traffic volume, current travel speed and impedance in road a representative section located in the north of M40, and a representative section located in the south. Two kinds of analysis have been done, one is centred on demand variation analysis; the other is done in terms of the equity impact analyzing the income distribution of the users of the two different road sections (Viegas, J.M. ,2001).
The adopted criteria to select the two road sections to compare the efficiency and the equity effects are basically four:
1. both road sections of the M40 are congested
2. the socio-economic environment is different: wealthy in the north and poor in the south.
3. road alternatives to M40 are different: while in the north section the only other ring is M30, for the south section, there also exist M45 and M50, which are uncompleted rings surrounding Madrid.
4. an important quantitative difference characterizes the traffic flow with and without toll.
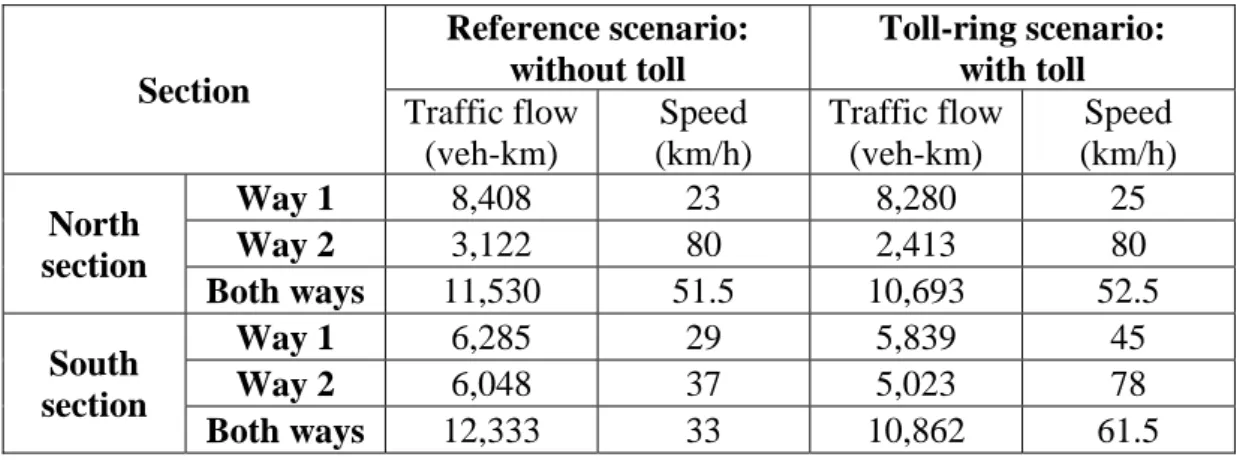
Table II - Characteristics of two selected road sections in the M40 ring
Section Reference scenario: without toll Toll-ring scenario: with toll Traffic flow (veh-km) Speed (km/h) Traffic flow (veh-km) Speed (km/h) North section Way 1 8,408 23 8,280 25 Way 2 3,122 80 2,413 80 Both ways 11,530 51.5 10,693 52.5 South section Way 1 6,285 29 5,839 45 Way 2 6,048 37 5,023 78 Both ways 12,333 33 10,862 61.5
Figure 2 – Selected sections with traffic volume.
In the toll-ring scenario, we explored different levels of toll to see how this road pricing scheme influenced the traffic volume. The result in terms of the efficiency of different toll levels is: increasing 2 or 3 times the variable part of the toll fee, the traffic volume decreased more than 2 or 3 times. In other words, the traffic flow is very sensitive in respect of the toll changing.
Table III – Sensitivity analysis on price level
Toll values M40 South Road section North Road section
1.0 € + 0.1 €/vkm 11% 12% 7% 1.0 € +0.2 €/vkm 24% 31% 11% 1.0 € +0.3 €/vkm 38% 53% 15%
South Section
North Section
N
M40
M30
Comparing South and North sections, the results show that the road section located in the South of M40 is much more influenced by the toll, the demand decreases of 31% by using 0.2 €/vkm and 53% by using 0.3 €/vkm because of the alternative metropolitan highways (M45 and M50, for example), while the variability of the demand variation in the North road section is lower, because of the less alternative roads.
The objectives more commonly pursued when implementing a pricing policy are: congestion reduction, improving the environment and generating revenue (May and Milne, 2000). However, there are other important aspects to consider, as urban sprawl or equity. This last one is considered by several authors as one of the main obstacles for citizen acceptability of the measure (Litman, T. 1996; Schlag, B. and Teubel, U. 1997; Link, H. 2007).
Equity can be faced from numerous dimensions. One of the most common is the so called “vertical equity”, which can be seen as an unequal impact from the scheme across the different groups of the population segregated by income level, sex, available alternative to car, age, or even race (Sumalee, 2003). To this respect, users income level is one of the main variables considered in equity analysis. Foster (1974, 1975) was perhaps the first to argue that road pricing discriminates against the poor.
One of the ways to mitigate this effect is to use the revenues obtained, at least partially, to improve the public transport system. In this way, it exists a transfer of income from higher income individual to lower income ones, which means, according to the Dalton principle, an equity improvement (Ramjerdi, 2006, Rietveld, 2003).
It also exists the “horizontal equity”, or spatial equity, which can be described as the distribution of the benefits and costs of the scheme across the population from different areas in the network (Sumalee, 2003).
From traditional economic equity analysis, there exists a notion of an index for income-distribution which measures the income-distribution of income amongst the population. Several indexes have been proposed in the literature (Cowell, 1995). In transport, these measures have been occasionally adopted in the policy analysis. Vold (2005) adopted the Gini coefficient to evaluate the spatial equity impact of different transport policy packages using Kolm’s measure. Sumalee (2003) adopted the Gini coefficient to evaluate the spatial equity impact from different charging cordon design. In this paper, the Gini coefficient will be used to measure the equity effects from the same toll design, but different areas in the network.
Given the structure of the socio-economic characteristics of MMA with a wealthy North and a poorer South of region, it is appropriate to evaluate the distribution of income amongst the users of the M40 according to their origin-destination, following the spatial equity analysis (Maruyama, T. and Sumalee, A., 2007) and, once categorized by their route choice after the congestion toll implementation, to examine the incidence of a congestion pricing policy on the income distribution, comparing the Gini index in the reference scenario and toll-ring scenario.
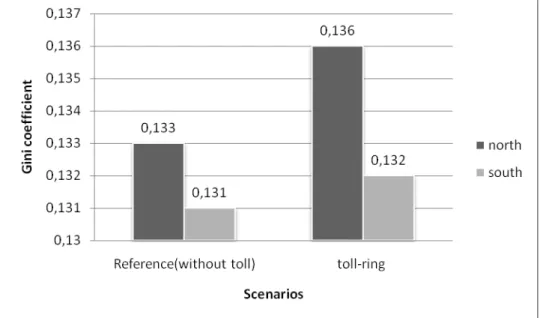
The Lorenz curve (distribution north and distribution south) is constructed by organizing the population (the M40 users who have their origin node in the north or in the south of the MMA) in an increasing order of their incomes and by assigning to each individual the proportion of total income earned by that individual. The Gini coefficient may be defined as the proportion between the area between the equality distribution and Lorenz curves and the area under the equality curve. The Gini coefficient thus takes the value between 0 and 1, in which Gini = 0 is the case with the perfect equitable situation. Comparing the two user situations in the two road sections, the Gini coefficient shows a similar situation in terms of income distribution before the congestion toll implementation. Therefore, after the toll-ring implementation, the Gini index shows an increasing evolution amongst the users of the northern road section. In other terms, in this area of the network, the burden of the congestion toll affects more the less wealthy population like showed in the figure 4, while in the south, the weight of the toll congestion is more equally distributed and the Gini coefficient is quite constant respect to the “ reference or do nothing scenario”.
Figure 4 - Gini coefficient level for each road section selected with and without toll
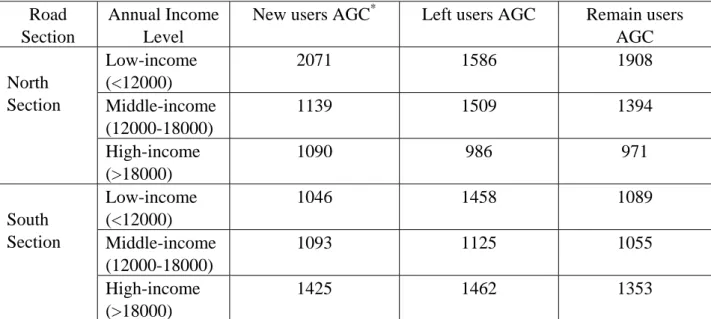
Finally, the results presented in table IV show a clear increasing level of socio-spatial inequalities. Categorizing the road users by their route choice, leaving the tolled M40, remaining users of the M40 or the new coming users of M40, after the toll-ring implementation, the incidence of a congestion pricing policy in the north affect more to low income users, especially the new coming users and the remaining users of the M40, while in the south the burden of the congestion pricing is quite equally distributed. These results are symmetric in respect of the Gini evolution. A deep analysis of the two different users population from the north and south of the M40 shows that even if the north population in general has a higher level of income, the lower income population localized in the north pays proportionally more for the congestion toll policy because they live far from the alternative route and they are obliged to take the M40.
Table IV- Toll-ring burden on the income of the M40 users during the peak-hour Road
Section
Annual Income Level
New users AGC* Left users AGC Remain users AGC North Section Low-income (<12000) 2071 1586 1908 Middle-income (12000-18000) 1139 1509 1394 High-income (>18000) 1090 986 971 South Section Low-income (<12000) 1046 1458 1089 Middle-income (12000-18000) 1093 1125 1055 High-income (>18000) 1425 1462 1353
*Average generalized trip cost
CONCLUSION: THE TRADE-OFF BETWEEN EFFICIENCY AND EQUITY
EFFECTSThe results of the simulation in terms of efficiency effects and demand elasticity variation show that a congestion pricing policy like the implementation of a toll-ring has a deep incidence on the behaviour of the road users. If an increasing toll-ring produces a quite high variation of the travel demand with a demand elasticity reaching 53%, knowing that the incidence of the average operation costs linked to the introduction of the toll-ring is high (until 2,500 € by year), it is possible that in the long term the road users change their residential and socio-economic behaviour. A recentralization of the residential and economic activities could be possible inside of the ring of the M40. Finally, the implementation of a toll-ring to the M40 seems to be strategically chosen. On one side in the short term, we achieve the managing of the travel demand of a congested metropolitan ring; on the other side, in the long term, the travellers could change their residential and economic behaviour, localizing them self inside of the M40 ring. In terms of efficiency, we could obtain a better situation. The problem remains in terms of equity effects: if the burden of the toll-ring in the north of the M40 is higher for the poorer people, it is necessary to see if they can or cannot choose an M40 inside residence. If they have choice, a short inequity effects can be compensated by a long term residential recentralization. If it is not the case, the implementation of a toll ring scheme can increase the inequality income distribution, especially in the north of the M40.
Acknowledgements
The authors acknowledge the Infrastructure and Transport Ministry Institute (CEDEX) for its financial support to formulate the Spanish road-pricing Model (META). We thank Yang Wang and Cristina Valdés, both TRANSyT Phd candidates, for collaborating in the modelling work and simulation of the toll ring scenarios.
REFERENCES
Cowell, F.A., 1995. Measuring Inequality. Harvester Wheatsheaf, Hemel Hempstead. Di Ciommo, F. Monzón, A., Fernandez, A. (2010). Measuring the acceptability of
interurban road pricing among different groups of stakeholders. The case of Spain, 89th Transport Research Board Congress, WDC, Annual Meeting.
Foster, C. (1974). The regressiveness of road pricing. International Journal of Transport Economics 1(2), 133-141.
Foster, C. (1975). A Note on the Distribution Effects of Road Pricing: A Comment. Journal of Transport Economics and Policy 9, 186-187.
Link, H. (2007). Acceptability of the German Charging Scheme for Heavy Goods Vehicles: Empirical Evidence From Freight Company Survey.” Transport Reviews, Vol. 28, No. 2, 141-158.
Litman, T. (1996). Using Road Pricing Revenue: Economic Efficiency and Equity Considerations. Transportation Research Record: Journal of the Transportation Research Board. No. 1558, TRB, National Research Council. Washington. D.C. Maruyama, T. and Sumalee, A. (2007) Efficiency and equity comparison of cordon- and
area-based road pricing schemes using a trip-chain equilibrium model, Transportation Research A, 41(7), 655-671.
May, A.D., Milne, D.S., (2000). Effects of alternative road pricing systems on network performance. Transportation Research 34A (6), 407–435.
META. Modelo Español de Tarifación de carreteras. Informe final: Resultados y Recomendaciones, CEDEX-Ministerio de Fomento, 2010, 115p.
Monzón, A. and D. de la Hoz, (2009). Efectos sobre la movilidad de la Dinámica territorial de Madrid. URBAN, 14, 58-71.
Nash, C. (2007). Road Pricing in Britain. Journal of Transport Economics and Policy, 41, 135-147.
Ramjerdi, F. (2006). Equity Measures and Their Performance in Transportation. Transportation Research Record, vol. 1983, Trans Res Board, 67-74.
Rietveld, P.(2003). Winners and losers in transport policy: on efficiency, equity and compensation. Handbook of transport and the environment, 585-602
Schlag, B. and Teubel, U. “Public acceptability of transport pricing.” IATSS Research, 21, 1997, pp.134-142.
Sumalee, A., (2003). Optimal toll ring design with spatial equity impact constraint: an evolutionary approach. Journal of Eastern Asia Society for Transportation Studies 5, 1813-1828.
Viegas, J.M. (2001). Making urban road pricing acceptable and effective: searching for quality and equity in urban mobility. Transport Policy 8 (4), 289-294.
Vold, A. (2005). Optimal land use and transport planning for the Greater Oslo area. Transportation Research 39A (6), 548-565.