Report 10
Performance Measures for Freight Transportation
TRB
Performance Measures for
Freight Transportation
NatioNal
cooperative
Freight
research
program
NCFRP
RePoRT 10
Sponsored by the
Research and
Innovative Technology
Administration
oRTATI oN Re Se ARC h Bo AR d R eSS Se R vIC e Reque ST ed Non-profit Org. U.S. PostagePAID
Washington, DC Permit No. 8970OFFICERS
CHAIR:Neil J. Pedersen, Administrator, Maryland State Highway Administration, Baltimore VICECHAIR:Sandra Rosenbloom, Professor of Planning, University of Arizona, Tucson EXECUTIVEDIRECTOR:Robert E. Skinner, Jr., Transportation Research Board
MEMBERS
J. Barry Barker, Executive Director, Transit Authority of River City, Louisville, KY
Deborah H. Butler, Executive Vice President, Planning, and CIO, Norfolk Southern Corporation, Norfolk, VA William A.V. Clark, Professor, Department of Geography, University of California, Los Angeles
Eugene A. Conti, Jr., Secretary of Transportation, North Carolina DOT, Raleigh
James M. Crites, Executive Vice President of Operations, Dallas-Fort Worth International Airport, TX Paula J. Hammond, Secretary, Washington State DOT, Olympia
Adib K. Kanafani, Cahill Professor of Civil Engineering, University of California, Berkeley Susan Martinovich, Director, Nevada DOT, Carson City
Michael R. Morris, Director of Transportation, North Central Texas Council of Governments, Arlington Tracy L. Rosser, Vice President, Regional General Manager, Wal-Mart Stores, Inc., Mandeville, LA Steven T. Scalzo, Chief Operating Officer, Marine Resources Group, Seattle, WA
Henry G. (Gerry) Schwartz, Jr., Chairman (retired), Jacobs/Sverdrup Civil, Inc., St. Louis, MO
Beverly A. Scott, General Manager and CEO, Metropolitan Atlanta Rapid Transit Authority, Atlanta, GA David Seltzer, Principal, Mercator Advisors LLC, Philadelphia, PA
Lawrence A. Selzer, President and CEO, The Conservation Fund, Arlington, VA
Kumares C. Sinha, Olson Distinguished Professor of Civil Engineering, Purdue University, West Lafayette, IN
Daniel Sperling, Professor of Civil Engineering and Environmental Science and Policy; Director, Institute of Transportation Studies; and Interim Director, Energy Efficiency Center, University of California, Davis
Kirk T. Steudle, Director, Michigan DOT, Lansing
Douglas W. Stotlar, President and CEO, Con-Way, Inc., Ann Arbor, MI
C. Michael Walton, Ernest H. Cockrell Centennial Chair in Engineering, University of Texas, Austin EX OFFICIO MEMBERS
Peter H. Appel, Administrator, Research and Innovative Technology Administration, U.S.DOT J. Randolph Babbitt, Administrator, Federal Aviation Administration, U.S.DOT
Rebecca M. Brewster, President and COO, American Transportation Research Institute, Smyrna, GA Anne S. Ferro, Administrator, Federal Motor Carrier Safety Administration, U.S.DOT
John T. Gray, Senior Vice President, Policy and Economics, Association of American Railroads, Washington, DC
John C. Horsley, Executive Director, American Association of State Highway and Transportation Officials, Washington, DC David T. Matsuda, Deputy Administrator, Maritime Administration, U.S.DOT
Victor M. Mendez, Administrator, Federal Highway Administration, U.S.DOT
William W. Millar, President, American Public Transportation Association, Washington, DC
Tara O’Toole, Under Secretary for Science and Technology, U.S. Department of Homeland Security, Washington, DC
Robert J. Papp (Adm., U.S. Coast Guard), Commandant, U.S. Coast Guard, U.S. Department of Homeland Security, Washington, DC Cynthia L. Quarterman, Administrator, Pipeline and Hazardous Materials Safety Administration, U.S.DOT
Peter M. Rogoff, Administrator, Federal Transit Administration, U.S.DOT
David L. Strickland, Administrator, National Highway Traffic Safety Administration, U.S.DOT Joseph C. Szabo, Administrator, Federal Railroad Administration, U.S.DOT
Polly Trottenberg, Assistant Secretary for Transportation Policy, U.S.DOT
Robert L. Van Antwerp (Lt. Gen., U.S. Army), Chief of Engineers and Commanding General, U.S. Army Corps of Engineers, Washington, DC Barry R. Wallerstein, Executive Officer, South Coast Air Quality Management District, Diamond Bar, CA
*Membership as of March 2011.
Abbreviations and acronyms used without definitions in TRB publications: AAAE American Association of Airport Executives
AASHO American Association of State Highway Officials
AASHTO American Association of State Highway and Transportation Officials ACI–NA Airports Council International–North America
ACRP Airport Cooperative Research Program ADA Americans with Disabilities Act
APTA American Public Transportation Association ASCE American Society of Civil Engineers ASME American Society of Mechanical Engineers ASTM American Society for Testing and Materials ATA Air Transport Association
ATA American Trucking Associations
CTAA Community Transportation Association of America CTBSSP Commercial Truck and Bus Safety Synthesis Program DHS Department of Homeland Security
DOE Department of Energy
EPA Environmental Protection Agency FAA Federal Aviation Administration FHWA Federal Highway Administration
FMCSA Federal Motor Carrier Safety Administration FRA Federal Railroad Administration
FTA Federal Transit Administration
HMCRP Hazardous Materials Cooperative Research Program IEEE Institute of Electrical and Electronics Engineers ISTEA Intermodal Surface Transportation Efficiency Act of 1991 ITE Institute of Transportation Engineers
NASA National Aeronautics and Space Administration NASAO National Association of State Aviation Officials NCFRP National Cooperative Freight Research Program NCHRP National Cooperative Highway Research Program NHTSA National Highway Traffic Safety Administration NTSB National Transportation Safety Board
PHMSA Pipeline and Hazardous Materials Safety Administration RITA Research and Innovative Technology Administration SAE Society of Automotive Engineers
SAFETEA-LU Safe, Accountable, Flexible, Efficient Transportation Equity Act: A Legacy for Users (2005)
TCRP Transit Cooperative Research Program
TEA-21 Transportation Equity Act for the 21st Century (1998) TRB Transportation Research Board
TSA Transportation Security Administration U.S.DOT United States Department of Transportation
T r a n s p o r T a T i o n r e s e a r c h B o a r d
Washington, D.C. 2011 www.tRB.orgNcFrp
RepoRt 10
Subscriber Categoriesadministration and Management · Bridges and other structures · Economics · Energy · Environment · Freight transportation · highways · Marine transportation · Motor Carriers · operations and traffic Management · Pavements · Railroads · safety and human Factors
performance Measures for
Freight Transportation
Gordon Proctor & AssociAtes
Dublin, OH
cAmbridGe systemAtics, inc.
Cambridge, MA
AmericAn trAnsPortAtion reseArch institute
Arlington, VA
stArisis corPorAtion
Lewis Center, OH
councilof suPPly chAin mAnAGement ProfessionAls
Lombard, IL
research prograM
America’s freight transportation system makes critical contributions to the nation’s economy, security, and quality of life. The freight transportation system in the United States is a complex, decentralized, and dynamic network of private and public entities, involving all modes of transportation—trucking, rail, waterways, air, and pipelines. In recent years, the demand for freight transportation service has been increasing fueled by growth in international trade; however, bottlenecks or congestion points in the system are exposing the inadequacies of current infrastructure and operations to meet the growing demand for freight. Strategic operational and investment decisions by governments at all levels will be necessary to maintain freight system performance, and will in turn require sound technical guidance based on research.
The National Cooperative Freight Research Program (NCFRP) is a cooperative research program sponsored by the Research and Innovative Technology Administration (RITA) under Grant No. DTOS59-06-G-00039 and administered by the Transportation Research Board (TRB). The program was authorized in 2005 with the passage of the Safe, Accountable, Flexible, Efficient Transportation Equity Act: A Legacy for Users (SAFETEA-LU). On September 6, 2006, a contract to begin work was executed between RITA and The National Academies. The NCFRP will carry out applied research on problems facing the freight industry that are not being adequately addressed by existing research programs.
Program guidance is provided by an Oversight Committee comprised of a representative cross section of freight stakeholders appointed by the National Research Council of The National Academies. The NCFRP Oversight Committee meets annually to formulate the research program by identifying the highest priority projects and defining funding levels and expected products. Research problem statements recommending research needs for consideration by the Oversight Committee are solicited annually, but may be submitted to TRB at any time. Each selected project is assigned to a panel, appointed by TRB, which provides technical guidance and counsel throughout the life of the project. Heavy emphasis is placed on including members representing the intended users of the research products.
The NCFRP will produce a series of research reports and other products such as guidebooks for practitioners. Primary emphasis will be placed on disseminating NCFRP results to the intended end-users of the research: freight shippers and carriers, service providers, suppliers, and public officials.
Published reports of the
naTional cooperaTive FreighT research prograM
are available from:
Transportation Research Board Business Office
500 Fifth Street, NW Washington, DC 20001
and can be ordered through the Internet at: http://www.national-academies.org/trb/bookstore
Printed in the United States of America
Project NCFRP-3 ISSN 1947-5659 ISBN 978-0-309-15557-1
Library of Congress Control Number 2011926817 © 2011 National Academy of Sciences. All rights reserved.
copYrighT inForMaTion
Authors herein are responsible for the authenticity of their materials and for obtaining written permissions from publishers or persons who own the copyright to any previously published or copyrighted material used herein.
Cooperative Research Programs (CRP) grants permission to reproduce material in this publication for classroom and not-for-profit purposes. Permission is given with the understanding that none of the material will be used to imply TRB, AASHTO, FAA, FHWA, FMCSA, FTA, RITA, or PHMSA endorsement of a particular product, method, or practice. It is expected that those reproducing the material in this document for educational and not-for-profit uses will give appropriate acknowledgment of the source of any reprinted or reproduced material. For other uses of the material, request permission from CRP.
noTice
The project that is the subject of this report was a part of the National Cooperative Freight Research Program, conducted by the Transportation Research Board with the approval of the Governing Board of the National Research Council.
The members of the technical panel selected to monitor this project and to review this report were chosen for their special competencies and with regard for appropriate balance. The report was reviewed by the technical panel and accepted for publication according to procedures established and overseen by the Transportation Research Board and approved by the Governing Board of the National Research Council.
The opinions and conclusions expressed or implied in this report are those of the researchers who performed the research and are not necessarily those of the Transportation Research Board, the National Research Council, or the program sponsors.
The Transportation Research Board of the National Academies, the National Research Council, and the sponsors of the National Cooperative Freight Research Program do not endorse products or manufacturers. Trade or manufacturers’ names appear herein solely because they are considered essential to the object of the report.
authority of the charter granted to it by the Congress in 1863, the Academy has a mandate that requires it to advise the federal government on scientific and technical matters. Dr. Ralph J. Cicerone is president of the National Academy of Sciences.
The National Academy of Engineering was established in 1964, under the charter of the National Academy of Sciences, as a parallel organization of outstanding engineers. It is autonomous in its administration and in the selection of its members, sharing with the National Academy of Sciences the responsibility for advising the federal government. The National Academy of Engineering also sponsors engineering programs aimed at meeting national needs, encourages education and research, and recognizes the superior achievements of engineers. Dr. Charles M. Vest is president of the National Academy of Engineering.
The Institute of Medicine was established in 1970 by the National Academy of Sciences to secure the services of eminent members of appropriate professions in the examination of policy matters pertaining to the health of the public. The Institute acts under the responsibility given to the National Academy of Sciences by its congressional charter to be an adviser to the federal government and, on its own initiative, to identify issues of medical care, research, and education. Dr. Harvey V. Fineberg is president of the Institute of Medicine.
The National Research Council was organized by the National Academy of Sciences in 1916 to associate the broad community of science and technology with the Academy’s purposes of furthering knowledge and advising the federal government. Functioning in accordance with general policies determined by the Academy, the Council has become the principal operating agency of both the National Academy of Sciences and the National Academy of Engineering in providing services to the government, the public, and the scientific and engineering communities. The Council is administered jointly by both Academies and the Institute of Medicine. Dr. Ralph J. Cicerone and Dr. Charles M. Vest are chair and vice chair, respectively, of the National Research Council.
The Transportation Research Board is one of six major divisions of the National Research Council. The mission of the Transporta-tion Research Board is to provide leadership in transportaTransporta-tion innovaTransporta-tion and progress through research and informaTransporta-tion exchange, conducted within a setting that is objective, interdisciplinary, and multimodal. The Board’s varied activities annually engage about 7,000 engineers, scientists, and other transportation researchers and practitioners from the public and private sectors and academia, all of whom contribute their expertise in the public interest. The program is supported by state transportation departments, federal agencies including the component administrations of the U.S. Department of Transportation, and other organizations and individu-als interested in the development of transportation. www.TRB.org
crp sTaFF For ncFrp reporT 10
Christopher W. Jenks, Director, Cooperative Research Programs Crawford F. Jencks, Deputy Director, Cooperative Research Programs William C. Rogers, Senior Program Officer
Charlotte Thomas, Senior Program Assistant Eileen P. Delaney, Director of Publications Ellen Chafee, Editor
ncFrp proJecT 3 panel
Scott R. Drumm, Port of Portland (OR), Portland, OR (Chair)
Maria P. Boile, Rutgers, The State University of New Jersey, Piscataway, NJ Thomas Crawford, Missouri Motor Carriers Association, Jefferson City, MO Rodney Gregory, Business Transformation Agency, Reston, VA
Robert James, Port Authority of New York & New Jersey, New York, NY Joseph L. Schofer, Northwestern University, Evanston, IL
Mary Lynn Tischer, Federal Highway Administration, Washington, DC Mark Johnson, FMCSA Liaison
Crystal Jones, FHWA Liaison Thomas P. Keane, FMCSA Liaison Michael Sprung, RITA Liaison Joedy W. Cambridge, TRB Liaison Martine A. Micozzi, TRB Liaison Thomas Palmerlee, TRB Liaison Ann Purdue, TRB Liaison
auThor acKnoWledgMenTs
The authors would like to acknowledge the assistance of Dr. Thomas Speh. In addition, they would like to acknowledge Mr. Nick Vlahos and Erica Witzke of Cambridge Systematics and Mr. Jeffrey Short and Katie Fender of the American Transportation Research Institute.
NCFRP Report 10: Performance Measures for Freight Transportation presents a
compre-hensive, objective, and consistent set of measures to gauge the performance of the freight transportation system. These measures are presented in the form of a Freight System Report Card, which reports information in three formats, each increasingly detailed, to serve the needs of a wide variety of users from decision makers at all levels to anyone interested in assessing the performance of the nation’s freight transportation system.
As the demand for freight transportation outstrips the capacity of the nation’s highway, rail, waterway, air, and port systems, the effects are felt as congestion, longer and less reliable transit times, upward pressure on freight prices, and higher inventory levels. These impacts increase the cost of doing business and the cost of living and result in a less productive and competitive economy. A comprehensive, objective, and consistent set of performance measures for the U.S. freight transportation system is important for assessing the condition of that system, identifying its problems, prioritizing actions to resolve those problems, and measuring the effectiveness of the remedial actions.
Under NCFRP Project 03, Gordon Proctor & Associates reviewed current work on per-formance measures, identified freight transportation perper-formance issues important to stakeholders, and, on the basis of this research, developed a framework for measuring the performance of the freight transportation system, subsystems, and components. The frame-work includes a Freight System Report Card, which is structured as a modified Balanced Scorecard and includes 29 performance measures in 6 categories. The performance mea-sures and Freight System Report Card reflect local, regional, national, and global perspec-tives and are intended to serve as a resource for a range of stakeholders, both public and private, who need to make investment, operations, and policy decisions.
By William C. Rogers
staff officer1
summary
19
Chapter 1
Research objective
19 Research Statement
19 Background on Research Need
22 Movement Toward Measurement
22 Research Approach
23 Anticipated Use of Research Findings
24 Endnotes
25
Chapter 2
Performance Measurement Lessons from the
Private sector
25 The Evolution of Private-Sector Measurement
25 From Lagging to Leading Indicators
26 From Measuring Process to Measuring Strategic Outcomes
27 From Skewing Performance to Balancing Competing Objectives
28 Learning to Support Measurement Systems
29 From Measuring Performance to Improving Performance
29 Relevance of the Private-Sector Lessons 29 Endnotes
30
Chapter 3
Performance Measurement Experience in the
Public sector
30 Migration of Performance Measures from the Private to Public Sectors
31 The Maturation of Public-Sector Performance Measurement
32 Public-Sector Logic for Selecting Measures 32 States Use Only a Handful of Freight Measures 34 Relevance of the Public-Sector Experience
34 Endnotes
35
Chapter 4
Freight Performance Measures
35 Trucking Data
35 Rail Data
36 Ports and Waterways Data
36 Highway Condition Data
36 Freight Externality Data
36 Emerging but Incomplete National Measures
37 Disjointed Data
37 Lack of Performance Data
37 Lack of Well-Defined Goals
40 Private-Sector Perspectives
41 Responses to Individual Measures
44 Public-Sector Perspectives
44 State Perspectives
45 Federal Agency Perspectives
46 Trucking Industry Perspectives
46 Railroad Industry Perspectives
47 Maritime Industry Perspectives
48 Additional Practitioners
49 Endnotes
50
Chapter 6
Data Considerations to support Performance
Measurement
50 Summary
50 Freight Data Issues
53 Case Studies
57 Data Considerations for the Freight Report Card 60 Endnotes
61
Chapter 7
Findings and Recommendations
61 A Reporting Framework Is Possible
61 Overcoming Impediments
62 Creating a Coalition
65
Appendix A
summaries of Freight Performance information
for national Report Card Performance
summaries
97
Appendix B
statewide and Metropolitan Freight
Performance Metrics Examples
113
Appendix C
state-Level Freight Performance Measures:
state of Practice
117
Appendix D
national-Level Performance Measures:
state of Practice
121
Appendix E
Modal Freight Performance Measures:
state of Practice
133
Appendix F
Environmental Freight Performance Measures:
state of Practice
s U m m a r Y
Performance Measures for
Freight transportation
The objective of the research on which this report was based was to develop measures to gauge the performance of the U.S. freight transportation system. The measures as sought in the project statement are intended to support investment, operations, and policy decisions by a range of stakeholders, both public and private. The measures also are intended to reflect local, regional, national, and global perspectives. The project’s areas of emphasis include effi-ciency, effectiveness, capacity, safety, security, infrastructure condition, congestion, energy, and the environment.
The breadth and scope of the project’s objective reflect the breadth and scope of the national freight system. The U.S. freight system serves the world’s largest economy. The freight system spans the 24 million square miles of the North American continent while linking it to international markets. The freight system comprises not only 4 million miles of public roads, 140,000 miles of railways, 360 commercial airports, and a 12,000-mile marine transportation system. It also consists of trucking firms, railroad companies, and maritime and aviation companies and the public agencies that both serve and regulate them. Each of the nation’s diverse 6.2 million employers relies on some aspect of the freight system, some for their entire livelihood. This research documents that the interests of stakeholders in freight performance measurement are as diverse as are the stakeholders themselves.
The project’s emphasis upon measuring efficiency, safety, security, infrastructure condi-tion, energy, and the environment reflects society’s cross-cutting and countervailing con-cerns about freight. Producers and shippers are most concerned about travel times, travel reliability, and travel costs. Other sectors of society primarily are concerned about freight externalities. Externality concerns are evident in national programs to measure and con-trol freight emissions, hazardous material releases, and accidents involving trucks or trains. Another set of concerns addresses the control of certain types of freight shipments. Trade agreements regulate imports. Concerns over agricultural pests and food safety lead to control of agricultural imports. Illicit and unapproved drugs are controlled at the borders. Imports of firearms, explosives, and nuclear material are closely regulated. Society’s concerns about the freight system span not only the system’s efficiency at moving goods but also society’s ability to reduce externalities and to regulate undesirable movements.
To address the project’s ambitious agenda, and recognizing the lack of resources to create a new national freight data reporting structure, the project recommends creation of a Freight System Report Card that relies upon existing sources. To reduce the cost of performance measurement, the project bases it primarily upon existing federal data and proposes to link the data through a Web-based application to more detailed explanatory reports. In this way, the proposed Freight System Report Card can be succinct but also detailed.
The report card is proposed to be structured as a modified “Balanced Scorecard,”1 which reports freight performance measures in six categories. These categories allow for the full
complexities and difficult tradeoffs of freight performance to be evident. Those six areas are: freight demand, freight efficiency, freight system condition, freight environmental impacts, freight safety, and the adequacy of investment in the freight system. The format of the Freight System Report Card and the categories of measures within it are predicated upon several critical findings from this research.
• First, successful performance measurement systems tend to provide summary, “at a glance” compilations of performance, while also linking to detailed reports that allow users to “drill down” into performance.2,3,4
• Second, successful performance measurement systems reflect a broad array of performance concerns, not just certain narrow areas. The Balanced Scorecard has become popular in per-formance measurement circles because it portrays broad, competing values so that the balanc-ing of competbalanc-ing interests is evident.
• Third, successful performance measurement systems require an architecture. That is, they need data protocols, common definitions, taxonomies, agreed reporting cycles, quality control/ quality improvement processes, and common consensus among users as to the accuracy and efficacy of the measurement system and the data it uses.5
• Fourth, most performance measurement systems are evolutionary. Most developers of per-formance measurement systems “begin with what they have.” The systems tend to mature and evolve over time, sometime over decades.
• Fifth, although a comprehensive freight performance measurement system does not exist, im-portant aspects of freight performance are available in federal data sources. These data sources are predominantly available regarding highway and waterway infrastructure condition, freight volumes, and freight externalities such as air emissions and crashes.
• Sixth, private-sector trade associations often produce robust freight performance metrics that can augment the public agency metrics.
• Seventh, there is no one agency or entity that has the mandate or resources to develop and sustain a comprehensive freight performance measurement system. Many individual agencies and private-sector trade organizations measure components of freight system performance, but no one agency cuts across the numerous silos to compile a comprehensive reporting sys-tem. Therefore, the recommended framework seeks to capture from existing federal and pri-vate sources the existing performance measurement information that does exist.
An important caveat to the report card is that not all of its metrics qualify as performance measures. The Government Accountability Office (GAO) defines performance measure-ment as
the ongoing monitoring and reporting of program accomplishments, particularly progress towards
pre-established goals. Performance measures may address the type or level of program activities conducted
(pro-cess), the direct products and services delivered by a program (outputs), and/or the results of those
prod-ucts and services (outcomes).6 [emphasis added]
There are no programs or goals for important aspects of freight performance such as growth in freight volumes, changes in mode split, or travel time reliability. Several of the included metrics are necessary to track important trends, such as freight volume growth. Mixed within the report card are some true performance measures and some more general indicators of freight trends.
Freight performance measurement is challenged by both an overwhelming abundance of data and by a lack of complete data for many important freight system performance functions. Sorting and selecting from the voluminous federal data sources is one daunting
challenge for freight performance measurement. Closing data gaps is another. Data about infrastructure condition are more available than are data for freight system performance. For instance, data for the condition of bridges and pavements have long been available. Data about highway truck travel speeds are just becoming widely available. Systematic data regarding multimodal freight performance are practically nonexistent.
Although freight system performance data are incomplete, information regarding freight system externalities is available. It is possible to measure significant components of the freight system’s contribution to crashes, air emissions, and greenhouse gas emissions. In fact, the data regarding externalities appear to be among the most comprehensive, well defined, and granular of the freight data. The presence of targets and performance-measurement architecture in federal safety and air quality programs partially explains the comprehensive-ness of performance data for them. As a corollary, the lack of national freight system perfor-mance programs, perforperfor-mance goals, or targets partially explains the lack of freight system performance data.
The various metrics within the Freight System Report Card were selected after a review of 360 potential freight performance measures. The voluminous set of potential measures was screened on the basis of surveys of public- and private-sector freight stakeholders, by the quality of data to support the measures, and by their relevance to the project objec-tives. In general, the public-sector stakeholders were interested in less frequently updated measures to assist with policy, planning, and investment decisions. Private-sector stake-holders were interested in more continuously available measures to make daily operational decisions. Public-sector stakeholders were interested in policy and infrastructure issues, whereas private-sector stakeholders were more interested in cost, reliability, and travel time measures. Two-thirds of private-sector respondents indicated that they never sought government-provided freight performance measures.
Several major impediments confront a national freight performance measurement sys-tem. First, no apparent agency or entity currently exists with the resources to independently develop, staff, and sustain a new, comprehensive freight performance measurement system that addresses all the issues raised in the NCFRP 03 problem statement. Second, the data needs are enormous to address all nine performance areas described in the research state-ment at the local, regional, national, and global levels for policy, investstate-ment, and operations. No national infrastructure exists to define, collect, scrub, and deploy such comprehensive data. Third, the lack of national goals or strategies obfuscates priorities for measurement. Fourth, there is less than complete consensus as to how measures should be used. Some favor their use for making policy and investment decisions, while others are concerned that standard national measures will obscure important local considerations and skew policy and investment decisions.
To overcome these constraints, the research report recommends creation of a first- generation Freight System Report Card that relies primarily upon existing freight perfor-mance reports. The reliance upon existing reports partially overcomes the lack of an agency and budget to generate a new measurement process. It also reduces the time, cost, and complexity of implementing a reporting system. The existing reports that are selected for the report card generally already have a supporting architecture. These reports result from mature processes that include taxonomies, data protocols, quality assurance processes, and an ongoing support structure. The population of the report card would require additional effort because the data producers would need to contribute their data to the report card. However, the level of effort would be orders of magnitude less than that of creating new measures. Models of such cooperation exist already with the seven Class I railroads contrib-uting to common performance reports and the states in Australia and the nation of New
Zealand contributing to an Austroads performance website and to emerging efforts by the state transportation agencies to jointly identify performance metrics.
The framework seeks to simplify the enormous complexity of measuring the U.S. freight network by focusing primarily upon the disproportionate importance of key freight net-work components, such as the Interstate and National Highway systems, the Class I rail-roads, and the top 20 U.S. ports.
Finally, the framework is proposed to address a key requirement of performance report cards. They need to provide front-page “at a glance” summaries that provide busy executives with a succinct and instantaneous assessment of performance. However, the framework also needs to allow the user to drill into details to answer more nuanced questions, or to explore trends in further detail. The framework is heavily weighted toward inclusion of composite measures that provide both brevity and insight. The composite measures summarize trends but also can be disaggregated for drilling down into the factors that contribute to the per-formance.
In addition, the report card is proposed to function in a three-tiered fashion intended to serve the various levels of detail required by users. A governor or legislator can be served with highly consolidated, trend line information. A metropolitan planning organization (MPO) board member, a department of transportation (DOT) senior executive, or an inquisitive reporter may seek more detailed information. A DOT staff person, an academic researcher, or a logistics provider requires even more detail. The framework is envisioned to address the increasingly detailed information needs of all three levels of users. It provides varying degrees of insight by having a highly summarized Freight Transportation Report Card, a summary report for each measure in the report card, and a link to a much more compre-hensive report that can explain the context of each measure. In this way, the report card is intended to be both succinct and insightful, as illustrated in Figure S.1.
The key in Figure S.2 includes four different colors of indicators used in the report card. The need for multiple indicators is reflective of freight’s complexity. Some decreases are posi-tive, such as decreases in emissions. Some increases are negaposi-tive, such as increases in crashes. Other changes could be considered either positive or negative depending upon the stake-holder’s viewpoint. Increases or decreases in freight volumes are shown in black, indicating their change could be viewed as either positive or negative depending upon the stakeholder’s perspective. Changes in red clearly are negative, such as increases in freight-related fatalities. The report card attempts to illustrate trends but also whether those trends are positive or
5 Performance Measure 10 Year
Trend Analysis 20 Year Forecast Freight Demand Measures, All Modes Despite declines in the past 18 months, steady growth in freight volumes occurred over the past 10 years. Future long-term growth of 2-3 % annually for 20 years is
likely as the economy improves.
Truck Freight Volumes Truck freight grew at 2 to 3% annually in the past decade, except in the past 18 months. Future 2-3% growth is predicted when the economy improves to historic levels
Rail Freight Volumes Rail freight volumes steadily grew in the 2000s until the recent recession. Long-term rail freight volumes are predicted to continue growing with an economic rebound.
Inland Water Freight Volumes Inland water traffic growth is expected to remain at relatively low rates of 1% to 1.5% through 2035, the rate of growth for the past 10 years.
Containerized Waterborne Freight Volumes Containerized freight volumes grew rapidly in the past decade until 2008 when they sharply. Long-term growth is likely to resume to previously robust levels with improvement in the global economy.
Interstate Highway Speeds
A near doubling of traffic volumes in the past 25 years has slowed peak hour speeds in most urban areas. Long-term traffic growth is likely to continue to outpace physical or operational improvements to the Interstate System. As a result, travel speeds are likely to continue declining.
Travel speeds at top Interstate Highway Bottlenecks Rising traffic volumes combined with a low rate of investment is likely to result in slower travel speeds and increased delays at the nation’s top Interstate Highway Bottlenecks.
Class I RR Operating Speed Operating speeds at Class I railroads have remained stable for the past decade. The RRs warn of long-term congestion and delay if investment levels are not increased.
Cost of Logistics as a Percent of GDP After decades of decline, logistics as a cost of GDP appears to be tracking upward.
NHS Pavement Conditions
Approximately 50 percent of the NHS pavement conditions are in ‘Good’ condition, representing improvement over the past decade. However, higher costs and uncertain funding levels create uncertainty whether those relatively low levels can be sustained.
NHS Bridge Conditions
Structural deficiencies on the NHS have declined by 40 percent in recent decades and were forecast to continue improving. However, dramatically higher material prices in the past two years and uncertain funding levels threaten the long-term improvement that had been expected.
Freight-Produced Greenhouse Gas Emissions (GHE) Freight-produced Greenhouse Gas Emissions are expected to rise commensurate with the increase in truck, rail, and water freight volumes. Current emission technology does not control vehicular GHE.
Truck Greenhouse Gas Emissions Truck-related GHE are predicted to rise steadily with a projected 30% increase in vehicle miles traveled by 2030.
Rail Greenhouse Gas Emissions Rail GHE steadily increased from 1990 to 2005 but leveled off because of declining rail volumes and cleaner locomotives.
Freight-Produced Ozone-Related Emissions Ozone precursors from trucks have declined dramatically in recent years and are predicted to continue to decline as cleaner vehicles replace current ones and as the benefits of cleaner fuels are realized.
Truck-related VOCs These ozone-contributing emissions produced by trucks have fallen dramatically because of cleaner fuels, and vehicles.
Truck-related Nitrogen Oxide (NOX) emissions Truck-generated NOX emissions are forecast to fall 82 percent from 2002 levels by 2020 because of cleaner fuels and vehicles.
Rail NOX Emissions The elimination of sulfur from fuel and introduction of cleaner locomotives are expected to reduce RR NOX emissions by 41% by 2020 and by 83% by 2040.
Rail VOC Emissions The same fuel and locomotive changes are forecasted by USEPA to reduce per-gallon diesel emissions of VOCs by 60% by 2020 and by 88% by 2040
Truck Particulate Emissions Cleaner low-sulfur fuel and cleaner engine technology are predicted to lead to an 82% reduction in combination truck particulate emissions.
Ship produced NOX and PM Similar fuel and engine improvements are required for US-flagged merchant vessels. Both PM and NOX emissions are predicted to decline significantly through 2040 on a per-gallon basis.
System Condition Measures Environmental Condition Measures
Freight Demand Measures
System Efficiency Measures
Figure S.1. Tiers of reporting from general and summarized to highly detailed and granular.
The key in Figure S.2 includes four different colors of indicators used in the report card. The need for multiple indicators is reflective of freight’s complexity. Some decreases are positive, such as decreases in emissions. Some increases are negative, such as increases in crashes. Other changes could be considered either positive or negative depending upon the stakeholder’s viewpoint. Increases or decreases in freight volumes are shown in black, indicating their change could be viewed as either positive or negative depending upon the stakeholder’s perspective. Changes in red clearly are negative, such as increases in freight-related fatalities. The report card attempts to illustrate trends but also whether those trends are positive or negative. Admittedly,
stakeholders with strong positions may disagree with the characterization. For instance, advocates for one mode may see increases in freight volumes for another mode as negative. The formatting is oriented to a centrist, public-sector viewpoint.
Trend lines also are emphasized in the report card to provide additional context regarding how performance has changed over time, or how it is likely to unfold into the future.
As noted in Figure S.1, accompanying the report card are summaries that elaborate on each performance metric. Following the report card, below, is a representative summary for the cost of logistics as a percentage of gross domestic product. That summary defines and further elaborates upon the measure. The summary also includes references to even more detailed information that may be of interest to a more
Black arrows indicate trends which are not necessarily positive or negative, such as growth in freight volumes.
Green arrows indicate trends which are benign. They can be either downward trends, such as a decrease in crashes or upward, such as increased levels of investment.
Yellow arrows indicate performance which is not clearly positive and which may be indicative of future problems.
Red arrows indicate negative trends, which can either be increasing, such as emissions, or decreasing, such as the adequacy of investment.
Key
Figure S.2 Report card key
Figure S.1. Tiers of reporting from general and summarized to highly detailed and granular.
5
negative. Admittedly, stakeholders with strong positions may disagree with the characteriza-tion. For instance, advocates for one mode may see increases in freight volumes for another mode as negative. The formatting is oriented to a centrist, public-sector viewpoint.
Trend lines also are emphasized in the report card to provide additional context regarding how performance has changed over time, or how it is likely to unfold into the future.
As noted in Figure S.1, accompanying the report card are summaries that elaborate on each performance metric. Following the report card (see Figure S.3) is a representative sum-mary for the cost of logistics as a percentage of gross domestic product (see Figure S.4). That summary defines and further elaborates upon the measure. The summary also includes ref-erences to even more detailed information that may be of interest to a more demanding user. In this example, the link is to the full report by the Council of Supply Chain Management Professionals (CSCMP) that examines the inputs into the 2009 analysis of logistics costs as a percentage of the nation’s gross domestic product. The three-tiered structure addresses the project statement’s requirement that the framework appeal to decision makers and users at various levels.
Freight Performance Indices and Measures
The report card attempts to balance the tension between users desiring a wide array of measures and the potentially crippling cost and complexity of sustaining a massive measure-ment process. The score card relies on only six categories and 29 measures. However, most are composite measures that can be broken down into their component elements for greater understanding of performance. The data often can be broken down into categories, or into geographic regions and, in some cases, to corridors, links, and nodes. The composite nature is an attempt to provide both “at a glance” summation while also accommodating detailed deconstruction of underlying trends, factors, and performance.
Links to Source Documents
In the proposed Freight System Report Card, this summary would be linked to the source document, in this case the CSCMP 2010 State of Logistics Report. The links to source docu-ments provide the greater detail and context that some readers would desire.
The complete set of explanatory summaries is included in Appendix F.
5 Truck Freight Volumes months. Future 2-3% growth is predicted when the economy improves to historic levels
Rail Freight Volumes Rail freight volumes steadily grew in the 2000s until the recent recession. Long-term rail freight volumes are predicted to continue growing with an economic rebound.
Inland Water Freight Volumes Inland water traffic growth is expected to remain at relatively low rates of 1% to 1.5% through 2035, the rate of growth for the past 10 years.
Containerized Waterborne Freight Volumes Containerized freight volumes grew rapidly in the past decade until 2008 when they sharply. Long-term growth is likely to resume to previously robust levels with improvement in the global economy.
Interstate Highway Speeds
A near doubling of traffic volumes in the past 25 years has slowed peak hour speeds in most urban areas. Long-term traffic growth is likely to continue to outpace physical or operational improvements to the Interstate System. As a result, travel speeds are likely to continue declining.
Travel speeds at top Interstate Highway Bottlenecks Rising traffic volumes combined with a low rate of investment is likely to result in slower travel speeds and increased delays at the nation’s top Interstate Highway Bottlenecks.
Class I RR Operating Speed Operating speeds at Class I railroads have remained stable for the past decade. The RRs warn of long-term congestion and delay if investment levels are not increased.
Cost of Logistics as a Percent of GDP After decades of decline, logistics as a cost of GDP appears to be tracking upward.
NHS Pavement Conditions
Approximately 50 percent of the NHS pavement conditions are in ‘Good’ condition, representing improvement over the past decade. However, higher costs and uncertain funding levels create uncertainty whether those relatively low levels can be sustained.
NHS Bridge Conditions
Structural deficiencies on the NHS have declined by 40 percent in recent decades and were forecast to continue improving. However, dramatically higher material prices in the past two years and uncertain funding levels threaten the long-term improvement that had been expected.
Freight-Produced Greenhouse Gas Emissions (GHE) Freight-produced Greenhouse Gas Emissions are expected to rise commensurate with the increase in truck, rail, and water freight volumes. Current emission technology does not control vehicular GHE.
Truck Greenhouse Gas Emissions Truck-related GHE are predicted to rise steadily with a projected 30% increase in vehicle miles traveled by 2030.
Rail Greenhouse Gas Emissions Rail GHE steadily increased from 1990 to 2005 but leveled off because of declining rail volumes and cleaner locomotives.
Freight-Produced Ozone-Related Emissions Ozone precursors from trucks have declined dramatically in recent years and are predicted to continue to decline as cleaner vehicles replace current ones and as the benefits of cleaner fuels are realized.
Truck-related VOCs These ozone-contributing emissions produced by trucks have fallen dramatically because of cleaner fuels, and vehicles.
Truck-related Nitrogen Oxide (NOX) emissions Truck-generated NOX emissions are forecast to fall 82 percent from 2002 levels by 2020 because of cleaner fuels and vehicles.
Rail NOX Emissions The elimination of sulfur from fuel and introduction of cleaner locomotives are expected to reduce RR NOX emissions by 41% by 2020 and by 83% by 2040.
Rail VOC Emissions The same fuel and locomotive changes are forecasted by USEPA to reduce per-gallon diesel emissions of VOCs by 60% by 2020 and by 88% by 2040
Truck Particulate Emissions Cleaner low-sulfur fuel and cleaner engine technology are predicted to lead to an 82% reduction in combination truck particulate emissions.
Ship produced NOX and PM Similar fuel and engine improvements are required for US-flagged merchant vessels. Both PM and NOX emissions are predicted to decline significantly through 2040 on a per-gallon basis.
System Condition Measures Environmental Condition Measures
System Efficiency Measures
Figure S.1. Tiers of reporting from general and summarized to highly detailed and granular.
The key in Figure S.2 includes four different colors of indicators used in the report card. The need for multiple indicators is reflective of freight’s complexity. Some decreases are positive, such as decreases in emissions. Some increases are negative, such as increases in crashes. Other changes could be considered either positive or negative depending upon the stakeholder’s viewpoint. Increases or decreases in freight volumes are shown in black, indicating their change could be viewed as either positive or negative depending upon the stakeholder’s perspective. Changes in red clearly are negative, such as increases in freight-related fatalities. The report card attempts to illustrate trends but also whether those trends are positive or negative. Admittedly,
stakeholders with strong positions may disagree with the characterization. For instance, advocates for one mode may see increases in freight volumes for another mode as negative. The formatting is oriented to a centrist, public-sector viewpoint.
Trend lines also are emphasized in the report card to provide additional context regarding how performance has changed over time, or how it is likely to unfold into the future.
As noted in Figure S.1, accompanying the report card are summaries that elaborate on each performance metric. Following the report card, below, is a representative summary for the cost of logistics as a percentage of gross domestic product. That summary defines and further elaborates upon the measure. The summary also includes references to even more detailed information that may be of interest to a more
Black arrows indicate trends which are not necessarily positive or negative, such as growth in freight volumes.
Green arrows indicate trends which are benign. They can be either downward trends, such as a decrease in crashes, or upward, such as increased levels of investment.
Yellow arrows indicate performance which is not clearly positive and may be indicative of future problems.
Red arrows indicate negative trends, that can either be increasing, such as emissions, or decreasing, such as the adequacy of investment.
Key
Figure S.2 Report card key
Performance Measure 10Trend-Year Analysis Forecast20-Year
Freight Demand Measures, All Modes Despite declines in the past 18 months, steady growth in freight volumes occurred over the past 10 years. Future long-term growth of 2-3 % annually for 20 years is likely as the economy improves.
Truck Freight Volumes Truck freight grew at 2 to 3% annually in the past decade, except in the past 18 months. Future 2-3% growth is predicted when the economy improves to historic levels
Rail Freight Volumes Rail freight volumes steadily grew in the 2000s until the recent recession. Long-term rail freight volumes are predicted to continue growing with an economic rebound. Inland Water Freight Volumes Inland water traffic growth is expected to remain at relatively low rates of 1% to 1.5% through 2035, the rate of growth for the past 10 years. Containerized Waterborne Freight Volumes Containerized freight volumes grew rapidly in the past decade until 2008sharply declined. Long-term growth is likely to resume to previously robust levels , when they
with improvement in the global economy.
Interstate Highway Speeds
A near doubling of traffic volumes in the past 25 years has slowed peak-hour speeds in most urban areas. Long-term traffic growth is likely to continue to outpace physical or operational improvements to the Interstate System. As a result, travel speeds are likely to continue declining.
Travel speeds at top Interstate Highway Bottlenecks Rising traffic volumes combined with a low rate of investment slower travel speeds and increased delays at the nation’s top Interstate Highway are likely to result in Bottlenecks.
Interstate Highway Reliability
Definitive Interstate Highway System reliability data do not exist for the past decade. However, increases in traffic volumes and freight volumes are well documented and extensive localized data indicate that travel on urban Interstate highways has become less reliabile. ATRI reliability measurement on 25 Interstate corridors indicates variability in reliability on congested urban segments, with future traffic volumes expected to increase. It is reasonable to assume that reliability will worsen if current trends continue.
Class I RR Operating Speed Operating speeds at Class I railroads have remained stable for the past decade. The RRs warn of long-term congestion and delay if investment levels are not increased.
Cost of Logistics as a Percent of GDP After decades of decline, logistics as a cost of GDP has become more uncertain. It rose in the mid-2000s but fell signficantly with the recession of 2008. The decline was due to unsustainable conditions such as freight prices falling below costs.
NHS Pavement Conditions
Approximately 50% of the NHS pavement conditions are ‘Good’, representing improvement over the past decade. However, higher costs and uncertain funding levels create uncertainty whether those relatively low levels can be sustained.
NHS Bridge Conditions
Structural deficiencies on the NHS have declined by 40% in recent decades and were forecast to continue improving. However, dramatically higher material prices in the past two years and uncertain funding levels threaten the long-term improvements that had been achieved.
Freight Demand Measures
System Efficiency Measures
System Condition Measures
Figure S.3. The Freight System Report Card.
Balancing Competing Objectives
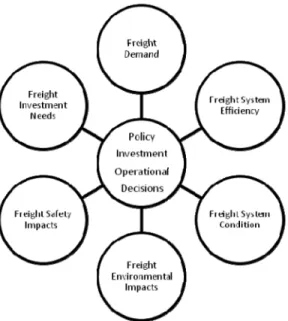
Reflecting the diverse and often competing interests in freight measurement, the report card is set up similar to a Balanced Scorecard. The Balanced Scorecard is a performance measurement system that includes measures that reflect the tensions that exist for decision making. Instead of focusing on a few narrow measures, the scorecard juxtaposes measures of competing values, such as freight efficiency and freight externalities. Normally, Balanced Scorecards have four components that balance metrics for finances, internal processes, cus-tomer satisfaction, and the institution’s ability to learn and innovate. Reflecting the complex nature of the U.S. freight system, the proposed report card has six categories. They are freight demand, freight efficiency, freight system condition, freight environmental impacts, freight safety, and the adequacy of investment in the freight system, as seen in Figure S.5. These cat-egories respond to the original research statement and reflect commonly expressed interests of stakeholders.
A similar logic led to a preference given to composite measures. Composite measures consist of an aggregation of data, such as combined speed on the Interstate Highway System. The overview, composite measure can be disaggregated, or “drilled into,” in order to exam-ine the performance of the constituent highway links. The use of composite measures was Figure S.3. The Freight System Report Card.
emphasized to respond to the project objective of having measures that allow for analysis at national, state, and regional levels. Generally, measures based upon inventories allow for granular analysis, whereas those based on estimates do not.
The report card also is proposed to include trend lines of future performance, or leading indicators, in addition to retrospective measures. Most performance measurement systems begin with lagging indicators, but users have consistently grown dissatisfied with backward-looking trends alone. Leading indicators are important for policy and investment decisions. For instance, the indicators within the Report Card forecast that national emission targets for ozone-causing nitrogen oxide (NOx) and volatile organic compounds (VOCs) are on track to be met. However, greenhouse gases (GHG) emissions are forecast to increase sig-nificantly if current trends continue. Such information could well indicate that traditional emission strategies to control harmful ozone precursors are working, while society has yet to develop an effective GHG strategy for freight. Likewise, the leading indicators that forecast that overall freight volumes are to increase for highways, railways, ports, and intermodal
8
Performance Measure 10 Year Trend Analysis Forecast20 Year
Freight-Produced Greenhouse Gas Emissions (GHE) Freight-produced greenhouse gas emissions are expected to rise commensurate with the increase in truck, rail, and water freight volumes. Current emission technology does not control vehicular GHE.
Truck Greenhouse Gas Emissions Truck-related GHG are predicted to rise steadily with a projected 30% increase in vehicle miles traveled by 2030. Rail Greenhouse Gas Emissions Rail GHG steadily increased from 1990 to 2005 but leveled off because of declining rail volumes and cleaner locomotives. Freight-Produced Ozone-Related Emissions Ozone precursors from trucks have declined dramatically in recent years and are predicted to continue to decline as cleaner vehicles replace current ones and as the
benefits of cleaner fuel are realized.
Truck-related VOCs These ozone-contributing emissions produced by trucks have fallen dramatically because of cleaner fuels, and vehicles. Truck-related Nitrogen Oxide (NOX) emissions Truck-generated NOx emissions are forecasted to fall 82% from 2002 levels by 2020 because of cleaner fuels and vehicles. Rail NOX Emissions The elimination of sulfur from fuel and introduction of cleaner locomotives are expected to reduce RR NOx emissions by 41% by 2020 and by 83% by 2040. Rail VOC Emissions The same fuel and locomotive changes are forecasted by USEPA to reduce per-gallon diesel emissions of VOCs by 60% by 2020 and by 88% by 2040. Truck Particulate Emissions Cleaner low-sulfur fuel and cleaner engine technology are predicted to lead to an 82% reduction in combination truck particulate emissions. Ship produced NOX and PM Similar fuel and engine improvements are required for U.S.-flagged merchant vessels. Both PM and NOx emissions are predicted to decline significantly through
2040 on a per-gallon basis.
Truck Injury and Fatal Crashes
Between 1988 and 2007, the large truck injury crash rate decreased from 67.9 to 31.8 per million miles traveled. The 2007 rate is the lowest on record. The large truck fatal crash rate has also declined. In 2007, this rate was 1.85, down from a peak of 5.21 in 1979. The 2007 rate is the lowest rate on record.
Highway/Rail At-Grade Crashes Between 1998 and 2008 the number of incidents at RR crossings involving both vehicles and pedestrians declined 32%. Nearly 2,400 annual incidents still occur, with 289 deaths in 2008.
Estimated Investment in NHS to Sustain Conditions
The 2004 FHWA Condition and Performance Report indicated that then-current investment levels were adequate to sustain most NHS conditions. However, since then construction costs increased significantly and funding for the federal highway program remains undecided.
Rail Freight Industry Earning Cost of Capital The Cost of Capital for the Class I railroads has steadily declined, which is a positive economic trend for them. Lower Cost of Capital reflects lower costs to acquire capital to improve the rail network.
Estimated Rail Capital Investment to Sustain Market Share
A rail industry analysis concluded that the Class I RRs need to increase capital investment in expansion to sustain market share. Their ability to raise sufficient investment capital is not definite and may not be sufficient to sustain market share. Inland Waterway Investment to Sustain Lock and
Dam Average Age at Less than 50 Years
The average age of locks on the inland waterways system is estimated to be in excess of 51 years. Current expenditure levels do not appear to be sufficient to improve that average age.
Environmental Condition Measures
Freight Safety Measures
System Investment Measures