Athens Institute for Education and Research
ATINER
ATINER's Conference Paper Series
WAT2015-1706
David Ayala-Cabrera
PhD Student
Technical University of Valencia
Spain
Silvia J. Ocana-Levario
PhD Student
Technical University of Valencia
Spain
Joaquin Izquierdo
Professor
Technical University of Valencia
Spain
Rafael Perez-Garcia
Professor
Technical University of Valencia
Spain
3D Representation of (Buried) Water
Supply Elements using Pre-Processed GPR
An Introduction to
ATINER's Conference Paper Series
ATINER started to publish this conference papers series in 2012. It includes only the papers submitted for publication after they were presented at one of the conferences organized by our Institute every year. This paper has been peer reviewed by at least two academic members of ATINER.
Dr. Gregory T. Papanikos President
Athens Institute for Education and Research
This paper should be cited as follows:
Ayala-Cabrera, D., Ocana-Levario, S. J., Izquierdo, J. and Perez-Garcia, R.
(2015). "3D Representation of (Buried) Water Supply Elements using
Pre-Processed GPR Images", Athens: ATINER'S Conference Paper Series, No:
WAT2015-1706.
Athens Institute for Education and Research
8 Valaoritou Street, Kolonaki, 10671 Athens, Greece
Tel: + 30 210 3634210 Fax: + 30 210 3634209 Email: [email protected] URL: www.atiner.gr
URL Conference Papers Series: www.atiner.gr/papers.htm
Printed in Athens, Greece by the Athens Institute for Education and Research. All rights reserved. Reproduction is allowed for non-commercial purposes if the source is fully acknowledged.
ISSN: 2241-2891 17/11/2015
3D Representation of (Buried) Water Supply Elements
using Pre-Processed GPR Images
David Ayala-Cabrera Silvia J. Ocana-Levario
Joaquin Izquierdo Rafael Perez-Garcia
Abstract
In this paper, a ground penetrating radar (GPR) is used as a non-destructive method to assess the buried elements of water supply systems (WSSs). The aim is the detection of various pipe materials (such as plastic and metallic, among others), and the identification of other important aspects (e.g. water leakage). This work seeks to use the visualization advantages of the subsoil characteristics provided by pre-processed GPR images. These features, which are represented as anomalies into the images, are extracted and merged to generate 3D models. The 3D representations obtained facilitate elucidation by personnel non-highly skilful in the interpretation of data from non-destructive techniques. The work is performed on GPR images of WSS pipes taken from strategic locations of urban environments. The goal is to promote the use of these technologies in the WSSs intended to generate relevant information that allows the adequate and dynamic technical management of these systems. The results and analyses are presented in this paper.
Keywords: GPR image interpretations, ground penetrating radar,
non-destructive methods, urban environments, Water supply systems elements
Acknowledgments: Part of this work has been developed under the support of
an FPI-UPV scholarship granted to the first author by the Programa de Ayudas de Investigación y Desarrollo (PAID) of the Universitat Politècnica de València. Additionally, we wish to thank the AQUARUM consortium for their help in field data capturing.
Introduction
Knowledge of the layout and the characteristics (condition, age, for example) of the components (pipes, valves, etc.) of water supply systems (WSSs) is essential for the efficient and dynamic management of these systems. This knowledge is crucial to achieving such objectives of the technical management of WSSs as: identification of illegal connections, leak detection and water control, simulation and operation of networks, study of the evolution of pollutants in networks, maintenance planning, rehabilitation and renovation of WSS components, among others. This way non-destructive methods become important in the inspection of components of WSSs, seeking to minimize the social and economic impacts derived from most commonly used methods (e.g., excavation). Selection of the ground penetrating radar (GPR) in this paper was carried out after considering its characteristics as a non-destructive method to detect layouts and characteristics of metallic and non-metallic pipe materials. Additionally, this method allows the recognition of other characteristics of WSSs, such as water leaks (Ayala-Cabrera et al., 2013b).
The evaluation of GPR tests using 3D analysis for the detection of objects is a fairly common activity in various fields, for example, (Dyana et al., 2012) in the detection of landmines; (Peña et al., 2013) for the visualization of stratified archaeological excavations; civil engineering also finds some examples in the calibration of measurements in bridges (Heikkilä et al., 2010), among others. In these scenarios, volumes, on which profiles are taken, either in depth or surface layers, are built. Subsequently, interpretations on these volumes or profiles are performed, eventually producing reconstruction. However, this process is complex and adds, to the already considerable difficulty of interpretation, the computational cost of managing the large amount of data usually produced by GPR surveys. In this paper, we perform interpretations directly on the profiles captured and, subsequently, generate 3D models. This seeks to simplify the process of building the interpretations of GPR, reducing the change of dimensions and determining it as a mapping from 2D to 3D. This requires the pre-processing of the data and two subsequent additional processes of information management. The results of both processes are combined in a single picture, thus bounding the space to interpret each image. The aim is to favor the selection and removal of objects that will be represented by 3D models.
The main contribution of this work is to evaluate the feasibility of generating 3D models from GPR images in urban environments. We thus stress the importance of advancing research into automatic GPR image interpretation. This tries to promote the understanding of soil characteristics evaluated by personnel not highly qualified in the use of non-destructive techniques.
Proposed Methodology for GRP Image Interpretations
The GPR operation is based on the emission of electromagnetic pulses from the soil surface propagating therein and reflected in the discontinuities found in the trajectories. The response of the medium to the signals, captured at certain times, is called trace. The trace shows the electromagnetic characteristics of the medium. The successive accumulation of these traces generates the so-called radargrams. The visualization of these radargrams is usually performed by applying colour scales (typically grey-scale), thus generating GPR images. This last point is of particular interest here, because our analysis is performed by taking this classification as the starting point. The analysis in this section is based on the temporal variable. Firstly, the peak (both maximum and minimum) values of the generated waves contained in the GPR images are extracted. Then, the tendency of each trace is studied and the time average value between peak and peak is recorded. The basic principle is that, assuming the soil is homogeneous, the successive peaks are in correspondence. However, it should be noted that, although the material is homogeneous, in reality the measured values are different although very close together. In this way, too different values point to anomalies.
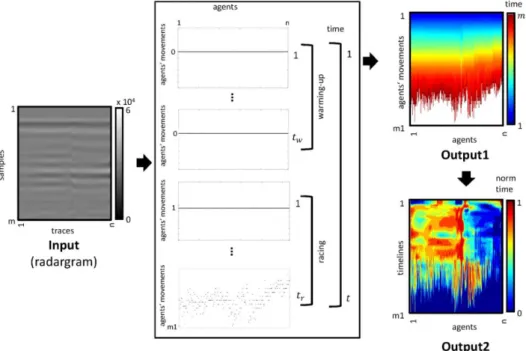
The pre-process of the GPR images used in this document was first proposed by (Ayala-Cabrera et al., 2013a) and was called race of agents. The algorithm is based on the game theory and uses the multi-agent paradigm (Shoham et al., 2009). The input to this algorithm is the resultant radargram of the GPR survey, which consists of a matrix of the size m × n. The n traces generated in the survey are used in this work as parallel tracks for the n agents to run. The race is a test of endurance for the agents. The prize for each agent is a move forward for every effort performed. Efforts are based on wave amplitude values in each column of the matrix (radargram). The race consists of two phases: a) warming-up and b) competition. The race take a time t = tw +
tr = m, where tw is the warming-up time and tr the competition time. The movements of the agents in tr are conditioned by the reversal of the wave amplitude on the run trace. The race ends when time t has elapsed. The winner is the agent that gets the largest displacement during this time. The output (Output1) of this process is an array of size n × m1 where m1 = maximum number of movements. The missing values of the rest of the agents are filled with the maximum value of t (512 in this study) to complete the matrix. The columns of this matrix describe the motion of the agents in the competition. In this paper, we call timelines to the movements made by the agents. This processing work demarcates two spaces, the original space and the pre-processed space. The first one is characterized by the size of the matrix of raw data (m × n). The second, in its turn, is characterized by the size of Output1 (m1 × n). The study presented in this paper takes the matrix obtained from the pre-process and combines the properties of the data contained in both spaces (original and pre-processed). To this purpose we propose two scrutiny processes for such data. The first process relates the timeline data in the pre-processed space. The second process projects data into the original space and
determines whether the relationship with its neighbours is based or not on horizontal straight lines, classifying their findings as 0 for data forming straight horizontal lines, and 1 otherwise. After both processes, the results are conjugated in the pre-processed space. The interpretation of the obtained images is the basis for selecting the data to be displayed in 3D. These processes are described next.
Process 1
After obtaining the matrices that contain the captured peak times in each track (Output1), these times (obtained by the agents during the competition) are ordered decreasingly. These time values are numbered consecutively starting by 1, and an identical order is assigned to the same time values. These timelines are then normalized, thus obtaining Output2. The summary of process 1 is presented in Figure 1.
Figure 1. Algorithm Scheme for the Race of Agents; Generation of Output1
and Output2
This procedure enables the reduction of the widening gap in the time among the rows thus emphasizing abnormalities in raw images which are very small and very difficult to observe. However, care must be taken with this regularization, because, though abnormalities are highlighted, the intensity of them is determined according to the prospected field in each profile, and the procedure can generate visual errors for interpretation. But even in if this event, form-based interpretation defines areas of interest that facilitate more complex analyses.
Process 2
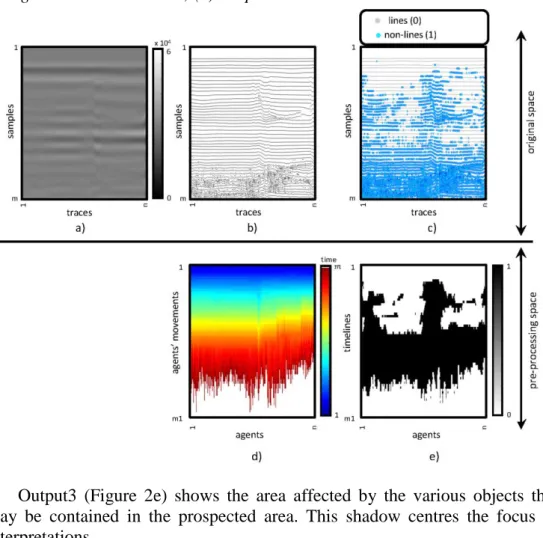
This process is based on the elimination of the horizontal straight lines of the pre-processed GPR images (Ayala-Cabrera et al., 2011a). Considering that the image is composed by combining different forms, it is suggested that the absence of variation of the wave amplitude horizontally corresponds to the absence of pipes. This is because pipes are represented in the form of hyperbolas in radargrams. This method takes as an input the radargram obtained from the survey (raw matrix, Figure 2a) and consists of three stages: a) binarization, b) segmentation and cleaning c) refining. This method uses a transformation of the raw matrix in two images (T14 and T15) containing the maximum and minimum peaks of the waves in each trace (Ayala-Cabrera et al., 2011b). The use of these two matrices requires carrying out steps 1 and 3 of the method. In this paper we propose to replace these matrices with Output1 (see Figure 2d). Since the principle of the analysis in both cases is similar (max and min wave peaks), this change reduces the number of steps of the elimination method of the horizontal straight lines. Thus, in this case, we only perform step 2 (segmentation and cleaning).
Segmentation is the process of dividing images, whose pixels have similar attributes, into regions or objects. Each segmented region usually has a meaning within the image, the aim being to simplify and / or change the representation of an image into another image more significant and easier to analyse. Hough’s transform, belonging to the set of segmentation techniques (techniques based on the border), is used in process 2 to detect horizontal lines and then classify them as likely to be eliminated in the image (cleaning). The amount of points that make up each line and its characteristics for removal and application of each step are determined in the iterative tests leading to reach a stable configuration that allowed identifying and removing of implausible location zones of the desired pipe in the picture (Ayala-Cabrera et al., 2011a). The cleaning and segmentation stage was addressed in three steps: a) edge detection, b) horizontal line detection and c) line removal. After having replaced matrices T14 and T15 with Output1, the first step of this phase (edge detection) becomes unnecessary. However at this point, we have projected the data contained in the Output1 into the original space (see Figure 2b). This data projection feeds step 2. In this step, projected data in the original space are transferred to the Hough parametric space in order to detect just horizontal straight lines. In the third step, data that make up the detected horizontal straight lines are classified as 0 (data subject to elimination) and the remaining data (data not belonging to any horizontal straight lines) are classified as 1, both in the original space (see Figure 2c) and the pre-process space (see Figure 2e). We call Output 3 the matrix obtained from the classification of lines and no-lines in the pre-processed space by the Hough transform.
Figure 2. Generation of Output3 – Segmentation and Cleaning; (a) Radargram, (b) and (d) Output1, (c) and (e) Classification of Horizontal Straight Lines and No-lines; (e) Output3
Output3 (Figure 2e) shows the area affected by the various objects that may be contained in the prospected area. This shadow centres the focus of interpretations.
Conjunction of Processes 1 and 2
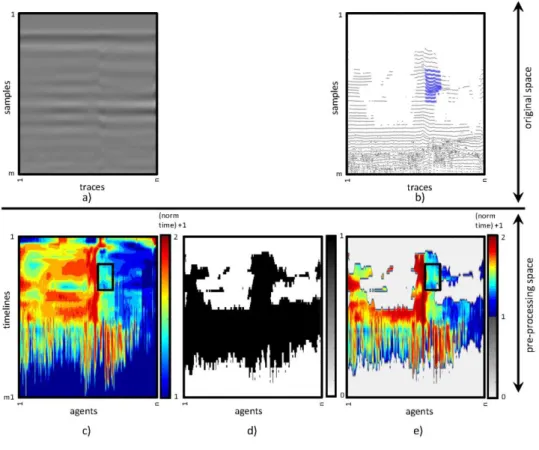
After performing the two processes, data are combined to obtain a conjugate image of the two spaces by means of {(Output2 + U) Output3} (see Figure 3e), where U is the matrix with all its entries equal to 1 and is the matrix Hadamard product. The idea of adding 1 to each entry of Output2 is intended to generate a suitable data classification, since values lower than 1 have no interest in the analysis, while values greater than or equal to 1 are worth analysing. This conjugate image delimits the space thus minimizing any possible confusion that can arise in Output2 (Figure 3c). In this paper we use boxes containing the object of interest (black box, Figure 3c and 3e). The data contained in this box are projected in the original space (Figure 3b) to observe what these shapes represent in that space. Although boxes are used in this work, one may notice that a more detailed study of borders enables to define more precisely the characteristics of different objects in GPR images.
Figure 3. Generation of the Conjugate Image; (a) Radargram, (b) Projection of the Conjugate Image onto the Original Space of Selected Data, (c) Output2 + U, (d) Output3, and (e) Conjugate Image
Case Study
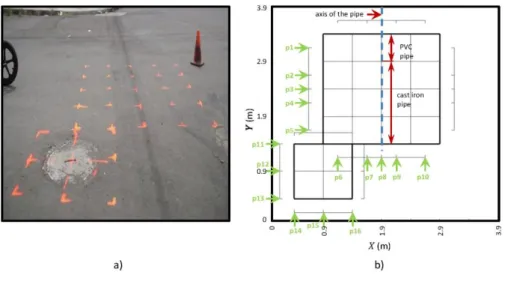
This section presents the configuration data collection for the case study, which corresponds to a WSS urban environment. The interest of this study area lies in the complexity of the analysis of the profiles obtained with GPR, since the buried pipe in this section presents two pipe materials (PVC and cast iron). This was eventually verified by excavation. The roadway material is asphalt concrete. The pipeline has a nominal diameter of 150 mm (for both materials) and a depth of 0.75 m (± 0.05 m). The captured profile configuration with the GPR is shown in Figure 4. Two measuring meshes, with a spacing of 0.50 m were designed. The first one comprises the area that contains the pipe and measures 2.0 m x 2.0 m. The second measuring mesh was further conducted to observe the response of the passage of the GPR through a manhole and measures 1.0 m x 1.0 m. A total of 16 profiles noted {p1, ..., p16}, 10 for zone 1 {p1, ..., p10} and 6 for zone 2 {p11, ..., p16} (see Figure 4,b) were captured. It should be mentioned that each profile was captured 0.25 m before and 0.25 m after the mesh, approximately.
Figure 4.Layout of the Field Test
The interest of zone 2 lies in its proximity to the sought pipe, as it is expected to generate interferences, given the measurement characteristics, thus hindering image interpretation. Additionally, inspecting zone 2 will enable to evaluate the possibility of identifying different objects close to the pipes. These objects are of interest to other systems, as in this case study, regarding wastewater and / or rainwater collection systems. The interest for such systems on detecting these manholes is that sometimes, after the re-pavement of driveways, enhancement of manholes necks is overlooked, thus accidentally closing them down. As a result, the location of these manholes is lost.
The GPR equipment used corresponds to a commercial monostatic antenna with a centre frequency of 400 MHz. The equipment parameters correspond to 120 traces / s, 512 samples / trace and 20 ηs / 512 samples. The metric of the obtained traces was performed using pulses marked by the operator, when crossing the grid lines perpendicular to the trace. These marks were used to resize the GPR images. Resizing meets a criterion, namely the minimum number of traces enabling to observe objects in the conjugate images. This criterion was achieved after multiple iterations with 1trace / cm.
Interpretation
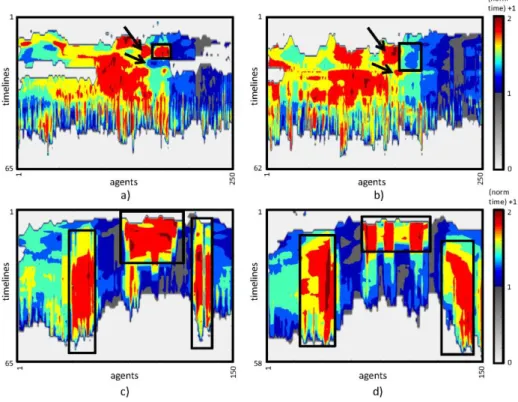
In this section we show the results of the interpretations of the most interesting profiles. Although all the profiles were interpreted and used for 3D rendering, the selected profiles used to display the results are: p1, which cuts transversally the PVC pipe; p2, which cuts transversally the cast iron pipe and is closest to the point of change of material; p12 and p15, the profiles cutting the manhole in its entirety. In Figure 5, the conjugated images for these profiles are presented.
Figure 5.Conjugate Image. (a) p1, (b) p2, (c) p12 y (d) p15
In Figure 5 (a and b) some similarity between the images is observed: one area with high intensity (towards the left) and another with a low intensity (to the right). Two black arrows point to two additional contours that could represent the pipe, while they are not in the area in which we have identified the pipe (black box). The contour pointed by the upper arrow was discarded by observing that it only represents half of a circle and after contrasting with Figure 6 (a and b) respectively, not significantly demarcating a deformation. For the contour marked by the lower arrow only the second criterion was considered. As a result, the two contours pointed by the arrows were considered as characteristics which help demarcate the pipe, which is contained in the box.
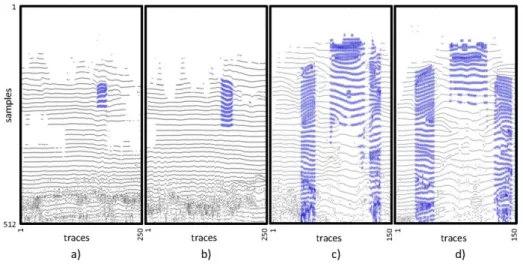
In Figure 5 (c and d), the selected profiles are mutually perpendicular but show great symmetry demarcating three zones of interest. The first one (box to the left of each image) and third (box to the right of each image) show the manhole walls. The second (central box of each image) shows the manhole, including the lid. In Figure 6, projected in the original space, the boxes selected for profiles (blue dots) and the remaining data (black dots) in Figure 5 are presented.
Figure 6. Projection on the Original Space of Data from the Selected Boxes; (a) p1, (b) p2, (c) p12, y (d) p15
In Figure 6 (a and b), it can be seen that the selected areas are composed of a family of hyperbolas. The first hyperbola, in both cases, has its focus below the curve. In both cases, the focus moves for the various curves, until it is positioned above the curve (last curve). We note that the focus shift (from being on top to get below) occurs at the same depth for both images. This change in position of the foci may represent the centre of the pipe. It is also noted that the number of curves that make up every form is higher in part b of the figure, than in part a, which is obviously explained by the change of material, due to the fact that the passage of the signal and its response through plastics is captured less frequently than that for metallic materials.
In parts c and d of Figure 6 we note that the selected areas are formed by areas which could be mistaken with features of the previous two parts of the figure. However, it can be noted that these features, in any of the frames selected in c and d of Figure 5, demarcate contours such as circles, ellipses, etc., as is the case of pipes, which enables to set another criterion for object discrimination.
Mesh and 3D Model Generation
Once all captured GPR profiles have been evaluated, and boxes of interest have been drawn and projected into the original space, they are spatially positioned. The obtained boxes are treated separately for 3D reconstruction. The boxes are classified into 3 groups. The first major group contains data boxes that are interpreted as a pipe. The second group contains all the data in the boxes that are classified as parts of the manhole. The latter group, in turn, contains only the data from the central square corresponding to profiles p12 and p15. These three groups are treated separately, each generating a mesh system. The meshes generated in this study were constructed by the so-called
for building meshes in different domains (Dey et al., 2012; Liu et al., 2010). For this reason we use this triangulation to relate to the contours obtained. We justify this by the fact that the main contribution of this work is to evaluate the feasibility of constructing 3D models from GPR images, taken in urban environments.
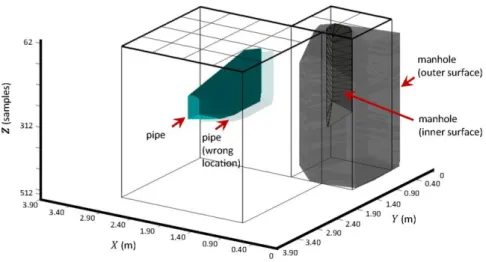
The 3D assembly of the two objects of interest obtained in this case study is presented in Figure 7.
Figure 7.3D Reconstruction; Case Study
In Figure 7 we can see that it is possible to reconstruct a 3D model from the images obtained by the GPR. It can also be seen that, in addition to the installed pipe, the boundary conditions surrounding the pipe can be reconstructed. We also note that the GPR interpretations, although not exactly corresponding to the real dimensions, give a clear idea of buried pipes and their status. It is thus possible to reconstruct such complex piping materials (in terms of visualization by non-destructive methods) as plastics.
The deformation of the pipe and the inner contour of the tank is a result of the signal passing through each material. We can therefore advance in the study of how signal-ground interactions occur, thus helping resize and classify them. However, the 3D model, by itself, can help build an idea of the buried objects. All this also has the advantage of having used non-destructive methods, such as GPR, to capture information. In Figure 7 we have further shown how the initial position gave a displacement of 0.15 m into the manhole with respect to the measured field. This displacement, being equal in all profiles, is considered a measurement error of the metric. This is reasonable, given that the characteristics of the measurement system used (through pulses), taking into account that the marks have been made by the operators, thus adding non negligible uncertainty.
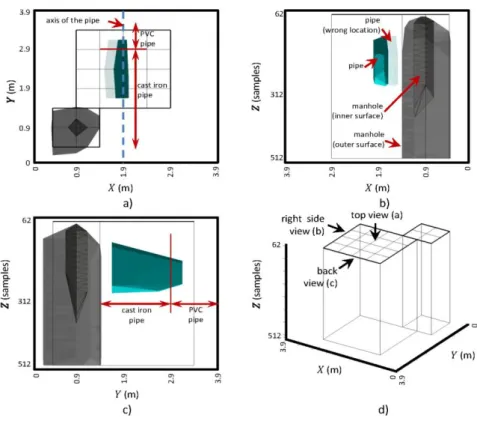
In Figure 8 some 3D views of the representation obtained for the case study are presented. The selection of the views is not accidental but motivated for the fact that hydraulic simulations in WSSs are performed by simplifying
the plan view (Figure 8a); this view, in turn, includes properties such as depth and length, among others, from other front and side views (Figure 8b and 8c).
Figure 8.Various Views for the 3D Representation of the Case Study: (a) Top
View, (b) Right Side View, (c) Back View and (d) Location of Viewpoints
Conclusions
This paper has addressed an urban case study, which poses great difficulty given its characteristics. This case has shown the feasibility of obtaining, using non-destructive methods (GPR in this case), 3D representations that facilitate the understanding of the studied areas. This case study has shown that it is feasible to identify pipes of different materials in GPR images (zone 1). The second zone, in contrast, has enabled to observe the influence of objects (in this case a manhole) on the visualization of the pipes, which is the main goal in this paper. We have seen that it is possible to recognize and identify not only the pipes but also those objects. The study has also raised the need to evaluate more reliable systems for spatial location, able to suitably locate the objects analysed while avoiding uncertainty. Such is the case of the displaced position of the pipe relative to the measurement location in the field. The work presented in this document enables us to see how objects are grouped vertically as families of curves, which are not straight horizontal lines within the images. Furthermore, the first curve presented is a hyperbola, whose focus is under the curve. So it is shown that, although the classic detection of hyperbolae is a
are characteristic of the object and its relationship with the environment. By grouping and then visualizing, using 3D representations, these characteristics, we also show that deeper understanding of the studied area by not highly qualified personnel in the GPR image analysis is favoured. Additionally, these features provide a basis for the training classification systems able to automate the process. Finally, the use of non-destructive methods (here GPR) in WSSs is fostered.
References
Ayala-Cabrera, D., Pérez-García, R., Herrera, M., and Izquierdo, J. 2011a. Segmentación y limpiado de imágenes de GPR de tuberías enterradas. [Segmentation and GPR imaging of buried pipelines.] In Proceedings of IX SEREA, Seminario Iberoamericano de Planificación, Proyecto y Operación de
Abastecimiento de Agua (Morelia, México, January 10-14, 2011). 55-66.
Ayala-Cabrera, D., Herrera, M., Montalvo, I., and Pérez-García, R. 2011b. Towards the visualization of water supply system components with GPR images. Math.
Comput. Model. 54 7-8 (Oct. 2011), 1818-1822. DOI= http://bit.ly/1QrO7id.
Ayala-Cabrera, D., Izquierdo, J., Montalvo, I., and Pérez-García, R. 2013a. Water supply system component evaluation from GPR radargrams using a multi-agent approach. Math. Comput. Model. 57, 7-8 (April. 2013), 1927–1932. DOI= http://dx.doi.org/10.1016/j.mcm.2011.12.034.
Ayala-Cabrera, D., Herrera, M., Izquierdo, J., Ocaña-Levario, S. J., and Pérez-García, R. 2013b. GPR-based water leak models in water distribution systems. Sensors 13, 12 (Nov. 2013), 15912–15936. DOI= http://dx.doi.org/10.3390/s131215912. Dey, T. K., Janoos, F., and Levine, J. A. 2012. Meshing interfaces of multi-label data
with Delaunay refinement. Eng. Comput. 28, 1 (Jan. 2012), 71-82. DOI= http://dx.doi.org/10.1007/s00366-011-0217-y.
Dyana, A., Rao, C. H., and Kuloor, R. 2012. 3D Segmentation of ground penetrating radar data for landmine detection. In Proceedings of Ground Penetrating Radar
(GPR) 2012, 14th International Conference on (Shanghai, China, June 4-8,
2012). IEEE 2012, 858-863. DOI= http://bit.ly/1kBtVh4.
Heikkilä, R., Kivimäki, T., Leppälä, A., Mikkonen, M., and Lasky, T. A. 2010. 3D calibration of GPR (ground penetrating radar) for bridge measurements – case Kajaani Varikko Bridge. In Proceedings of 27th International Association for
Automation and Robotics in Construction, ISARC, 2010 (Bratislava, Slovakia,
June 27-27, 2010). 29-39.
Liu, Y., Foteinos, P., Chernikov, A., and Chrisochoides, N. 2010. Multi-tissue mesh generation for brain images. In Proceedings of 19th International Meshing
Roundtable (Chattanooga, Tennessee, USA, Octuber 3-6, 2010). IMR,
Chattanooga, TN, Springer-Verlag, Berlin, 367-384. DOI= http://bit.ly/1SyY9eS. Peña, J. A., and Teixidó, T. 2013. Cover surfaces as a new technique for 3D GPR
image enhancement. Archaeological applications. In Repositorio Institucional de
la Universidad de Granada, 2013. URL: http://hdl.handle.net/10481/22949 [last
accessed 08.05.15].
Shoham, J., and Leyton-Brown, K. 2009. Multiagent Systems: Algorithmic,
Game-Theoretic and Logical Foundations. Cambridge University Press. Cambridge,