VCU Scholars Compass
Computer Science Publications
Dept. of Computer Science
2017
Mining Sequences of Developer Interactions in
Visual Studio for Usage Smells
Kostadin Damevski
Virginia Commonwealth University, [email protected]
David C. Shepherd
ABB Corporate Research
Johannes Schneider
ABB Corporate ResearchLori Pollock
University of Delaware
Follow this and additional works at:
http://scholarscompass.vcu.edu/cmsc_pubs
Part of the
Computer Engineering Commons
© 2016 IEEE. Personal use is permitted, but republication/redistribution requires IEEE permission. See http://www.ieee.org/publications_standards/publications/rights/index.html for more information.
This Article is brought to you for free and open access by the Dept. of Computer Science at VCU Scholars Compass. It has been accepted for inclusion in Computer Science Publications by an authorized administrator of VCU Scholars Compass. For more information, please contact
Downloaded from
Mining Sequences of Developer Interactions
in Visual Studio for Usage Smells
Kostadin Damevski, David C. Shepherd, Johannes Schneider, and Lori Pollock
Abstract—In this paper, we present a semi-automatic approach for mining a large-scale dataset of IDE interactions to extract usage smells, i.e., inefficient IDE usage patterns exhibited by developers in the field. The approach outlined in this paper first mines frequent IDE usage patterns, filtered via a set of thresholds and by the authors, that are subsequently supported (or disputed) using a developer survey, in order to form usage smells. In contrast with conventional mining of IDE usage data, our approach identifies time-ordered sequences of developer actions that are exhibited by many developers in the field. This pattern mining workflow is resilient to the ample noise present in IDE datasets due to the mix of actions and events that these datasets typically contain. We identify usage patterns and smells that contribute to the understanding of the usability of Visual Studio for debugging, code search, and active file navigation, and, more broadly, to the understanding of developer behavior during these software development activities. Among our findings is the discovery that developers are reluctant to use conditional breakpoints when debugging, due to perceived IDE performance problems as well as due to the lack of error checking in specifying the conditional.
Index Terms—IDE usage data, data mining, pattern mining, usability analysis
Ç
1
I
NTRODUCTIONT
HE majority of software developers nowadays rely on Integrated Development Environments (IDEs), some-times extended via custom plug-ins, for much of their daily work. IDEs provide developers with an extensive toolkit that includes support for compilation, debugging, profiling, refactoring and other tasks. Most development tasks can now be completely accomplished within these environ-ments. The complexity of modern IDEs warrants research into the usability of such environments to accommodate a broad set of tasks and developer skill levels. Studying developer behaviors within such IDEs in the field can often reveal interesting patterns to researchers, providing sup-porting (or dissenting) evidence for findings on developer behaviors on various software engineering tasks and use of related tools, obtained in controlled lab experiments.Large scale IDE usage datasets, collected from the inter-action histories of hundreds of developers in the field, have been available to researchers for a number of years. How-ever, previous IDE usage data analyses have been either limited to specific parts of the IDE (e.g., refactoring tools [1], [2]) or have relied on simple analysis of individual IDE actions or transitions between pairs of actions [3], [4]. Broad,
exploratory mining of longer sequences of developer behav-ior, consisting of several interactions have rarely been con-ducted using such datasets.
In this paper, we describe a novel exploratory workflow to mine frequentusage patterns (or sequences)of interactions from a large repository of IDE usage data. Extracting common behaviors exhibited by a number of developers in the field can highlight sequences of interactions with the IDE, which are representative of software engineering micro tasks (e.g., comprehension, feature location) performed by developers. Such mined tasks can provide a novel way to examine the developer usage of the IDE, revealing approaches that devel-opers take in accomplishing common activities, such as step-ping through code with the debugger, searching for a location in the code base, or opening and editing sets of files. Other descriptive statistics, such as elapsed time and occurrence counts can also be computed to provide further insights into developers’ behavior. These mined usage patterns can be used as motivation to conduct a subsequent survey of the developers, as we did in this paper, to identifyusage smells, which more strongly point to usability issues with the IDE.
We apply our novel sequence mining workflow to a large-scale IDE dataset, consisting of all the IDE interactions of 196 developers at ABB, Inc. over a period of up to several months. Throughout this paper, we call this data set the ABB Developer (ABB-Dev) dataset. The results of mining sequential patterns from this large-scale dataset are used as a means of identifying deficiencies in IDE usability, due to flaws in IDE design, gaps in developer knowledge in using the IDE, or both of these factors. This type of usage analysis is commonly performed in web applications [5], where web server logs, which are easily available, are mined for insights into application usage. However, many of the min-ing approaches used in the web domain are incapable of managing the scale, heterogeneity, and noise in IDE usage
K. Damevski is with the Department of Computer Science, Virginia Com-monwealth University, Richmond, VA 23284. E-mail: [email protected].
D. Shepherd is with ABB Corporate Research, Raleigh, NC 27606. E-mail: [email protected].
J. Schneider is with ABB Corporate Research, Baden-Dattwill CH-5405,€ Switzerland. E-mail: [email protected].
L. Pollock is with the Department of Computer and Information Sciences, University of Delaware, Newark, DE 19350. E-mail: [email protected]. Manuscript received 9 July 2015; revised 21 May 2016; accepted 4 July 2016. Date of publication 18 July 2016; date of current version 24 Apr. 2017. Recommended for acceptance by R. DeLine.
For information on obtaining reprints of this article, please send e-mail to: [email protected], and reference the Digital Object Identifier below.
Digital Object Identifier no. 10.1109/TSE.2016.2592905
0098-5589ß2016 IEEE. Personal use is permitted, but republication/redistribution requires IEEE permission. See http://www.ieee.org/publications_standards/publications/rights/index.html for more information.
data. Logged messages in IDE data include a broad set of asynchronous IDE events and intentional developer clicks relevant to interpreting high-level developer behaviors, intertwined with noise from messages caused by unrelated IDE events and spurious clicks.
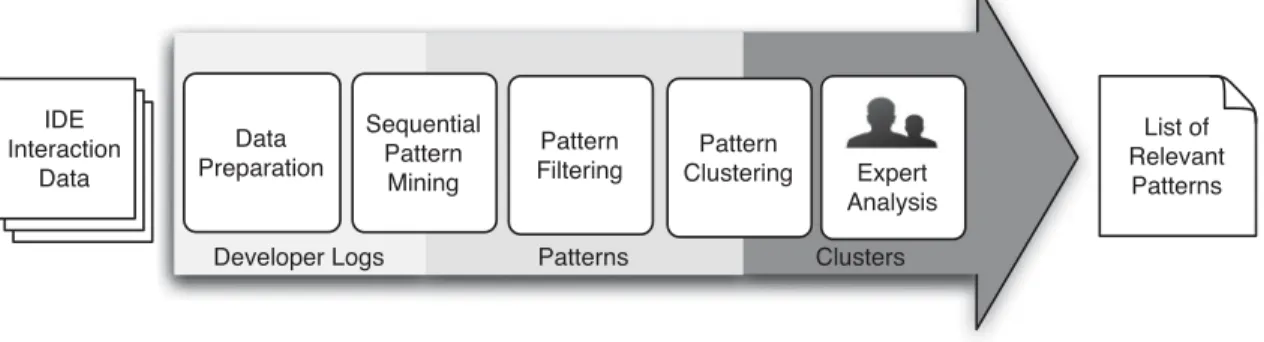
The described IDE usage data mining workflow has the characteristics of a funnel, in that, in its early stages, it per-forms general aggregation operations applicable to many IDE data analytic tasks, while, in the later stages, it focuses on identifying a few specific usability patterns and smells. Therefore, the contributions of this paper are in both the data analysis approach as well as the results from this anal-ysis. First, our IDE usage data analysis workflow contains the following novel characteristics:
Applies sequential pattern mining to noisy and large-scale IDE usage data,
Clusters similar sequences for easier human inter-pretation using a tailored distance function that com-bines sequential similarity with the rarity of event occurrence, and
Confirms pattern findings by cross-referencing with expert opinion and developer surveys to interpret the mined behavior, examine the IDE usage pattern, and remove any ambiguity due to imperfect log mes-sage capture.
Second, we discovered several interesting developer behaviors in Visual Studio via our usage data analysis, elu-cidated via a survey of the discovered behaviors from over 50 developers at ABB, Inc.:
Developers search their code frequently and ineffi-ciently, due in part to the poor presentation of search results in Visual Studio.
Developers rapidly visit several files in their active file set before locating a relevant file, and do not report any hardship in doing so.
Developers debug using a small command set and recognize the need for improved capabilities, though some, such as conditional breakpoints in Visual Stu-dio, are poorly implemented.
The remainder of this paper is organized as follows. Section 2 describes the goals of our mining approach, while Section 3 outlines related approaches and studies. In Section 4, we describe our IDE usage data mining workflow. Section 5 describes a selection of the results of that workflow, which are further elucidated via a devel-oper survey discussed in Section 6. Section 7 details the meaning and implications of the results of the usage smell analysis, while Section 8 describes the threats to validity. Finally, Section 9 summarizes the conclusions and future work of this project.
2
D
ATAM
ININGG
OALS ANDC
HALLENGESThe goal of our data mining is to discover interesting sequences of user interactions within an IDE. Our study is exploratory in that we mine from a dataset consisting of all interactions in the IDE, rather than focusing on a subset related to a specific IDE capability. Like several researchers before us, we are interested in confirming or debunking researchers expectations of developer behavior in the field, in
their natural setting and without observational bias. The main difference to prior work in this area is that we are interested insequences of IDE interactions, rather than focusing on the usage of a single command or the transition between pairs of commands.
Sequences consisting of the IDE interaction patterns exhibited by many developers can be interpreted as a set of intentional commands and clicks performed by the user to accomplish a small task. These tasks are often trivial (e.g., stepping through code with the debugger, building code and fixing resulting errors), but sometimes reveal interest-ing and unexpected behaviors. Since these behaviors are exhibited by many developers, we can treat them as typical usage of the IDE, which when inefficient, may reveal prob-lems in IDE usability design or deficiencies in developer training to use the IDE’s capabilities.
Large datasets consisting of all IDE interactions by a set of developers have been available for several years. Most notably, The Eclipse Usage Data Collector (UDC) project collected such data from thousands of users of the Eclipse IDE [6]. The UDC project has been discontinued in recent releases of this IDE, so the collected data focuses on usage of older versions of Eclipse. However, the ABB Developer dataset, which we use in our study, provides a more recent dataset, based on the Visual Studio IDE, at a considerable scale of nearly 200 developers. The dataset is collected by a Visual Studio extension, which has since become a part of the Codealike IDE developer productiv-ity suite [7].
Both UDC and ABB-Dev record a similar, broad set of IDE commands that have been issued by developers, views (windows within the IDE) that have received developer clicks, and editor behaviors (without recording any of the actual code for privacy reasons). These logged items are provided in a time stamped stream indexed by an identifier assigned to each developer whose interactions were recorded. The datasets also contain certain events, triggered by the IDE itself, such as when compilation completes, a breakpoint is reached by the debugger, or when the IDE is put in the background or re-activated. The actions of many developers over several months of IDE usage generate very large datasets, which are challenging to analyze.
A significant challenge in analyzing sequences of mes-sages in IDE datasets is in differentiating noise from sig-nal. In this work, we define noise to be the logged actions that reflect spurious or irrelevant clicks or events that do not provide relevant information on the devel-oper’s task. For instance, consider a set of developer actions to fix a bug in the IDE interrupted by a message reporting that the project has finished building. In certain cases, this event may inform us about what the developer did in subsequent actions in the IDE, for instance, looked at the build error log, while in other cases, it may not provide useful information to the pattern. Some fre-quently occurring messages may be relevant to certain patterns (such as putting the IDE in the background), while they may be irrelevant to other patterns. The num-ber and diversity of such event combinations and the dif-ficulty in understanding the influence of each event in a developer’s workflow make enumerating all of these sce-narios prohibitive.
3
R
ELATEDW
ORKDue to its scale and unbiased nature, IDE usage data analy-sis has frequently been used by researchers to examine developer behavior in the field, including highlighting which tools are commonly used by developers [3] and how refactoring tools are used [4]. This data has also been used as a means to build predictive models for a variety of soft-ware engineering purposes, such as detecting coupled source code artifacts [8] and recommending IDE tools to developers [9]. The majority of such analyses did not require deeper mining of developer actions in IDE usage data, relying mostly on counts of messages and transitions between pairs of messages (Markovian analysis).
The usability of the Visual Studio IDE has been investi-gated only a few times in the past. Snipes et al. examined efficent work patterns in Visual Studio and implemented a game-like environment to encourage such developer behav-iors [10], [11]. Recently, Amann et al. studied developer usage of Visual Studio using a field dataset of over 6,300 hours of developer time [12]. Their work focused primarily on measuring the time consumption and frequency of cer-tain actions (e.g., code completion, navigation, etc.) in Visual Studio. Compared to this prior work, our approach focuses on pattern mining an even larger dataset of Visual Studio interactions, where the mined results are followed up with a developer survey.
Recently, pattern mining has been used for the identify-ing novel code transformations for inclusion in the IDE by Negara et al. [1]. While the researchers relied on pattern mining, as does this paper, they used a more conventional itemset mining technique that does not maintain the sequential order of the mined items. Negara et al. also gath-ered a dataset that included the code that the developers were maintaining, which is more difficult to obtain at scale and is categorically different from the dataset we use in our work. Such a dataset can be recorded by the Fluorite tool [13], which captures developer interactions in the IDE editor sufficient to reconstruct the program at each point in time. The dataset used in this paper, as well as other large scale IDE interaction datasets, such as the Eclipse UDC dataset, do not contain any of the code, due to privacy and other similar concerns.
Vakilian et al. studied usability problems with IDE refac-toring tools [2] using the critical incident technique, based on analysis of interactions preceding and following a fixed set of specific IDE actions or events. The IDE usage dataset used was much more detailed than the one used in this
paper in its reflection of user behavior in using refactoring tools. Compared to our mining technique, their approach was more focused rather than exploratory, and was reliant on a less ambiguous dataset.
Khodabandelou et al. used a hidden Markov model based approach to build a process model of developer behavior based on the Eclipse UDC dataset [14]. The approach used was similar to ours in both its exploratory nature and its dataset. The main difference with our work is that our tech-nique focuses on mining individual behavioral patterns, while the goal of the approach by Khodabandelou was to build an abstraction (e.g., a finite state machine) of the overall high-level behavioral processes used by the developers.
Sequential pattern mining has been used for usability analysis in several related domains, including the mining of web logs for usability testing of web-based applications [15] and in improving the success factors in online collaborative learning [16].
4
M
ININGA
PPROACHThe inputs to our data mining workflow are time-ordered logs of IDE interactions for each developer, collected during their regular work activities, spanning months of activity. The output is a list of behavioral patterns, commonly exhib-ited by developers, that exemplify potential IDE usability problems. The mined patterns are selected to serve as points of improvement in IDE design and use. To process the inputs, while addressing the scale and noise typical in IDE interaction datasets, we propose a novel mining workflow consisting of several steps shown in Fig. 1. We discuss each step below in detail.
4.1 Input IDE Interaction Dataset
The ABB-Dev IDE interaction dataset consists of over 8 mil-lion logged actions by 196 developers at ABB, Inc., repre-senting 32,811 developer hours of usage of the Visual Studio IDE. The dataset is recorded by a Visual Studio extension that, after a straightforward installation, sub-scribes and records most of the IDE’s published events. Each of the monitored developers had at least 5 hours of development time recorded by the tool.
ABB-Dev contains all of the user interactions in the IDE as timestamped log messages, including IDE commands (e.g., build, execute a test), views (e.g., click on the error list window), or events (e.g., build finished). Keypresses and clicks within the IDE editor, which edit the code or just move the cursor, are partially aggregated by the ABB-Dev Fig. 1. A schematic of the sequence mining workflow for large-scale IDE log analysis.
tool to reduce log size, so that not each keypress is written to the log, but instead several keypresses are converted into a message, such as an editor scroll down event, tab insertion, deletion, etc.
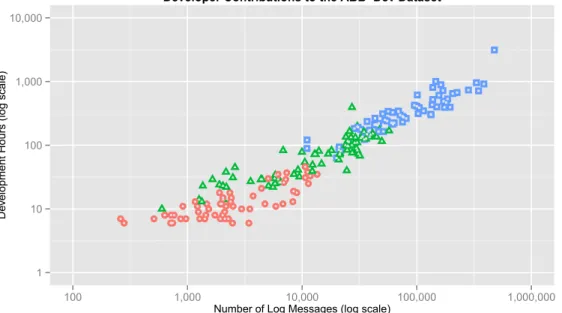
To illustrate the dataset, a listing of two sample ABB-Dev messages is shown in Fig. 3; each message consists of a type, timestamp, user id, and category. Fig. 2 shows a visu-alization of each developer’s contribution to the overall ABB-Dev dataset in terms of number of hours monitored and the number of interaction messages. There were groups of developers that allowed the tool to monitor their behav-ior for relatively short periods (days, visualized as circles), medium periods (weeks, visualized as triangles) and longer periods (months, visualized as squares).
4.2 Data Preparation
To prepare the dataset for the task of detecting interesting usage patterns in the IDE, and for the sequential pattern mining process (next step), while also removing
unnecessary processing downstream in our workflow, we perform the following four actions:
1) Separate the dataset into time-ordered sequences of indi-vidual developer interactions. The original ABB-Dev dataset is stored in one very large log file, in time order. We separate the dataset by developer, while preserving the order of each developer’s messages by their time order. The ordering of messages, but not their actual time, is important to sequential pat-tern mining.
2) Add log messages to represent inactive time intervals. While breaks in developer interactions with the IDE are common, the sequential pattern mining process ignores the actual event timestamps. To account for such breaks in time and avoid spurious associations between developer actions that are distant in time, we introduce a new message into the log to signify that a period of inactivity occurs for a developer in the log. In our analysis, we chose a threshold of 5 minutes as we believe that this constitutes a substan-tive period, which, when passed, likely indicates a break in the developer’s activity. In our estimation, it is fairly unlikely that a developer is still performing a task and does not have any key press or click in the IDE for a 5 minute span. The inactivity message can be repeated to signify a longer break. In order to limit the repetition we choose a threshold of 30 minutes (or six consecutive messages) where we deem further repeats to be unnecessary, based on the gap size of the sequential pattern mining algo-rithm described in the next step of our workflow. Changing the gap size requires adjusting the thresh-olds for the inactivity messages in order to prevent long periods of inactivity from being ignored by the mining algorithm.
3) Aggregate repetitive edit messages into a single edit mes-sage.In ABB-Dev, the set of messages indicating the Fig. 3. A sample of two log messages from the ABB-Dev IDE usage
dataset.
Fig. 2. Distributions of the developers according to the number of hours monitored and the number of log messages collected. The circles denote developers with less than a week of monitoring, triangles denote developers with between a week and a month of monitoring, while squares denote developers with more than a month of monitoring.
action of editing code and the messages signifying moving the cursor within the IDE are overly detailed, and individually irrelevant to our analysis. Note that large-scale field IDE usage datasets like ABB-Dev do not contain the actual code, and indi-vidual small-scale editing commends (e.g., insert tab, delete line) are difficult to interpret. Thus, we aggregate consecutive sets of edit-related messages into a single edit message for analysis.
4) Aggregate repetitive move cursor messages within the edi-tor messages into a single move cursor message.ABB-Dev records both clicks within the editor window and scrolling up and down commands separately. Thus, we combine consecutive move cursor messages into a single move cursor message, except when a subse-quence of actions contains both move cursor and edit messages. In this case, we aggregate it all into a single edit message. Often developers move the cursor before deciding where to perform edits. The edit mes-sage is the relevant action in this process, while the movements of the cursor constitute a detail irrelevant to our subsequent mining task.
4.3 Sequential Pattern Mining
At the beginning of the sequential pattern mining, the data consists of a set of time-ordered interaction sequences, one for each of the 196 developers. While the previous step shrunk the number of messages in the dataset, via aggregation of the numerous edit and move cursor messages, the size of most sequences continues to range between tens of thousands to hundreds of thousands of messages, a challenging scale for many common sequential pattern mining algorithms.
Sequential pattern mining algorithms identify a set of subsequences (or patterns) that occur in some percentage (or, with minimumsupport) of the input sequences. The per-developer split of the ABB-Dev data sequences allows us to specify a meaningful support parameter to the sequential pattern mining algorithm, i.e., at least 10 percent of the developers. Thus, if a sequential pattern is exhibited by 20 of the roughly 200 developers, then the algorithm should discover the pattern. In this way, we can search for IDE usage patterns that are common across a substantial popula-tion of the developers, allowing for greater relevance to the mined results.
To account for the noise in IDE data due to unrelated events and clicks, as described in Section 2, we mine sequences while tolerating a gap of one message in the input sequences. For example, a gap of a single message instructs the pattern mining algorithm to consider a candi-date pattern a!cto have occurred in an input sequence a!b!c, thus contributing to the level ofsupportneeded to consider the a!c pattern relevant. We also experi-mented with longer gaps, but decided, based on observing both the input sequences and identified patterns, that a gap of one message avoids noise in most cases that we consider and produces few or no spurious patterns at the support level of 10 percent. Note that the concept of noise is task-dependent and thus other analyses might define and handle noise in different ways.
Sequential pattern mining algorithms produce an exhaustive set of patterns found in the input dataset. This
results in all of the subpatternsa,b,c,a!b, andb!cto be part of the output if the longer patterna!b!cis identi-fied. To reduce the number of smaller subpatterns that are found by the sequential pattern mining algorithm, we require that the algorithm producesclosed or maximal terns, where patterns that are contained within longer pat-terns are ignored. Closed sequential pattern mining algorithms remove all patterns that exist within other iden-tified patterns and occur at the same support level, while maximal pattern mining removes sub-patterns regardless of the support level. For our problem, the maximal pattern mining is preferable, as once we have identified patterns that meet the threshold of 10 percent support, further changes in the support levels are not relevant to the subse-quent analysis that we perform.
Accounting for each of these requirements: relatively low support of 10 percent, a gap of one message and maxi-mal patterns, while also processing the lengthy sequences in the ABB-Dev dataset is a challenge for most sequential pattern mining algorithms. Few of the commonly used sequential pattern mining algorithms are capable of even producing maximal patterns [17]. We considered a number of popular algorithms, finally identifying the recently pro-posed MG-FSM algorithm [18] as the only one that could satisfy all of these requirements. MG-FSM is parallelized using map-reduce (Hadoop) functionality which eases its use on a cloud infrastructure and aids desired scalability for larger datasets.
4.4 Pattern Filtering
The MG-FSM algorithm produces 84,145 patterns based on our requirements, which is too large for human examina-tion, even though many of the patterns are quite similar. For instance, one pattern may contain an edit, followed by a project build, followed by a click on the error view, while another may contain the same sequence with a click on the project explorer view preceding the build command. The next two steps in our workflow have the goals of first fil-tering out irrelevant patterns, and then grouping similar patterns to enable human analysis. Much of the filtering at this stage was motivated by our desire to detect usage smells in the IDE, while other goals may necessitate differ-ent filtering strategies.
The first filter removes overly short patterns that are less likely to provide a clear, unambiguous snapshot of devel-oper behavior. Specifically, many patterns under 8 mes-sages were difficult to interpret meaningfully or in a way that may provide evidence for a specific developer behav-ior, and thus we filter out all sequences less than 8 message long (approximately 34 K patterns). We recognize that this may remove some interesting shorter behaviors, perhaps even removing the presence of patterns reflecting certain aspects of the IDE’s functionality.
The second filter removes patterns that contain messages that are too ambiguous if interpreted as usage smells. There-fore, due to the lack of any evidence outside of the IDE usage stream, we remove all patterns that contain a time gap and all patterns that contain a command noting that Visual Studio was placed in the background. We also remove patterns with the move cursor message as the
purpose of the cursor movement was unclear in many cases and it provided little to no help in identifying usage smells. In total, this resulted in a reduction of about 33 K patterns.
While filtering these messages earlier in the workflow would be computationally cheaper, as they are of no rele-vance to the mining of usage smells, their removal could affect the results produced by the sequential pattern mining by adding spurious associations. This is because messages that would be ordinarily separated by time or cursor move-ment messages would be brought closer together, and pos-sibly identified as patterns, with the removal of such messages earlier in the workflow.
4.5 Pattern Clustering
After the filtering step, less than a quarter (i.e., 17,867) of the initial 84,145 patterns remain. Many of these remaining pat-terns are still similar to each other, intuitively correspond-ing to groups of developer actions commonly performed to achieve a specific small goal (e.g., find a location in the code, debug). Grouping similar sequences allows examina-tion of the different ways that developers commonly per-form a task and enables identification of unexpected IDE usage workflows.
To cluster patterns, we use the k-medoids algorithm, a variant of k-means that uses existing points in the dataset as cluster centroids. K-means cannot be used directly because calculating a centroid of a set of mined patterns often results in a non-pattern, since numerical operations, like addition and division, cannot be performed on two patterns. K-means cannot proceed with a non-pattern centroid, as, then, the distance function is undefined between a non-pattern and a pattern.
For the distance function, we define a novel function that combines two characteristics of similar patterns: 1) similar patterns have long subsequences of IDE actions in common; and 2) when an action occurs rarely in the dataset, the sequen-ces that contain that message are similar. To address the first characteristic, we use Longest Common Subsequence (LCS); to address the second characteristic, we use a function that takes into account individual action frequencies in the dataset. We combine both of these influences by a weighted sum.
Specifically, we define the distance function, DðPa; PbÞ,
for any two mined IDE interaction patternsPaandPbas
fol-lows. Note that a value of 0 for the distance function indicates that two patterns are completely alike, while a value of 1 indicates that the patterns are completely different
DðPa; PbÞ ¼aDLCSðPa; PbÞ þ ð1aÞDOccðPa; PbÞ:
Using a factora, ranging between 0 and 1, we weigh influ-ences from two separate measures of distance, one based on simple Longest Common Subsequence,DLCS, and the other,
DOcc, which accounts for the occurrence frequencies of the
messages that constitute the two patterns DLCSðPa; PbÞ ¼1
jLCSðPa; PbÞj jPa[Pbj ;
wherej jis the modality of a set,LCSðPa; PbÞis the longest
common subsequence between the two patterns without regard for starting position, andPa[Pbis the union of the
messages in the two sequences
DOccðPa; PbÞ ¼ 1 ifPa\Pb =; P e2Pa\Pb Fe Ftotal otherwise; (
wherePa\Pbis the set of the common messages between
pat-ternsPaandPb, andeis each message in this common
mes-sage set.Feis the occurrence frequency of each messageein
the ABB-Dev dataset, whileFtotalis defined as the following:
Ftotal¼
X
j2Pa[Pb
Fj:
To illustrate how this distance metric is computed, con-sider an example consisting of two sequential patterns: Pa¼a!b!c!d andPb¼a!b!d. Assume also that
the messages fa; b; cg occur 100 times in the dataset, while the message d occurs only twice. We can compute
jLCSðPa; PbÞj ¼ jfa; bgj ¼2 and jPa[Pbj ¼ jfa; b; c; dgj ¼4,
and, therefore, DLCSðPa; PbÞ ¼124¼0:5. To compute,
DOccðPa; PbÞ, we first computeFtotal¼100þ100þ100þ2¼
302, resulting inDOcc¼100302þ302100þ3022 ¼0:67. These two
dis-tance measures are combined, based on a weightato form the final distance value.
After experimenting with a few different ratios between the two constituent distance measures, we settled on ana value of 0.25. In this way, we weigh the frequency (or rarity) of messages as three times more important than the longest common subsequence between two patterns in clustering them. The distribution of messages in the ABB-Dev dataset is exponential, so we found the existence of the same rare messages to be an important characteristic of the similarity between two patterns.
The distribution of message types in the dataset is expo-nential, so we found message rarity to be an important char-acteristic of the similarity between two patterns.
To specify the number of clusters (i.e., the k in k -medoids), we consider the optimum average silhouette width for differentk. The average silhouette width reflects the average closeness to the centroid for the clustered data points, relative to its closeness to the centroids of neighbor-ing clusters. This metric ranges between1 and 1, where a higher value is indicative of more separable clusters. In order to have a human-interpretable number of clusters, we only examined the average silhouette size for between 10 and 50 clusters. While the overall strength of the clustering was relatively poor, indicated by a negative silhouette width (in the range [0.3,0.1]), we chose a value fork=20, where there is an “elbow” in the average silhouette width curve and adding more clusters does not improve the results. It should be noted, however, that given the high number of input sequences, values ofkthat are an order(s) of magnitude higher than the ones we examined may pro-duce a significantly better clustering, but would also require much more effort for human interpretation.
4.6 Expert Analysis
Two of the authors examined the pattern clusters discovered by the pattern clustering step. The clusters ranged between 1 and 15 different message (or IDE interaction) types in each cluster, and generally represented similar interactions, or sub-patterns consisting of a few interactions, occurring in
slightly different order. The composition of the patterns allowed straightforward human observational analysis of the behavioral patterns associated with each cluster, without the need to perform additional sequence filtering.
The authors were presented with a listing of all of the patterns in each cluster, and asked to characterize each of the clusters in terms of the developer behavior that it repre-sents. There was widespread agreement on the characteriza-tion of the behaviors of the clusters, which we show in Table 1. In certain cases, where there was disagreement or ambiguity, the authors used the data collection tool and Visual Studio to verify that a pattern corresponded to the expected sequence of interactions in Visual Studio. This was also used as a means to determine whether there exists more than one way to produce the same sequence of mes-sages, to reduce the possibility of misleading results.
After characterizing the dataset, the authors used a com-plementary dataset to provide further statistical information on the time that developers took when performing the behav-iors corresponding to each pattern. To calculate these meas-ures, we revisited the original ABB-Dev dataset and identified occurrences of the relevant pattern for which we extracted this additional statistical information. For the meas-ures related to time, we identified occurrences of the pattern both with and without a gap, to avoid the influence on time of any additional noise messages. This ensured that the time sta-tistics for each pattern were not skewed by any sequences with a gap. The result of this analysis was a set of interesting usage patterns that correspond to potential usability smells in the IDE, which we discuss in the next section.
5
M
ININGR
ESULTSIn this section, we highlight a few interesting developer behaviors mined using our workflow and the ABB-Dev IDE usage dataset.1
5.1 Cluster 9: Usage of Grep-Like Search Tools This cluster captures developers’ typical use of the FINDIN
FILES dialog, which implements a string matching
(grep-like) search over the entire open project in Visual Studio. Such a dialog is available in most modern IDEs.
5.1.1 Developers’ Workflow
The patterns in this cluster show typical usage of FIND IN
FILES consisting of users opening the FIND IN FILES dialog,
entering a search query, and pressing the search button. This triggers the FINDRESULTSview, which displays a list of
all of the lines that match the given query. The user can review the lines displayed in this window, which are unranked and unordered. Single-clicking a line in this win-dow opens the file in an IDE editor as a temporary tab, while a double-click creates a permanent presence of the file in the editor tabs.
All of the patterns in this cluster involve behaviors based on the two views: FIND INFILES dialog where the query is
entered, and FINDRESULTSwhere the results were examined.
Other commands such as editing (indicative of search suc-cess) were present in some of the mined patterns, as well as query reformulations (indicative of search failure)—re-visiting the FIND INFILESdialog after clicking on a result in
the FIND RESULTS view. Each of the patterns was observed
across at least 30 developers.
5.1.2 Potential Usage Smell
One behavior that stands out when examining this cluster is that developers commonly review several results, spending considerable time, in each search session. Developers viewed as many as eight consecutive search results before either finding the desired place in the code base or, more likely, abandoning the search. Prior lab studies support this finding, indicating that many searches of this type fail [19]. There were 65 instances in our input ABB-Dev dataset of developers following a TABLE 1
Extracted Clusters and Characterization of the IDE Usage Behaviors They Represent
Cluster Characterization Percentage
of Patterns
1 debugging:shorter length stepping sequences 19%
2 navigation:shorter length usage of ABB’s custom call graph navigation tool 13%
3 debugging:medium length stepping sequences 13%
4 debugging:activities related to stopping at a breakpoint 10% 5 editing:repetitions of opening several files in the solution explorer and edit 8% 6 editing:long length solution explorer and editing interactions 8% 7 navigation:longer length usage of ABB’s custom call graph navigation tool 5% 8 debugging:a mix of stepping and running to breakpoints 4% 9 searching:usage of Visual Studio’s Find in Files tool 3% 10 navigation:medium length usage of ABB’s custom call graph navigation tool 2% 11 debugging:a mix of activities related to starting to debug (e.g., setting breakpoints, starting the debugger) 2% 12 debugging:finishing debugging followed by setting breakpoints, editing, building and related views 2% 13 editing:combinations of editing, building and related views (e.g., viewing the error list) 2% 14 debugging:finishing debugging followed by editing, debugging and other activities 1%
15 debugging:longer length stepping sequences 1%
16 editing/debugging:editing followed by starting to debug 1% 17 editing/building:general editing behavior (e.g., building, looking at errors, editing and recompiling) 1% 18 navigation:very long usage sequences of ABB’s custom call graph navigation tool 1% 19 editing/navigation:editing and navigating using the next and previous IDE buttons < 1% 20 searching:find all reference and find symbol searches < 1%
1.The dataset of mined interaction patterns is available at: http:// vcu-swim-lab.github.io/mining-vs
search by viewing at least eight search results with a median time of 50 seconds for this activity.
Analysis of the time that individuals spent focused on each clicked result indicates that the time between result clicks is quite short, an average of 10 to 12 seconds. This pro-vides further proof that most of the individual clicked results were not of value to the developers, for their current task.
Our analysis shows that patterns of multiple search result views are: 1) common among developers, 2) relatively time consuming, wasting a median time of almost a minute of developer time, and 3) likely to be the result of subopti-mal retrieved search results, as the developers moved fairly quickly between each click.
5.2 Cluster 15: Stepping Numerous Times with the Debugger
5.2.1 Developers’ Workflow
When using Visual Studio to debug, after the debugger has stopped their program at a breakpoint, developers com-monly proceed executing the program in the debugger using the STEPOVER and STEPINTO commands. Both
com-mands execute a single statement of code, and while the S TE-PINTO command follows method invocations, the STEPOVER
command remains at the same level of the call path. All of the patterns in Cluster 15 consist of sequences of this set of stepping commands.
5.2.2 Potential Usage Smell
The most surprising finding in examining this cluster is the sheer number of step commands that users tended to exe-cute in succession. While we expected that users may step through several statements after encountering a breakpoint, this cluster contained 19 pattern instances with more than 50 debugging step commands. These were also frequent in the original ABB-Dev dataset; a pattern of 75 steps occurred uninterrupted 23 times in the dataset.
To detect potential usage smells, our main goal was to detect long sequences of repetitive STEPOVER or STEPINTO
commands where subsequent commands occurred within a very short time frame. There were numerous instances of the commands being issued with one second or less between them. The reasoning is that, if the timespan between two commands is very short, then the developer could not have performed any substantial analytical task, so the developer was most likely just pressing buttons at a high pace for a prolonged time.
Users displayed a tendency to use only specific debug-ging commands, even though more efficient commands are available. Developers rapidly pressed a step command tens of times in a sequence, while use of Visual Studio debugging commands such as RUNTOCURSORor conditional breakpoints
could replace all or many of these individual commands. Additional analysis of individual pattern occurrences in the original ABB-Dev datasets highlights a few related observations. One such observation is that there are large differences between how often certain debugging com-mands are used by the developers in our dataset. A rela-tively small set of debugging events and commands occur in almost all developers, i.e., seven debugging commands/ events occur in90percent or more of all developers. These
are the common set of debugging commands and related events, such as setting and stopping on breakpoints, S TE-PINTO, STEPOVER, and starting, stopping, and restarting the
debugger. Most of the remaining debugging commands occur in a smaller range of developers (30-80 percent of all developers). These include the attach-to-process command, the local variable declarations window, and the call stack window. Most of these commands are of broad applicability and should be considered for recommendation to other developers. Another, very small share of debugging com-mands occurs in less than 30 percent of all developers. These are very domain specific, such as viewing the hexa-decimal display, thread activity, etc., and perhaps are better distributed via an IDE extension.
We also investigated whether developers using a richer palette of debug commands exhibited less repetitive behav-ior by using linear regression relating each developer’s number of distinct debug commands to the time they require to execute a fixed length sequence of stepping com-mands. More precisely, we measured the mean timespan yðiÞ until 16 stepping commands occurred for each devel-operi. We obtained a mean value ofyof 20.1 s and a stan-dard deviation of 14.3 s, leaving on average less than 1.5 s between two stepping commands. Let nðiÞ be all debug commands executed by developeri. This variable is used to normalize among developers with different amounts of data contribution to the data set. The variable xðiÞ is the number of different commands used by developer i. We used the following model y¼ax=nþ, where is assumed to be Gaussian noise. We obtained ap-value fora of 0.000027 and an adjusted R-squared value of 0.202.
Therefore, we conclude that developers using fewer dis-tinct debugging commands behave more repetitively. 5.3 Cluster 19: Editing Files in the Working Set
5.3.1 Developers’ Workflow
The working set, consisting of all of the currently open tool windows and files in Visual Studio, is continually managed by the environment. The IDE NAVIGATOR DIALOG, shown in
Fig. 4, is commonly invoked via the Ctrl+Tab keystroke to navigate to the next file in the working set (Ctrl+Shift+Tab navigates to the previous file). The patterns in this cluster show developers opening and subsequently editing one or more files in their current working set using the Ctrl+Tab key and the IDE NAVIGATORWINDOW.
The mined patterns in this cluster consist of repetitions of only two commands: editing and navigating via the IDE
NAVIGATORDIALOG. The behavior is consistent with making
small changes across several of the files of the working set. Patterns ranged between editing one to five files.
5.3.2 Potential Usage Smell
The most notable finding when analyzing this cluster is that users often open unnecessary files when using the working set dialog, exhibited by consecutive invocations of the IDE
NAVIGATORDIALOGwithout editing. These unnecessary files
are opened either in error, or as means of quickly reminding the developer of something, perhaps the name of a type or a method [19], which could have been preserved via some other means, such as active task context [20] or code
bubbles [21]. For instance, in one particular pattern in this cluster, developers use the dialog to navigate to five sepa-rate files to ultimately find the file they wanted to edit. These navigations are relatively quick, spanning only a few seconds, but may still consume valuable developer cogni-tive energy.
We analyzed the patterns in this cluster to measure the success rate in reaching the final destination using the work-ing set dialog, by identifywork-ing subpatterns where a dialog invocation preceded an edit. We considered one use of the dialog preceding an edit to be optimal, as the user found the file to edit, and any additional uses of the dialog preceding the edit to be unnecessary, as the user had to continue using the dialog to reach the relevant file. Using this approach, we found that opening files via the working set dialog was unnecessary 47 percent of the time in the extracted patterns. Ideally, the IDE and its working set support should enable developers to rapidly transition to edit files, without the need for several stops along the way.
Visual Studio working set support is not optimal, as many times files are opened without subsequent editing.
6
S
URVEYS
TUDYTo assess and shed more light on the findings from our pat-tern mining approach to analyzing IDE interactions, we conducted a survey of 51 developers at ABB, Inc., to query their self-efficacy in using the IDE for three purposes: searching code with FIND IN FILES, navigating within their
active file set, and stepping with the debugger. To solicit participation, the survey was advertised via e-mail to 661 developers at several of the company’s product develop-ment sites across the globe. The 51 respondents had an aver-age of 8.6 years (standard deviation of 5.9 years) of experience in using Visual Studio. The majority (> 80 per-cent) of developers were using one of the three most recent versions of the environment (i.e., Visual Studio 2012, 2013 & 2015) for their daily work. On a scale of 1 to 5, where 1
denotes not usable and 5 denotes extremely usable, the developers found Visual Studio as more usable than not, giving it an average score of 3.9 (standard deviation of 0.9). 6.1 Find in Files Search
We first asked the survey respondents a series of questions related to their use of the FIND INFILEStool to perform
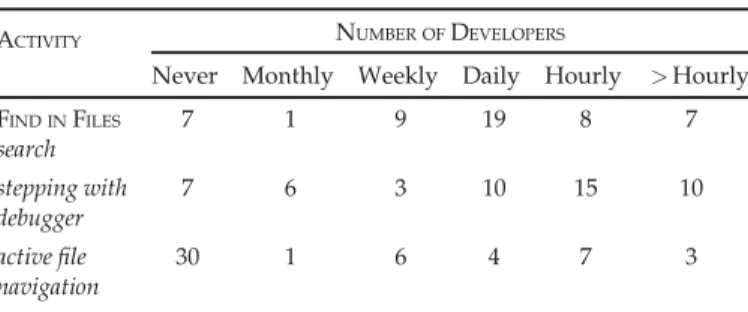
proj-ect-wide (solution-wide in Visual Studio language) searches. The tool was used for this purpose by 44 of the 51 developers surveyed, with many developers using the tool frequently, or at least once daily, as shown in the first row of Table 2, which lists the number of developers that reported performing each activity of interest to our study at specific time frequencies.
The developers indicated a wide distribution of the num-ber of results that they reviewed in each FIND INFILESsearch
session. Table 3 displays the distribution of respondents’ answers, which indicates that there are 20 percent of devel-opers (9 out of 44) that examine many (more than 5) results before locating a relevant block of code to their task.
We also asked the respondents to describe any difficul-ties they may have faced in using FIND INFILESand received
10 such responses. While some respondents complained about the tool’s speed, or its key bindings in different Visual Studio versions, several (n¼8) developers complained about the simplistic text-based UI that this tool uses to pres-ent its results, stating, for example:
The output is too cluttered. Results could be bit more organized in terms of folder/solution/projects [.It] needs to be better than notepad++ for an IDE.
It is difficult to find anything in Find Results since the results and their line numbers are not put nicely into col-umns. The results look like a mess.
6.2 Stepping with Debugger
For the part of the survey that inquired about debugger use, we intended to determine if long stepping chains were
TABLE 2
Developer Self-Expressed Frequencies of Performing the Three Activities of Interest
ACTIVITY NUMBER OFDEVELOPERS
Never Monthly Weekly Daily Hourly >Hourly FIND INFILES search 7 1 9 19 8 7 stepping with debugger 7 6 3 10 15 10 active file navigation 30 1 6 4 7 3
Fig. 4. A screenshot of the IDE NAVIGATORDIALOGin visual studio.
TABLE 3
Responses to Question: ‘On Average, How Many Search Results Do You Need to Examine Before Locating
a Useful Program Element?’
NUMBER OFDEVELOPERS
One
Result ResultsTwo ResultsThree ResultsFour ResultsFive than 5More
prevalent among developers and the reason for the absence of usage of conditional breakpoints and the RUN TOCURSOR
command. Recall that in Table 2, the results shows that debugger use is indeed prevalent among developers, with a few exceptions. Interestingly, developers self-reported usage of many consecutive stepping commands, as shown in Table 4, which ranged relatively similar to what we observed in our interaction log analysis.
As indicated in Table 5, the usage of conditional break-points was relatively infrequent, though the feature was something that many developers had used in the past. On the other hand, there were a few more developers using the
RUN TOCURSORcommand frequently.
On an open ended question of how they used stepping and the RUN TO CURSORto debug a program, a few of the
respondents indicated that they rarely need the RUN TOC UR-SORcommand, and that its functionality can be duplicated
by adding another breakpoint, such as:
Break to the beginning of interesting segment. Hitting F10 to the end and checking values between. I use new break point and F5 rather than RunToCursor. [...]
Another respondent hinted at the purpose for long step-ping sessions, which is to comprehend what a block of code is doing at runtime, one statement at a time:
I use the step-commands to explore the code and what is happening. Until I get an “AHA” experience [...]
For conditional breakpoints, on an open-ended question asking for any difficulties they may have faced in their use, the respondents raised two issues: 1) the slow-down that these breakpoints inflict on the debugger and 2) the fact that the conditions are difficult to express and are not error checked. Specifically, developers stated that:
The debugging is slowed down so much that I have stopped using it. It would be very useful for me, since I often want to see what happens at some specific state in a longer run.
I often had the problem that the condition statement could not be evaluated. Then the debugger did not stop and I had to check the condition again.
6.3 Active File Navigation
The survey asked developers about their usage of the active file navigation capability in Visual Studio, usually triggered via the Ctrl+Tab or Ctrl+Shift+Tab keystrokes, which navigate to the next and previous file in the list, respectively. The frequency of use is shown in the second row of Table 2, and is considerably less prevalent than the use of the search tool.
As before, we asked the developers who used active file navigation about how many files they typically visit before locating the relevant file. The distribution of responses, shown in Table 6, clearly shows that most developers do not experience finding the necessary file on the first try.
When asked the open-ended question about the difficul-ties they may have faced in using active file navigation in Visual Studio, most of the respondents gave no answer or stated they had experienced none. Only one respondent described a usability problem with the following statement:
The list is too long sometimes.
7
D
ISCUSSION ANDI
MPLICATIONSIn general, the surveyed developers’ self-reported tenden-cies confirmed the observations made via our pattern min-ing of IDE interactions, providmin-ing more confidence in the validity of this analytic technique for IDE interaction data. Surprisingly, many developers seemed aware of the high number of results that they examined during search with
FIND INFILES, the number of files they navigated to before
reaching their destination, and the multitude of consecutive steps they performed with the debugger. However, devel-opers often did not necessarily consider these behaviors as inefficient or a nuisance, often answering “No difficulty” to our questions about problems with a specific feature. For instance, in active file navigation, a number of the surveyed developers reported no difficulty, when opening several unrelated files before locating the file they were looking for. For stepping with the debugger, while the surveyed devel-opers seemed to always find value in numerous stepping actions, we believe that, in practice, a sequence of useful step commands where the state of a (set of) variable is observed by the developer is followed or preceded by a (potentially large) sequence of quick steps to get past irrele-vant statements. We further believe that developer is usu-ally unaware or does not consider these extra steps as additional work.
This unawareness of inefficient workflows is common in usability analysis of software, especially in situations where TABLE 4
Responses to Question: ‘On Average, How Many StepOver or StepInto Commands Do You Execute in One Sequence Before
You Resume Execution or End the Debugging Session?’
NUMBER OFDEVELOPERS 0-10 Steps 10-20 Steps 20-30 Steps 30-40 Steps 40-50 Steps More than 50 15 14 10 2 1 2 TABLE 5
Developer Self-Expressed Frequencies in Using Conditional Breakpoints and the RUN TOCURSORDebugger Command
CAPABILITY NUMBER OFDEVELOPERS
Never Monthly Weekly Daily Hourly >Hourly
conditional breakpoints 13 11 11 8 0 1 RUN TO CURSORcommand 11 4 7 11 7 4 TABLE 6
Responses to Question: ‘On Average, How Many Files Do You Navigate to Before Opening the File You Are Looking For?’
NUMBER OFDEVELOPERS One File Two Files Three Files Four Files Five Files More than 5 5 4 5 3 1 3
users are not actively performing the task that they were being surveyed about [22]. In these cases, software users commonly forget and ignore minor nuisances that are quickly resolved via an extra set of clicks within a short timespan. It is also difficult for the surveyed developers to imagine the possibility of an alternative interface design, where that specific interaction with the software would be made more efficient.
7.1 Find in Files Search
When searching using FIND INFILES, several of the
develop-ers in the survey agreed that the tool’s UI had several imper-fections in the way that it presents its results. One reason for this poor presentation is that the retrieved result set is unranked, which can result in an overwhelming amount of information when the query string frequently occurs in the code base. Several researchers have proposed within-IDE software search tools based on information retrieval tech-nologies that, like web search tools, provide a ranked list of results making it easier for developers to reach relevant code quicker [23], [24]. Others have suggested improved user interfaces to allow quicker click-less review of the search results [25]. While such advances, among others, in code search have been discussed in the software mainte-nance research community for several years, most IDEs, in their default configurations, still rely on string matching approaches like FIND INFILES.
7.2 Stepping with Debugger
When debugging, the surveyed developers justified their low usage of conditional breakpoints as due to poor perfor-mance and the difficulty in catching errors in the conditions. We believe that the poor performance is accidental, and spe-cific to the Visual Studio versions used by the developers in our studies, as evaluating a condition at a specific point in the code, unless it is performed within a tight loop, should present little difficulty to modern hardware. The difficulty in catching errors in the conditional can be remedied by log-ging the range of values of the constituent variables of the breakpoint’s condition, enabling post-hoc analysis if the breakpoint is never triggered.
There was a significant number of developers that reported that they never used conditional breakpoints or the RUN TO CURSOR command, likely because they were
unaware of them. Our data analysis also showed that the distribution of debugging command use was skewed, and many useful commands are rarely used. Ideally, developers would know every command and use that command at the appropriate time. In reality, as shown by Murphy-Hill et al. [9], they often know and use only a small subset of the overall command set.
While it is unrealistic to expect developers to memorize every command, we feel that there is a minimum subset that should be known. We suggest two solutions. First, developers should be trained to use an IDE. Unfortunately, according to our experience, training on how to use this powerful tool is surprisingly sparse in most industrial or academic environments. Second, the commands themselves should be made more visible and intuitive to invoke. Visual Studio 2015 has already begun to do this. Conditional break-points, formerly an almost hidden feature in the UI is now
highlighted through an icon that is shown as soon as a breakpoint is created.
7.3 Active File Navigation
As we examined active file navigation in Visual Studio, we noticed that it is easy to open the incorrect files due to the lack of additional information about each file on the IDE N
AV-IGATORDIALOGscreen. For instance, if the working set dialog
would provide a preview of a code snippet for a selected file, developers may be more likely to choose the correct file on the first attempt. Additionally, the dialog only shows the file name instead of the relevant method or field name, which makes the user map between files and program elements themselves. In the past several versions of Visual Studio, and especially the 2015 release, increased visual support, using the progressive disclosure interaction technique [26], has appeared in many of the IDE’s tools (e.g., the call graph fea-ture surfaced in the CodeLens extension).
8
T
HREATS TOV
ALIDITYOur IDE usage data analysis is potentially susceptible to sev-eral threats, both internal and external. One internal threat is that our ABB-Dev dataset only records certain IDE com-mands and events, while it does not, most notably, record the contents of the IDE editor or interactions with any other applications outside of the IDE. Therefore, it is possible that we missed or misunderstood certain regularly occurring developer behaviors. To mitigate this threat, two of the authors recreated the patterns that we focused on to ensure their reproducability and plausability. The developer survey also lent support to the validity of some of the mined behav-iors. The ABB-Dev dataset we used is also unbalanced, repre-senting the interaction data of some developers more than others. This threat is mitigated by the substantial number of developers in the dataset and by the probabilistic nature of the sequential pattern mining we perform.
Another threat comes from the fact that we did not con-trol for different versions of the Visual Studio IDE. While we know from internal ABB information that most of the data reflected the most recent two versions of the IDE (Visual Studio 2012 and 2013), even these could have dif-fered, affecting our final conclusions. Finally, another threat comes from the choice of parameters in our analysis, includ-ing the length of patterns to filter and the weight of the measures in the final distance function. For each of these parameters, we examined samples of data or considered rel-evant statistics to choose reasonable values to detect inter-esting usage patterns and smells. However, more study is needed to verify that these parameter choices yield the strongest results.
Externally, we collected data from196developers for a period of less than12months from a single company. The results, drawn from a limited number of users and time length, may not be generalizable to other Visual Studio users for a longer period of time. Another external threat is that we investigated only the Visual Studio IDE and there-fore the conclusions may not be applicable to other IDEs. However, a few of the most popular IDEs offer a very simi-lar set of tools, so some of the mined usage smells may apply more broadly than Visual Studio.
9
C
ONCLUSIONS ANDF
UTUREW
ORKThis paper presents a novel approach for mining sequences of actions from IDE usage data. Our approach uses scalable sequential pattern mining, coupled with pre-processing and post-processing steps intended to reveal interesting IDE usage scenarios from many developers. A selection of those scenarios is thoroughly analyzed, via expert opinion and a developer survey, to yield more understanding of those pat-terns, which span code search, file navigation and debug-ging. The result is a set of recommendations for Visual Studio improvement in each of these categories.
As future work, we plan to investigate different ways to tailor the mining approach to a more fixed set of behaviors (e.g., related to debugging). We will also explore approaches to changing some of the post-processing steps to include shorter sequences in the subsequent manual analysis.
A
CKNOWLEDGMENTSWe would like to thank Will Snipes for help in administer-ing the study and for collectadminister-ing the usage dataset. We also thank the numerous developers at ABB, Inc. that contrib-uted their IDE usage data and answered our survey.
R
EFERENCES[1] S. Negara, M. Codoban, D. Dig, and R. E. Johnson, “Mining fine-grained code changes to detect unknown change patterns,” in
Proc. 36th Int. Conf. Softw. Eng., 2014, pp. 803–813. [Online]. Avail-able: http://doi.acm.org/10.1145/2568225.2568317
[2] M. Vakilian and R. E. Johnson, “ Alternate refactoring paths reveal usability problems,” in Proc. 36th Int. Conf. Softw. Eng., 2014, pp. 1106–1116. [Online]. Available: http://dl.acm.org/citation. cfm?doid=2568225.2568282
[3] G. Murphy, M. Kersten, and L. Findlater, “How are Java software developers using the Eclipse IDE?” IEEE Softw., vol. 23, no. 4, pp. 76–83, Jul./Aug. 2006.
[4] E. Murphy-Hill, C. Parnin, and A. P. Black, “How we refactor, and how we know it,”IEEE Trans. Softw. Eng., vol. 38, no. 1, pp. 5–18, Jan./Feb. 2012. [Online]. Available: http://ieeexplore.ieee.org/ lpdocs/epic03/wrapper.htm?arnumber=6112738
[5] M. Spiliopoulou, “Web usage mining for Web site evaluation,” Com-mun. ACM, vol. 43, no. 8, pp. 127–134, Aug. 2000. [Online]. Available: http://portal.acm.org/citation.cfm?doid=345124.345167
[6] The Eclipse Foundation-Filtered UDC Data. (2016). [Online]. Avail-able: http://archive.eclipse.org/projects/usagedata, Accessed on: Feb. 4, 2016.
[7] Codealike: Powerful metrics for high-performance developers. (2016). [Online]. Available: https://codealike.com, Accessed on: Feb. 4, 2016.
[8] Lijie Zou, M. Godfrey, and A. Hassan, “Detecting interaction coupling from task interaction histories,” inProc. 15th IEEE Int. Conf. Program Comprehension, Jun. 2007, pp. 135–144. [Online]. Available: http://ieeexplore.ieee.org/lpdocs/epic03/wrapper. htm?arnumber=4268248
[9] E. Murphy-Hill, R. Jiresal, and G. C. Murphy, “ Improving soft-ware developers’ fluency by recommending development envi-ronment commands,” in Proc. ACM SIGSOFT 20th Int. Symp. Found. Softw. Eng., 2012, Art. no. 42. [Online]. Available: http:// dl.acm.org/citation.cfm?doid=2393596.2393645
[10] W. Snipes, V. Augustine, A. R. Nair, and E. Murphy-Hill, “Towards recognizing and rewarding efficient developer work patterns,” in
Proc. Int. Conf. Softw. Eng., 2013, pp. 1277–1280. [Online]. Available: http://portal.acm.org/citation.cfm?id=2486983
[11] W. Snipes, A. R. Nair, and E. Murphy-Hill, “Experiences gamify-ing developer adoption of practices and tools,” inProc. 36th Int. Conf. Softw. Eng., 2014, pp. 105–114. [Online]. Available: http:// doi.acm.org/10.1145/2591062.2591171
[12] S. Amann, S. Proksch, S. Nadi, and M. Mezini, “A study of visual studio usage in practice,” inProc. 23rd IEEE Int. Conf. Softw. Anal. Evolution Reengineering, 2016, pp. 124–134.
[13] Y. Yoon and B. A. Myers, “Capturing and analyzing low-level events from the code editor,” inProc. 3rd ACM SIGPLAN Workshop Evaluation Usability Programming Languages Tools, 2011, pp. 25–30. [Online]. Available: http://doi.acm.org/10.1145/2089155.2089163 [14] G. Khodabandelou, C. Hug, R. Deneckre, and C. Salinesi, “Unsupervised discovery of intentional process models from event logs,” in Proc. 11th Work. Conf. Mining Softw. Repositories, 2014, pp. 282–291. [Online]. Available: http://dl.acm.org/ citation.cfm?doid=2597073.2597101
[15] A. Vargas, H. Weffers, and H. V. da Rocha, “ A method for remote and semi-automatic usability evaluation of web-based applica-tions through users behavior analysis,” inProc. 7th Int. Conf. Meth-ods Techn. Behavioral Res., 2010, pp. 19:1–19:5. [Online]. Available: http://portal.acm.org/citation.cfm?doid=1931344.1931363 [16] D. Perera, J. Kay, I. Koprinska, K. Yacef, and O. Zaiane,
“Clustering and sequential pattern mining of online collaborative learning data,” IEEE Trans. Knowl. Data Eng., vol. 21, no. 6, pp. 759–772, Jun. 2009. [Online]. Available: http://ieeexplore.ieee. org/lpdocs/epic03/wrapper.htm?arnumber=4564464
[17] P. Fournier-Viger, A. Gomariz, T. Gueniche, A. Soltani, C.-W. Wu, and V. S. Tseng, “SPMF: A Java open-source pattern mining library,”J. Mach. Learn. Res., vol. 15, pp. 3389–3393, 2014. [Online]. Available: http://jmlr.org/papers/v15/fournierviger14a.html [18] I. Miliaraki, K. Berberich, R. Gemulla, and S. Zoupanos, “Mind the
gap: Large-scale frequent sequence mining,” in Proc. ACM SIG-MOD Int. Conf. Manage. Data, Jun. 2013, pp. 797–808.
[19] A. J. Ko, B. A. Myers, M. J. Coblenz, and H. H. Aung, “An explor-atory study of how developers seek, relate, and collect relevant information during software maintenance tasks,” IEEE Trans. Softw. Eng., vol. 32, no. 12, pp. 971–987, Dec. 2006.
[20] M. Kersten and G. C. Murphy, “Using task context to improve programmer productivity,” inProc. 14th ACM SIGSOFT Int. Symp. Found. Softw. Eng., 2006, pp. 1–11.
[21] A. Bragdon, et al., “Code bubbles: Rethinking the user interface paradigm of integrated development environments,” in Proc. 32nd ACM/IEEE Int. Conf. Softw. Eng., 2010, pp. 455–464.
[22] J. Nielsen and J. Levy, “Measuring usability: Preference versus performance,”Commun. ACM, vol. 37, no. 4, pp. 66–75, Apr. 1994. [Online]. Available: http://doi.acm.org/10.1145/175276.175282 [23] B. Dit, M. Revelle, M. Gethers, and D. Poshyvanyk, “Feature
loca-tion in source code: A taxonomy and survey,” J. Softw. Mainte-nance Evolution: Res. Practice, vol. 25, pp. 53–95, 2013.
[24] D. Shepherd, K. Damevski, B. Ropski, and T. Fritz, “Sando: An extensible local code search framework,” inProc. ACM SIGSOFT 20th Int. Symp. Found. Softw. Eng., 2012, pp. 15:1–15:2.
[25] J. Wang, X. Peng, Z. Xing, and W. Zhao, “Improving feature loca-tion practice with multi-faceted interactive exploraloca-tion,” inProc. Int. Conf. Softw. Eng., 2013, pp. 762–771. [Online]. Available: http://dl.acm.org/citation.cfm?id=2486788.2486888
[26] J. Nielsen, “Progressive disclosure,”Jakob Nielsen’s Alertbox, 2006. [Online]. Available: http://www.nngroup.com/articles/progres-sive-disclosure/
Kostadin Damevskireceived the PhD degree in computer science from the University of Utah, Salt Lake City. He is an assistant professor with the Deparment of Computer Science, Virginia Commonwealth University. Prior to that he was a faculty member at Virginia State University and a postdoctoral research assistant with the Scientific Computing and Imaging institute, University of Utah. His research focuses on software mainte-nance and empirical software engineering, applied to a variety of domains, ranging from industrial software systems to high-performance computing. David C. Shepherdis a senior principal scientist with ABB Corporate Research where he leads a group focused on improving developer productiv-ity and increasing software qualproductiv-ity. His back-ground, including becoming employee number 9 at a successful software tools spinoff and working extensively on popular open source projects, has focused his research on bridging the gap between academic ideas and viable industrial tools. His main research interests to date have centered on software tools that improve develop-ers search, and navigation behavior.
Johannes Schneiderreceived the PhD degree from ETH Zurich, in 2011. He was a postdoc with IBM’s Zurich Research Laboratory in the Informa-tion Analytics Group. Now, he is a scientist with ABB Corporate Research, Switzerland. In Octo-ber 2016, he is going to join the University of Liechtenstein as an assistant professor in data science.
Lori Pollock is a professor in computer and information sciences, University of Delaware and ACM Distinguished Scientist. Her research focuses on software artifact analyses for easing software maintenance, testing, and developing energy-efficient software, code optimization, and computer science education. She leads a team to integrate CS into K-12 through teacher profes-sional development in the CS10K national efforts. She was awarded the ACM SIGSOFT Influential Educator award 2016 and University of Dela-ware’s Excellence in Teaching Award, E.A. Trabant Award for Women’s Equity in 2004. She serves on the Executive Board of the Computing Research of Women in Computing (CRA-W), which was honored with the National Science Board’s 2005 Public Service Award to an organiza-tion for increasing the public understanding of science or engineering. " For more information on this or any other computing topic, please visit our Digital Library atwww.computer.org/publications/dlib.