Asset Lifecycle Plans
December 2010
P a g e 2
Lifecycle Plan Summary
D e c e m b e r 2 0 1 0
P a g e 3
Contents:
1 Introduction to Lifecycle Planning ... 4
1.1 Primary Purpose of Lifecycle Planning ...4
1.2 Secondary Purpose ...4
1.3 Output from Lifecycle Planning...4
1.4 The Importance of Lifecycle Plans...4
1.5 Lifecycle Planning Layout ...4
D e c e m b e r 2 0 1 0
P a g e 4
1
Introduction to Lifecycle Planning
1.1 Primary Purpose of Lifecycle Planning
The purpose of a lifecycle plan is to document how a particular asset is managed. In doing so definition is created of the standards that are applied and the processes that are used as a reference for those who may need to know.
1.2 Secondary Purpose
Lifecycle plans provide secondary benefits in enabling institutional knowledge to be captured. Many authorities currently rely heavily upon the knowledge and
judgement of key personnel. Documenting the management processes used for each asset group records this knowledge and enables it to be shared and developed.
1.3 Output from Lifecycle Planning
The output from the lifecycle planning process is long term prediction of the cost of the continued management and operation of the asset in question. These should be in the form of financial projections linked to stated levels of service (reported using appropriate performance measures).
1.4 The Importance of Lifecycle Plans
Lifecycle plans are the core of a road asset management plan. They contain the critical detail that enables the wider asset management practices such as long term cost projection, performance management and risk management to be applied.
1.5 Lifecycle Planning Layout
The lifecycle planning section of this Transport Asset Management Plan is divided into three sections as follows:
1. Lifecycle Planning Summary
This describes the required information to achieve the above lifecycle plan output i.e. a long term prediction of the cost of the continued management and operation of the asset. We strive to manage all the assets using a consistent process and these details will be included within the summary section. 2. Individual Lifecycle Asset Management Plans
Individual lifecycle management plans will provide the main details and
assumptions of the asset using the layout from the Summary section. Sections which aren’t needed to manage the asset will be omitted. Sections where our standard process is used with no exceptions will also be omitted. Any
exceptions to the processes described in the lifecycle planning summary will be included in the individual asset plan.
D e c e m b e r 2 0 1 0
P a g e 5 3. Appendices
All additional information from specific details, workings and reports will be included in the Appendix and referenced in the above two documents.
D e c e m b e r 2 0 1 0
P a g e 6
2
Lifecycle Plan Summary
Ref Section Name Section Description
1 Current Status What is the current status of this asset group?
1.1 Current Issues Current causes of concern, or alternatively opportunities for improvement that aren’t currently being taken that still need resolving.
1.2 Current Asset
Management Strategies
Current strategies in place to address the previous ‘Current Issues’. These provide acknowledgement that asset management activities are already in hand with these strategies acting as a starting point.
2 The Asset What Assets do the Council Own?
2.1 Inventory The extent of the asset is presented in appropriate groups eg. asset types, geographical locations, road classification etc which relate to the specific asset management approach used by the Council.
The reliability of the information is to be included with all inventories. 2.2 Asset Register Details of the definitive record of the asset owned by the council?
2.3 Asset Growth Average growth of total assets over a minimum of five years aids the projection of long term costs. Additional future growth predictions increase the accuracy of these projections.
Our Approach Asset Information Management varies from asset to asset. There currently aren’t any documented processes for collecting and maintaining the existing information. An Asset Management Information Strategy covering all information types is currently under development with the aim of determining the information required to be held for each asset, the information currently held, where and in what format, the missing information, the collection methods for the missing information and any proposed changes to the storage method. This strategy covers all assets and therefore will be listed as an Improvement Action in the main TAMP
document only. As asset specific improvement actions are developed they will be added to the relevant lifecycle plan.
3 Service Expectations
What is this asset group required to do? 3.1a Customer
Perceptions
What do people think of this asset?
What are customer perceptions of the management of this asset group? Our Approach The process for identification and alignment with customer expectations is
achieved through a customer survey or public consultation exercise.
The National Highways & Transport (NHT) Survey is a postal survey, carried out by Ipsos MORI, which is completed by 76 English authorities. The survey is organised under themes linked to national (LTP2) shared transport priorities and other important highway and transport related topics.
3.1b Customer Perceptions
What is the level of customer complaint in relation to this asset? Customer Project Feedback
Post scheme satisfaction surveys were carried out on 3 schemes in 2009-10 and showed an average satisfaction of 84.3%.
Our Approach
Customer Relationship Management
Customer Relationship Management is contained within the IMIS system. All customer contacts, service requests and progress made in satisfying these are recorded on the system. IMIS enables front-line staff to present consistent and up-to-date information to customers.
The Control Centre staff collects details of the caller, defect and location and enter into IMIS. Onsite inspections are completed and if work is required, details are entered into Works Manager. On completion of the task, signoff must be completed individually in both IMIS and Works Manager.
3.2 Council Goals
and Objectives
Our Corporate Plan identifies the objectives and priorities that it aims to complete over a set period of time. The TAMP and lifecycle plans show how the assets
D e c e m b e r 2 0 1 0
P a g e 7 Ref Section Name Section Description
contribute to achieving the Corporate Objectives and Priorities.
Our Approach Each assets lifecycle plan contains a flow diagram showing the linkage between the asset specific priorities and the Corporate Priorities.
3.3 Use The current volume of use and any predicted future events that may cause a
change to the method of management are described in this section.
Growth information provides an idea of the speed of change in the previous five years. The capability of the current resources to meet the existing growth and any future growth provides a starting point for deciding the long term needs of the asset.
3.4 Safety Considerations
Role of the asset in delivering a safe road network and where applicable management processes utilised to achieve any safety targets.
Injury collision statistics are included with any recurring contributory factors associated with the form and condition. A list of collision types with associated remedies and installation and future maintenance costs are included for long term cost projection.
Our Approach We have a rolling programme of collision investigation and prevention projects to improve the safety and operation of the highway network. Sites for concern are primarily identified using the Council's road collision database.
3.5 Utility Activity The purpose of this section is to highlight the influence that this activity has on both the ability to produce long term plans and forecasts and their content. Utility activity can have a major effect on the maintenance and management of the asset. Although not yet quantified it is believed that there is a significant increase in the number of defects found following the disturbance of the surface due to utilities. This is apparent even when the utility has reinstated the surface to the required standard. The utility coordination process, scale of activities and future trends will provide the information needed to calculate the influence on Staffordshire’s assets.
Our Approach
3.6 3rd Party Claims Costs and trends of 3rd party claims.
The interrogation of third party claims can aid in the determination of recurrent faults within the highway, the details presently held record the location and details of the claim but the information is not used when identifying or prioritising works. Our Approach 3rd Party Claims (All Assets)
Year Total No. No. Refuted No. Reserve Reserve
Amount No. Paid
Total Paid 2005-06 454 11 £317,938 94 £842,547 2006-07 510 34 £1,275,405 95 £592,927 2007-08 674 66 £517,440 113 £280,147 2008-09 746 194 £1,192,067 83 £133,684 2009-10 784 664 £1,474,417 26 £8,993 3.7 Environmental Considerations
Environmental requirements for each asset with associated effects on the short and long term planning.
3.8 Network Availability Considerations
Requirements placed upon the management of this asset in terms of ensuring network availability?
Our Approach We have a list of 1003 Traffic Sensitive locations which are currently indicated by the field IfTrafSens, in the exported Staffordshire NSG. All locations are located as ‘all day / every day’.
The GIS team are currently awaiting the approval of an Improvement Action to update the periods of traffic sensitivity.
D e c e m b e r 2 0 1 0
P a g e 8 Ref Section Name Section Description
Considerations term planning.
Our Approach We do not have any formal policy which requires certain construction or material standards for differing amenity areas.
4 Management Practices
What standards are applied to the management of this asset group? 4.1 Policies Council policies which affect the management of the asset
4.2 Inspection Regime
The significant components of the Inspection Regime which affect the asset management of the asset including frequency of inspections, inspectors training or qualifications, output and compliance with Codes of Practice.
Our Approach We monitor the safety of the highway network following their ‘Highway Safety Inspection Code of Practice (HSICP) last revised in October 2007. This is based on the recommendations of Well Maintained Highways, Code of Practice for Highway Maintenance Management, July 2005. The frequencies of inspections are described in Table 4.1.
Table 4.1: Frequency of Safety Inspections Road Category Hierarchy Description Definition Inspection Frequency C1 Strategic Route
Principal ‘A’ roads that form part of a strategic network at a regional level.
Monthly (driven) C2 Main
Distributor
Remaining ‘A’ roads Monthly (driven) C3 Secondary
Distributor
‘B’ roads, ‘C’ roads with a total traffic flow > 1000 in a 12hr period, unclassified urban bus routes with an hourly or more frequently service
Monthly (driven)
C4 Link Road Remaining ‘C’ roads, roads linking the main and secondary distributor network, ‘D’ & ‘U’ roads with exceptionally high traffic flow, industrial estate service roads, residential distributor roads with considerable H.C.V. flow
3 Monthly (driven)
C5 Local Access Road
Remaining ‘D’ & ‘U’ roads ie. residential loop roads, housing estate roads, residential cul-de-sacs, rear access lanes, green lanes lay-bys.
Annual (driven / walked)
4.3 Condition Assessment
Condition assessments provide an indication of the remaining life of an asset. Assessment procedures differ with each asset and must therefore be described including frequencies and inspectors training or qualifications.
A list of results and interpretations for a minimum of five previous surveys provides an understanding of how the asset is progressing through its lifecycle and whether the condition targets are achievable.
4.4 Construction / Asset Acquisition
How are new assets acquired?
The process and standards applied to ensure newly acquired assets have a certain level of condition.
The whole of life costs assessment used at the time of design of new assets enables the Council to ensure future maintenance requirements can be completed within the budget.
Our Approach New assets are typically acquired from either adoption or from taking over improvement works completed by contractors on behalf of the council. This is managed through using Section 38, 278 or 106 legal agreements. Newly constructed 'adoptable' streets are only adopted once they meet current council specifications.
At present the long term costs of new works are not assessed and the ongoing maintenance liability is not included within the design calculations or added to the service plan. This can lead to the addition of new assets that have overly onerous ongoing maintenance requirements.
There is currently no process in place for updating the RMS when internal works are completed which entail a change to the existing infrastructure. The Asset Data Management Team are currently developing an Asset Data Management Strategy
D e c e m b e r 2 0 1 0
P a g e 9 Ref Section Name Section Description
which will include a process for obtaining accurate inventory information to ensure RMS is maintained.
It is the responsibility of the Network Manager to inform the safety inspectors of any newly acquired assets such that they can be included on the inspection programme. At present there is no formal procedure for this action and no measure of performance.
4.5 Routine Maintenance
Routine repair categories, specific response times and target compliance rate. Our Approach Routine Maintenance treatments are undertaken to ensure the asset is
maintained at a minimum service level.
Defects are identified through customer contact reports and the Highway
Inspection Regime as detailed in the ‘Highway Safety Inspection Code of Practice (HSICP)
There are six Response Categories which are based on the Highway Maintenance Code of Practice. The type of treatments selected will differ according to the urgency of repair. The Response Categories are:
Table 4.1: Category Response Times Category / Defect Response
Cat 1 / Def 1A Make the defect safe at the time of inspection (ie. sign and cone off) and summon a maintenance crew to break off their existing work to carry out immediate repairs.
Cat 1 / Def 1B Request a maintenance crew to make the site safe or carry out repairs within 24 hours
Cat 1 / Def 1C Maintenance crew to make the site safe and make arrangements for permanent repairs to be carried out within 28 days.
Cat 2 / Def 2 Make safe or repair in 7 calendar days
Cat 2 / Def 3 Repair within 28 calendar days
Cat 2 / Def 4 Carry out repair during next available programme.
In most assets specific investigatory levels need to be developed as an Improvement Action to ensure a consistent approach.
4.6 Operational /
Cyclic Maintenance
Operational activities required to keep the assets in operation, frequencies and target compliance with response times.
4.7 Planned Maintenance: Renewals
How are planned renewals determined?
What intervention criteria are used to assess renewals needs? How are lists of possible schemes prioritised?
How are planned renewals programmes linked to prediction of asset condition? Which assets, or asset components, present the opportunity for the application of preventative maintenance?
4.8 Disposal The process for disposing of assets including the criteria for disposal and the official removal from council ownership
5 Investment How much does this asset group currently cost? 5.1 Historical
Investment
Historical levels of investment over the last 5 years including: • 3rd party claim payouts
• Operational costs: cyclic maintenance activities • Reactive maintenance: safety related
• Routine maintenance: reactive non safety related • Planned maintenance: asset renewals – preventative • Planned maintenance: asset renewals – corrective
D e c e m b e r 2 0 1 0
P a g e 10 Ref Section Name Section Description
• Asset upgrading
5.2 Output from
Investment
Output from investment over the last five years
5.3 Forecasting Financial Needs
Future forecast budgetary needs and documented process for establishing these.
5.4 Valuation Gross Replacement Cost (GRC) – estimate of the current cost of replacing an asset using a standardised procedure
Depreciated Replacement Cost (DRC) – estimate of the current book value of the asset reflecting the fact that a proportion of the asset has been consumed / used up as result of use and ageing.
Annualised Depreciation Cost (ADC) – the cost of an asset to a single year of the asset’s expected lifetime
6 Forward Works Programme
How are future works programmed? 6.1 Existing
Programmes
Current year and forward work programmes costs and other details.
The process for developing current year and forward work programmes including update frequency and level of confidence.
The prioritisation method
Our Approach In Staffordshire budgets are allocated in February each year and draft 12 month programmes, based on estimates, are finalised for approval in March. On approval each scheme is designed to finalise treatment type and cost. Schemes can be added or deleted from the programme based on these costs. No programmes exist for future years.
6.2 Programme
Coordination
Coordination of future works programmes
Our Approach The application of asset management and lifecycle planning in particular provide an ideal opportunity for greater co-ordination through the co-ordination of programmes over a longer period providing the potential for creating more hybrid schemes, managing road space occupation more effectively and placing embargos of potentially inappropriate extensive routine repairs on assets for which major maintenance schemes are planned within the next few years. At present there is a formal process for creating a co-ordinated works programme made up of appropriate schemes from each of the individual asset groups. 6.3 Option Appraisal The documented option appraisal methodology used to assess alternatives at a
maintenance treatment level, project level and a budget category level.
Our Approach Designers are required to assess a number of options before undertaking the final design. There is little documented evidence of the process and assumptions that drive the final decision.
7 Risk What are the risks associated with the management of this asset group? 7.1 Risk Control and
Reporting
The key risks that have been identified, the controls in place to manage them and the reporting process.
Our Approach
8 Works Delivery and
Procurement
The current delivery method of works and the tender processes for contracted works
The council processes for evaluating supplier proposals for higher cost, better value for money products and services
Our Approach Staffordshire Highways is a virtual joint venture bringing together us, and Enterprise as a seamless team delivering the highest standards in maintaining and improving our vital transport infrastructure.
9 Performance Measurement
How is the performance of this asset group measured and managed? 9.1 Performance Results and targets for national performance indicators for the asset for the last
D e c e m b e r 2 0 1 0
P a g e 11 Ref Section Name Section Description
Indicators: National
five years. 9.2 Performance
Indicators: Local
Results and targets for local performance indicators for the asset for the last five years.
9.3 Performance Reporting
The process for reporting performance results including when and to whom Our Approach Performance Indicators are reported quarterly through the Council’s Performance
Management Information System to Scrutiny Committee 10 Future
Strategies
Future strategies which offer the best value for money to deliver what is required from the asset
Asset management processes in Staffordshire which could be improved to enable delivery of a better value service
11 Service Improvement Actions
Specific improvement actions which improve the way in which the council currently manages the asset. They are recorded as an improvement action statement and include a proposed completion date and responsible officer.
D e c e m b e r 2 0 1 0
P a g e 12 Risk Register Tables
Table 2.1a: Likelihood Impact Risk Rating
Score
Likelihood Classification
Risk Description Table 2.1b: Risk Impact (Overall Risk = Likelihood x Impact) 1 Remote Likely to occur greater than 10 Years
2 Unlikely Likely to occur within 5 to 10 Years Net Risk Score Risk Rating Risk Mitigating Action 3 Possible Likely to occur within 3 to 5 Years 16 to 25 Red Action required 4 Likely Likely to occur within 1 to 3 Years 10 to 15 Amber Should consider action 5 Very Likely Likely to occur within a year 1 to 10 Green May consider action
Table 2.1c: Risk Impact Risk Rating
Score
Impact Classification
Health, Safety and Welfare
Customer Service Finance Reputation 1 Insignificant Minor injury cleared
with first aid treatment
Adverse impact on service for up to 1 day.
Up to £100,000
Managed / reported to Business Unit Local media (Short Term duration) 2 Minor Reportable dangerous
occurrences (near misses)
Adverse impact on service between 1 day and 1 week.
Up to £250,000
Managed / reported to Departmental Management Team
Local media (Medium / Long Term duration) 3 Moderate Reportable
over-three-day injuries or reportable diseases
Adverse impact on service between 1 week and 1 month.
Up to £1m Managed / reported to Corporate Management Team and Members Regional media (Short Term duration) 4 Significant Major reportable injury
or injuries
Adverse impact on service between 1 and 3 months.
Up to £5m Managed / reported to Members and Cabinet
Regional / National media (Medium / Long Term duration)
5 Catastrophic Fatality or permanent disability
Adverse impact on service for over 3 months.
Over £5m Third Party intervention Public Interest Group
National / International media (Medium / Long Term duration)
D e c e m b e r 2 0 1 0
P a g e 13
Carriageway Lifecycle Plan
C a r r i a g e w a y L i f e c y c l e P l a n D e c e m b e r 2 0 1 0 P a g e i
Contents:
1 Current Status ... 2 1.1 Current Issues...21.2 Current Asset Management Strategies...2
2 The Asset ... 2 2.1 Scope of Asset...2 2.2 Asset Register...2 2.3 Asset Growth ...3 3 Service Expectations ... 3 3.1 Customer Perceptions...3
3.2 Council Goals and Objectives ...4
3.3 Use ...6 3.4 Safety Considerations ...7 3.5 Utility Activity...8 3.6 3rd Party Claims...8 3.7 Environmental Considerations ...8 4 Management Practices ... 9 4.1 Policies ...9 4.2 Inspection Regime...9 4.3 Condition Assessment ...9
4.4 Construction / Asset Acquisition... 12
4.5 Operate and Maintain (incl. Routine Maintenance) ... 12
4.6 Planned Maintenance: Renewals... 13
4.7 Disposal ... 18
5 Investment ... 18
5.1 Historical Investment ... 18
5.2 Forecasting Financial Needs... 19
5.3 Valuation... 21
6 Forward Works Programme ... 22
6.1 Existing Programmes... 22
6.2 Option Appraisal... 22
7 Risk ... 23
7.1 Risk Control and Reporting... 23
8 Performance Measurement ... 25
8.1 Performance Indicators ... 25
8.2 Performance Reporting ... 25
9 Future Strategies... 26
C a r r i a g e w a y L i f e c y c l e P l a n D e c e m b e r 2 0 1 0
1
Current Status
1.1 Current Issues
Accurate widths of the carriageway are currently unknown on the whole Staffordshire network. These need to be obtained to allow the 2010/11 Valuation to be completed accurately. Note: Default widths were provided for the 2009/10 Valuation.
1.2 Current Asset Management Strategies
An additional £30 million is being put into carriageway (and footway) maintenance over 4 years (£5 million in 2009/10, £10 million in 2010/11 and 2011/12, and £5 million in 2012/13) to achieve the target condition of 4%.
2
The Asset
2.1 Scope of Asset
The carriageway asset is comprised of:
Table 2.1: Carriageway Inventory 2009/10 (Km)
Road Type Urban (km) Rural (km) Total (km)
Principal (A) Roads (Cat 2) 276.3 332.6 608.9 Classified (B) roads (cat 3a) 130.4 201.6 332.0 Classified (C) roads (cat 3b) 324.6 1,130.2 1454.8 Un - Classified (C) roads (cat 4a) 2037.0 1,627.9 3664.9
Total 2768.3 3292.3 6060.6
There is a high level of confidence in the accuracy of the above values. They are updated on an annual basis as part of the R199b data return to the Department for Transport (DfT).
2.2 Asset Register
The most up to date carriageway network is found on the National Street Gazetteer. The WDM Pavement Management System (PMS) has the capacity to hold the network and all additional carriageway information. Currently at this time the PMS is not populated. An improvement action to complete this task is included in Section 10 of this Lifecycle Plan.
C a r r i a g e w a y L i f e c y c l e P l a n D e c e m b e r 2 0 1 0
P a g e 3
2.3 Asset Growth
The lengths provided through the R199b process for the last five years are recorded in Table 2.2. The average annual increase over the period is 1.2% predominantly in the rural areas.
The majority of the increase in the carriageway asset is from the adoption of unclassified roads. This equates on average to 1% increase per year which is predicted to continue for the following five to ten years.
Table 2.2: Changes in Carriageway Inventory 2005-10 (Km)
Road Type 2005/06 2006/07 2007/08 2008/09 2009/10 Urban 2,761.6 2,761.6 2,761.6 2,768.3 2,768.3 Rural 2,966.8 2,966.8 2,966.8 3,292.3 3,292.3 Total 5,727.9 5,727.9 5,727.9 6,060.6 6,060.6 Overall % Change 0.0% 0.0% 5.8% 0.0%
3
Service Expectations
3.1 Customer PerceptionsThe process for identification and alignment with customer expectations is achieved initially through a customer survey or public consultation exercise. The most recent fully documented survey was completed in 2003 in association with a ‘Have your Say’ event.
3.1.1 National Highways & Transport (NHT) Survey
The National Highways & Transport (NHT) Survey is a postal survey, carried out by Ipsos MORI. The following results were associated with the carriageway asset: Table 3.1: National Highways & Transport (NHT) Survey Results (Carriageways)
2008 2009 2010
Ind. Ref. Benchmarking Indicator Score
(100) Rank (30) CC Rank (11) Score (100) Rank (76) CC Rank (11) Score (100) Rank (95) CC Rank (11)
HMBI 01 Condition of road surfaces 47.30 15 6 44.54 40 7 36.82 50 5 HMBI 02 Cleanliness of roads 57.28 15 7 58.73 28 5 55.91 34 5 HMBI 06 Speed of repair to damaged
roads and pavements 37.03 16 6 35.97 32 5 29.25 58 6 HMBI 08 Weed killing on pavements
and roads 48.34 23 8 47.34 59 9 51.33 45 4
HMBI 11
Keep roads clear of obstructions such as skips/scaffolding etc
57.12 14 5 58.98 19 3 60.54 9 1
HMBI 14
Cuts back overgrown hedges obstructing the highway
50.49 9 1 45.00 65 8 50.26 39 2
C a r r i a g e w a y L i f e c y c l e P l a n D e c e m b e r 2 0 1 0
3.1.2 Customer Relationship Management
Our Customer Relationship Management process enables us to provide our customers with a good service. All customer contacts and service requests received are entered into our Integrated Highway Management System (IHMS) which enables us to manage and ensure that action is taken within our required response time. Figure 3.1 shows the number of enquiries received in relation to the carriageway asset. A more in depth analysis of the information highlights that reporting potholes is the most common enquiry. The increase in the winter months highlights the effects the bad winter had on the overall carriageway through the increase in potholes.
920 744 622 542 733 628 1318 1426 1618 1505 888 816 801 60 84 33 14 11 5 16 9 6 36 87 86 112 0 200 400 600 800 1000 1200 1400 1600 1800 J u l-0 9 A u g -0 9 S e p -0 9 O c t-0 9 N o v -0 9 D e c -0 9 J a n -1 0 F e b -1 0 M a r-1 0 A p r-1 0 M a y -1 0 J u n -1 0 J u l-1 0 N u m b e r o f E n q u ir ie s
Number of Customer Enquiries 2009/10 (Carriageways)
Carriageways Specialist Surfacing
Fi gure 3.1: Customer Enquiries 2009/10 (Carriageways)
Source: IHMS
3.2 Council Goals and Objectives
The carriageway asset makes a significant contribution towards achieving Corporate Priorities as can be seen in Figure 3.2.
C a r r i a g e w a y L i f e c y c l e P l a n D e c e m b e r 2 0 1 0
P a g e 5
Service Outcome 1: Tackle the challenge of climate change and ensure that Staffordshire’s communities can access our natural environment.
Service Outcome 2: Staffordshire will be known for being a high knowledge-based, skilled economy, leading to better quality of life outcomes for Staffordshire’s
Service Outcome 3: Ensure that Staffordshire’s communities can access everyday facilities via the transport and
Service Outcome 4: Provide high quality, innovative and efficient services to Staffordshire communities.
Service Priority 10: Develop and manage a transport network which supports sustainable economic growth, promotes travel and improves
Service Priority 15: Provide efficient and quality trading services to facilitate high-performing front-line services.
SCCHP3B: The completion of a second transport Asset Management Plan
Aim 2: Safer roads, accessible and sustainable transport
SCCHA2A: To ensure safer journeys and reduce road casualties
Aim 1: Customer Focussed SCCHA1A: Our services will be easier to access, more customer focussed and, responsive to the needs of individuals and local communities.
Aim 5: A high quality, value for money service
SCCHA5B: We will be recognised as a leading high performing highway service Aim 3: Well maintained highways
SCCHA3A: To maintain the highway network to a standard that provides for the safe and efficient movement of people and goods
SCCHP2A: Reduce the number of people killed or seriously injured on Staffordshire’s roads
SCCHP1A: Increased customer satisfaction measured through the road defects hotline surveys, post scheme satisfaction surveys, National Highways Public Satisfaction Survey and the Considerate Constructor Scheme
SCCHP5B: Improve the quality of work by reducing the number and costs of defects and non-conformities. Se rv ic e O u tc o m e s S e rv ic e P ri o ri ti e s S ta ff o rd sh ir e C o u n ty C o u n c il H ig h w a y A im s S ta ff o rd sh ir e C o u n ty C o u n c il H ig h w a y P ri o ri ti e s
Corporate Priority 1: A vibrant prosperous and sustainable economy
Corporate Priority 2: Strong, safe and cohesive communities
Corporate Priority 4: A protected, enhanced and respected environment
Corporate Priority 3: Improved health and sense of well being
Corporate Priority 5: Statutory education and early years targets
C o rp o ra te P ri o ri ti e s
Service Priority 11: Improve and maintain the condition and safety of Staffordshire’s roads, footways and rights of way.
SCCHP3A: Improve and maintain the condition and safety of Staffordshire’s roads, footways and rights of way
SCCHP1B: Improved response to reports and requests for service from our customers.
T A M P L in k a g e
s SCCHP3A TAMP LinkageThe carriageway life cycle : plan provides the tools to create programmes to achieve this priority
SCCHP3B TAMP Linkage: The successful completion of the TAMP
SCCHP2A TAMP Linkage: Implementing the Skid Resistance Policy including regular monitoring, analysing and programme development
SCCHP1A TAMP Linkage: Provides forward programmes that will be made available to the customer when requested.
SCCHP1B TAMP Linkage: Provides the process for compiling the Minor Works Programme focussed on satisfying the customer
SCCHP5B TAMP Linkage: The carriageway life cycle plan targets efficient use of funding on maintaining the asset.
C a r r i a g e w a y L i f e c y c l e P l a n D e c e m b e r 2 0 1 0
3.3 Use
We do not have a formal traffic monitoring process in place for assessing traffic growth over time. It is recognised that this is an essential component of long term planning so an improvement action to develop a process has been included in Section 10.
The only existing traffic flow information for Staffordshire County is found on the Department for Transport (DfT) website
Source:
http://www.dft.gov.uk/pgr/statistics/datatablespublications/roads/traffic/annual -volm/tra8903.xls
This is updated throughout the year as information becomes available.
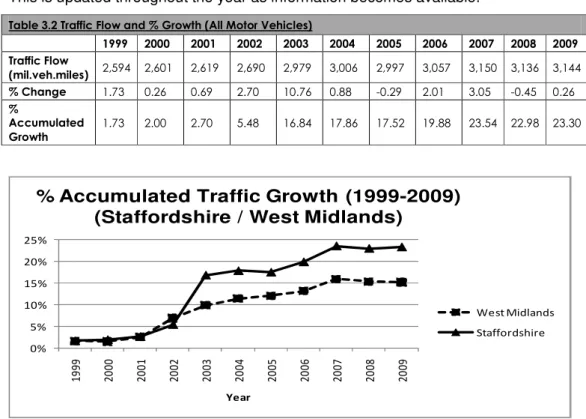
Table 3.2 Traffic Flow and % Growth (All Motor Vehicles)
1999 2000 2001 2002 2003 2004 2005 2006 2007 2008 2009 Traffic Flow (mil.veh.miles) 2,594 2,601 2,619 2,690 2,979 3,006 2,997 3,057 3,150 3,136 3,144 % Change 1.73 0.26 0.69 2.70 10.76 0.88 -0.29 2.01 3.05 -0.45 0.26 % Accumulated Growth 1.73 2.00 2.70 5.48 16.84 17.86 17.52 19.88 23.54 22.98 23.30 0% 5% 10% 15% 20% 25% 1 9 9 9 2 0 0 0 2 0 0 1 2 0 0 2 2 0 0 3 2 0 0 4 2 0 0 5 2 0 0 6 2 0 0 7 2 0 0 8 2 0 0 9 Year
% Accumulated Traffic Growth (1999-2009)
(Staffordshire / West Midlands)
West Midlands
Staffordshire
Figure 3.3: % Accumulated Traffic Growth (1999-2009)
Table 3.2 shows that traffic has increased by 16.95% over the last ten years. Figure 3.3 shows that this increase is signicantly above the same increases for West Midlands and England over the same period. The main increase began in 2003 when detrunked roads were passed to Staffordshire County Council for managing.
C a r r i a g e w a y L i f e c y c l e P l a n D e c e m b e r 2 0 1 0
P a g e 7
3.4 Safety Considerations
Table 3.3 provides details of all reported casualties for the last 10 years including child statistics. In summary there has been an overall downward trend in all categories since 2000.
Table 3.3 Summary of All Reported Casualties
Year Fatal Serious KSI Slight Total
All Child All Child All Child All Child All Child 2000 56 1 305 24 361 25 4558 503 4919 528 2001 74 0 326 38 400 38 4553 549 4953 587 2002 52 1 310 38 362 39 4395 472 4757 511 2003 71 2 344 29 415 31 4373 464 4788 495 2004 66 3 307 27 373 30 4275 429 4648 459 2005 49 3 280 33 329 36 4274 386 4603 422 2006 72 4 286 28 358 32 4153 373 4511 405 2007 65 0 250 21 315 21 4036 352 4351 373 2008 43 4 243 13 286 17 3266 319 3552 336 2009 45 1 216 20 261 21 3144 253 3405 274
Carriageway surface renewal schemes have been used to reduce the collisions at some sites. Table 3.4 and 3.5 provide an analysis of how different treatment types affect the level of collisions.
Table 3.4 compares the impact different surfacing treatments have on collision reduction. The most productive, in terms of collision savings per site is resurfacing, with a reduction of 7.2 collisions per site been achieved after treatments have been completed.. The other three surface types all achieved between 3.8 and 5.5 reductions in collisions as a result of the specific treatment.
Table 3.4: LSS Collision STATS – 3 YEAR ANALYSIS – ALL COLLISIONS TREATED BY SURFACING Rank Type Before After % Reduction
in Collisions after new Treatment No. Sites Treated Collisions / site Before Treatment Completed Reduction in Collision / Site Treated 1 Resurfacing* 49 13 73.5% 5 9.8 7.2 2 Surface Dressing 1227 519 57.7% 128 9.6 5.5 3 Anti-skid surfacing 212 94 55.7% 26 8.2 4.5 4 Retexturing* 31 16 48.4% 4 7.8 3.8
Total All Schemes 1519 642 57.7% 163 9.3 5.4 * Tended to be locations with a rapidly increasing number of collisions in the winter when surface treatments were not possible
Table 3.5 compares the impact individual scheme types including surface dressing, anti-skid surfacing and signing and lighting have on collision reduction. The surface treatments were both shown to provide more reductions to the amount of collisions than signing and lining improvements.
C a r r i a g e w a y L i f e c y c l e P l a n D e c e m b e r 2 0 1 0
Table 3.5: LSS COLLISION STATS – 3 YEAR ANALYSIS – 2003/04 to 2005/06 – SURFACING AND SIGNING / LINING Rank Type Before After % Reduction
in Collisions after new Treatment No. Sites Treated Collisions / site Before Treatment Completed Reduction in Collision by / Site Treated 1 Surface Dressing 294 115 60.9% 35 8.4 5.1 2 Anti-skid Surfacing 140 63 55.0% 16 8.8 4.8 3 Signing and Lining 81 34 58.0% 16 5.1 2.9
Total 1519 642 57.7% 163 9.3 5.4
3.5 Utility Activity
Utility activity can have a major effect on the maintenance and management of the carriageway asset, although not yet quantified it is believed that there is a significant increase in the number of defects found following the disturbance of the surface due to utilities. This is apparent even when the utility has reinstated the surface to the required standard.
3.6 3rd Party Claims
The interrogation of third party claims can aid in the determination of recurrent faults within the highway. The details presently held record the location and details of the claim. This information is currently not used in the identification and / or prioritisation of works.
The total quantities for all highway assets are shown in the Lifecycle Plan Summary at the beginning of this document. The costs of these claims can be significant and it is therefore important to identify commonalities which can be assessed and reduced through following good asset management. An Improvement Action to separate the 3rd Party Claims into individual assets is included in Section 10 of this Lifecycle Plan.
3.7 Environmental Considerations
Staffordshire Highways prides itself on being a leader in the field of sustainable highways maintenance where we consider the environmental effects of our actions. We recycle arisings from the existing road, using imported, recycled or secondary aggregates to reduce our impact on the natural resources and use techniques which minimise the production of greenhouse gases.
The following are examples of processes we use to reduce our effect on the environment:
In situ mobile asphalt recycling
This innovative technique uses existing footway material or asphalt planings, turning lumps of crumbling old footway into new shiny black asphalt. The process
completely avoids the need to purchase new bitumen-coated aggregate and elminates the disposal of any waste to landfill.
C a r r i a g e w a y L i f e c y c l e P l a n D e c e m b e r 2 0 1 0
P a g e 9 This process alone has resulted in an annual reduction in carbon emissions of approximately 1,600 tonnes – equivalent to almost 10 million kilometres of car journeys, calculated with the Carbon Trust Toolkit using standard Defra conversion factors.
Recycling of inert materials returned to maintenance depot
Materials are imported from site to highways depots and stock piled in storage bays. When sufficient materials are in stock, mobile crushing and screening plant is
temporarily installed in the depot and the material, usually concrete products and excavated sub-base is crushed to produce laboratory tested Type 2 Granular Sub-base which is then reused within the highways term maintenance contracts.
This process produces approximately 65,000 tonnes of material per year, saving the Council around £730,000 per year.
4
Management Practices
4.1 Policies
The following two policies which effect the asset management of the carriageway have been officially approved by the Council.
• Skid Resistance Policy – July 2008
• Highway Safety Inspection Code of Practice (last revised in October 2007)
The remaining requirements for managing these assets are provided by the recommendations detailed in the Well Maintained Highway Code of Practice for Highway Maintenance Management, July 2005 (Well Maintained Highways). An improvement action has being included in Section 10 to obtain official council approval for the specific recommendations in Well Maintained Highways which we follow. This will require reviewing all the recommendations to ensure they meet our needs and adding where applicable local exceptions.
4.2 Inspection Regime
We monitor the safety of the highway network following our ‘Highway Safety Inspection Code of Practice (last revised in October 2007). This is based on the recommendations of Well Maintained Highways.
4.3 Condition Assessment
The condition of the carriageway is assessed by inspections using a number of assessment techniques.
• SCANNER – a vehicle mounted automated condition survey that assesses
the visual defects on the surface of the road and relates these to an overall road condition.
C a r r i a g e w a y L i f e c y c l e P l a n D e c e m b e r 2 0 1 0
• SCRIM – Sideways-force Coefficient Routine Investigation Machine used to
measure the wet skidding resistance of a road surface.
• Deflectograph – A vehicle mounted survey that assesses the structural
condition of road pavements by measuring the deflection of the road surface under the action of a rolling wheel.
• Coarse Visual Inspection (CVI) – To complete?
Table 4.1 - Frequency of Condition Inspections/Assessments
Survey Type Deflectograph SCRIM Scanner CVI
Road Classification A A & B A, B & C D & U
% of Network Surveyed
Each Year 20 100 A, B = 100, C = 50 25
Direction of Survey One way One way One way N/A
Yearly Cycle for Complete
Coverage 5 1 A, B = 2, C = 4 4
km Surveyed Each Year 109.3 A = 546.3; B = 331.9 A = 546.3, B = 331.9, C = 727.4 915.1
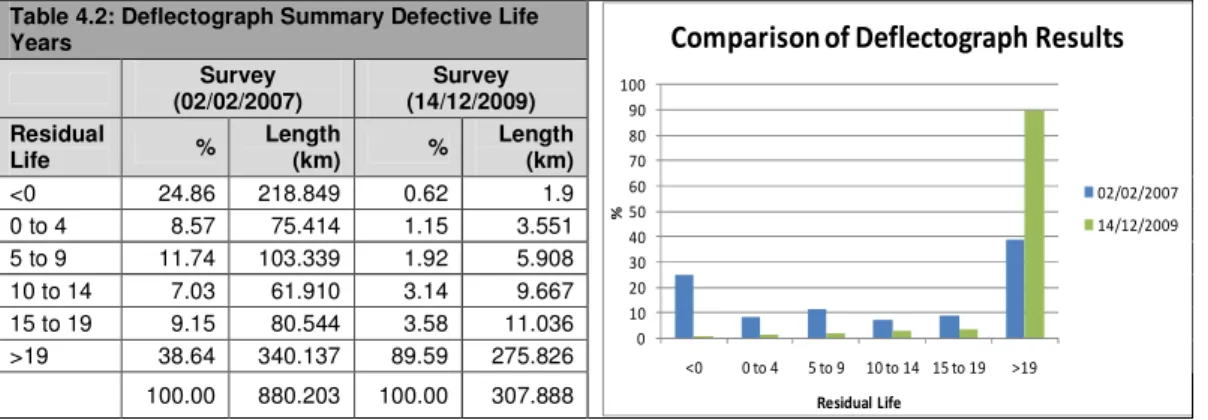
4.3.1 Deflectograph
This type of survey is carried out to assess and estimate the structural residual life of the carriageway, and where necessary to design overlay thicknesses to extend the structural life. This process can help to define the backlog and long term budget requirements required to maintain the structural integrity of the highway network. Table 4.2 and its associated graph show that 89.59% of the carriageway surveyed in 2009 has over 19 years of life remaining. This has improved from 38.64% in 2007. The significant reduction highlights that the carriageway scheme selection process is working correctly and targeting pavements with low remaining life.
Table 4.2: Deflectograph Summary Defective Life Years Survey (02/02/2007) Survey (14/12/2009) Residual Life % Length (km) % Length (km) <0 24.86 218.849 0.62 1.9 0 to 4 8.57 75.414 1.15 3.551 5 to 9 11.74 103.339 1.92 5.908 10 to 14 7.03 61.910 3.14 9.667 15 to 19 9.15 80.544 3.58 11.036 >19 38.64 340.137 89.59 275.826 100.00 880.203 100.00 307.888 0 10 20 30 40 50 60 70 80 90 100 <0 0 to 4 5 to 9 10 to 14 15 to 19 >19 % Residual Life
Comparison of Deflectograph Results
02/02/2007 14/12/2009
C a r r i a g e w a y L i f e c y c l e P l a n D e c e m b e r 2 0 1 0
P a g e 11
4.3.2 SCRIM
Scrim surveys are used to measure the wet skidding resistance of the road surface. The measurements from scrim are used to identify lengths of road that are at or below investigatory levels defined for that particular road category or carriageway event. This allows the authority to identify problem areas and carry out remedial works as required, hence improving the safety of the highway network.
Table 4.3 and its associated graph show the results from SCRIM surveys completed in 2002 and 2009. In measuring SCRIM, each 10 metre section is assigned a reading from the survey machine which is then compared with an investigatory level (IL). ILs reflect the level of demand for skid resistance expected at the specific site. High demand sites include pedestrian crossings and traffic signals where the need to stop quickly is more likely. Low demand sites are lengths of road where there are no events requiring the need to stop quickly.
The SCRIM Deficiency measure referred to in Table 4.3 compares the level of skid resistance available via the survey with the IL. A value of zero or above indicates that there is insufficient skid resistance at the site for the required demand.
The results in Table 4.3 show that in 2002/03 and 2009 there was 13.7% and 12.3% of carriageway respectively with SCRIM Deficiency below 0. This indicates that skid resistance has maintained a consistent level in that period.
Table 4.3: SCRIM Deficiency
2002/03 2009 SCRIM Deficiency % Length (km) % Length (km) <0.15 0.00 0.000 0.27 1.153 -0.11 - -0.15 0.30 3.706 0.72 3.042 -0.10 - -0.06 2.21 27.207 2.38 10.068 -0.05 - -0.01 11.21 138.255 9.00 38.067 0.00 – 0.04 28.20 347.861 24.98 105.715 0.05 – 0.09 29.97 369.708 38.96 164.448 >0.09 28.12 346.832 23.80 100.704 Totals 100 1,233.539 100 423.197 0 5 10 15 20 25 30 35 40 45 L e ss t h a n 0 .1 5 B e t. -0 .1 1 & -0 .1 5 B e t. -0 .1 & -0 .0 6 B e t. -0 .0 5 & -0 .0 1 B e t. 0 .0 0 & 0 .0 4 B e t. 0 .0 5 & 0 .0 9 M o re th a n 0 .0 9 % SCRIM Deficiency
Comparison of SCRIM Results
2002/03 2009
4.3.3 SCANNER
Scanner surveys are conducted in order to obtain the following information; roughness in the left-hand wheel path, texture in the left-hand wheel path centre of lane and right-hand wheel path, individual wheel path rut depths measured under a 2m straight edge with 20 sensors over a 3.2 metre width, video recording of the view ahead providing images at 5m intervals, longitudinal gradient, horizontal radius of curvature and lane cross fall.
C a r r i a g e w a y L i f e c y c l e P l a n D e c e m b e r 2 0 1 0
4.3.4 COARSE VISUAL INSPECTION (CVI)
CVI surveys are a driven visual inspection of the D road and unclassified road network. These surveys are conducted on 25% of the D and U road network annually hence forming a 4 year cycle.
Table 4.4 BVPI Results (2005/06 – 2009/10)
A Roads B Roads C Roads U Roads SCANNER SCANNER SCANNER CVI Survey Type Length (Km) %age of overall length Length (Km) %age of overall length Length (Km) %age of overall length Length (Km) %age of overall length 2005/06 39.52 6.2 42.14 13.3 60.38 9.0 25.0 2006/07 41.70 7.0 42.54 13.3 66.89 9.8 15.0 2007/08 27.28 5.0 38.81 11.8 48.46 7.1 12.0 2008/09 26.87 4.0 17.03 5.2 60.37 9.0 10.0 2009/10 29.20 5.0 15.90 5.0 63.48 9.3 9.0
4.4 Construction / Asset Acquisition
New assets are typically acquired from either adoption or from taking over improvement works completed by contractors on behalf of the council. This is normally managed by the development control team using Section 38, 278 or 106 legal agreements. Newly constructed 'adoptable' streets are only adopted once they meet current council specifications.
4.5 Operate and Maintain (incl. Routine Maintenance)
Routine Maintenance treatments are undertaken to ensure the asset is maintained at a minimum service level. Safety inspectors are responsible for identifying and assessing any defects which reduce the safety of the road user. Investigatory Levels are the point when a risk assessment should be conducted. Section 2.2, Highway Safety Inspection Code of Practice provides a list of investigatory levels for the main defects for guidance. Table 4.5 shows the Carriageway Investigatory Levels.
Table 4.5: Carriageway Investigatory Levels
Feature Defect Investigatory Level
Pothole / Spalling 40mm depth
Crowning Dependant on reinstatement width (NRSWA) Depression 50mm level difference (area 2m2
)
Rutting 40mm depth
Crazing / cracking 25mm width (40mm depth) Sunken ironwork 40mm level difference Raised ironwork 20mm level difference Carriageway
C a r r i a g e w a y L i f e c y c l e P l a n D e c e m b e r 2 0 1 0
P a g e 13 The number of carriageway and specialist surfacing defects rectified in 2008 and 2009 are shown in Figure 4.1. This information highlights a significant increase in carriageway defects in 2009 due extensively to the bad winter causing an increase in potholes. 0 2000 4000 6000 8000 10000 12000 2008 2009 2008 2009 2008 2009 2008 2009
Cat 1 Cat 2/Def 2 Cat 2/Def 3 Cat 2/Def 4
N u m b e r o f D e fe ct s
Response Categories by Year
Carriageways
(Category Breakdown by Year)
0 2 4 6 8 10 2008 2009 2008 2009 2008 2009 2008 2009
Cat 1 Cat 2/Def 2 Cat 2/Def 3 Cat 2/Def 4
N u m b e r o f D e fe c t s
Response Categories by Year
Specialist Surfacing (Category Breakdown by Year)
Figure 4.1: Carriageway and Specialist Surfacing Completed Defects (2008 & 2009) (Source: IHMS)
4.6 Planned Maintenance: Renewals
Planned maintenance options available are for A, B and C Roads in Table 4.6 and for Unclassified Roads in Table 4.7.
* All unit costs are for m2 except for Edge which is in linear metres
Figure 4.2 details the process for creating the Annual Planned Maintenance Programme. Additional information referred to in Figure 4.2 is shown in Figure 4.3 and Table 4.7. The result of the process is a final list of schemes to be completed in the following financial year. This is inserted into the Annex of this lifecycle plan once
Table 4.6: Unit Costs and Design Lives for Treatment Urban and Roads (A, B & C Roads)
Rural Unit Cost (£/m) Urban Unit Cost (£/m) Treatment Design Lives
(yrs) A Roads B Roads C Roads A Roads B Roads C Roads
Reconstruction 40 74.26 63.83 56.48 74.26 63.83 56.48 Thick Overlay 40 17.57 17.57 17.57 20.59 20.59 20.59 Moderate Overlay 40 17.57 17.57 17.57 20.59 20.59 20.59 Thin Overlay 15 8.94 8.94 8.94 10.44 10.44 10.44 Thin Surfacing 15 8.94 8.94 8.94 10.44 10.44 10.44 Surface dressing / Micro Asphalt 10 2.75 2.75 2.55 2.75 2.75 2.55
Table 4.7: Unit Costs and Design Lives for Treatment Rural and Urban Roads (Unclassified)
Treatment Design Lives
(yrs)
Unit Cost (£)
Structural Condition Indice 50 16.82
Wearing Condition Indice 20 3.69
C a r r i a g e w a y L i f e c y c l e P l a n D e c e m b e r 2 0 1 0
approved. A second list of schemes is also identified which are on standby for situations where additional funding may become available or one of the initial schemes can’t be completed.
This is an annual process and each year all uncompleted identified schemes, new and old, will be prioritised equally. This ensures that the schemes most in need of completion are inserted into the following years Planned Maintenance Programme.
C a r r i a g e w a y L i f e c y c l e P l a n D e c e m b e r 2 0 1 0
P a g e 15
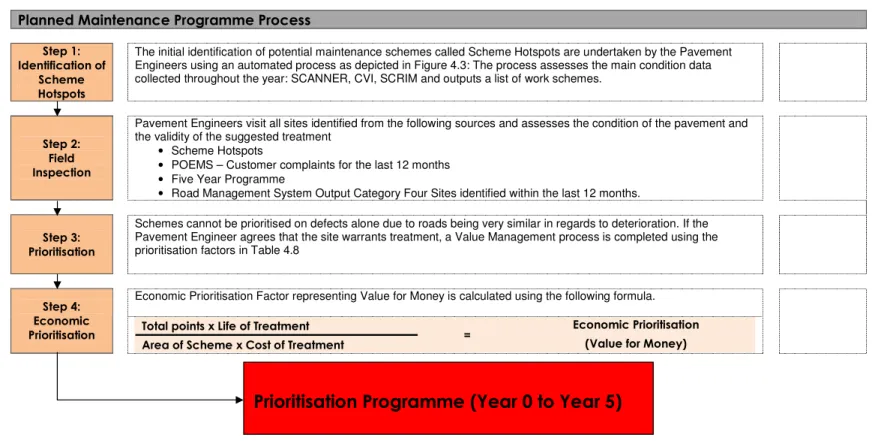
Planned Maintenance Programme Process
Step 1: Identification of
Scheme Hotspots
The initial identification of potential maintenance schemes called Scheme Hotspots are undertaken by the Pavement Engineers using an automated process as depicted in Figure 4.3: The process assesses the main condition data collected throughout the year: SCANNER, CVI, SCRIM and outputs a list of work schemes.
Step 2: Field Inspection
Pavement Engineers visit all sites identified from the following sources and assesses the condition of the pavement and the validity of the suggested treatment
• Scheme Hotspots
• POEMS – Customer complaints for the last 12 months • Five Year Programme
• Road Management System Output Category Four Sites identified within the last 12 months.
Step 3: Prioritisation
Schemes cannot be prioritised on defects alone due to roads being very similar in regards to deterioration. If the Pavement Engineer agrees that the site warrants treatment, a Value Management process is completed using the prioritisation factors in Table 4.8
Economic Prioritisation Factor representing Value for Money is calculated using the following formula.
Step 4: Economic
Prioritisation Total points x Life of Treatment Economic Prioritisation
Area of Scheme x Cost of Treatment = (Value for Money)
Figure 4.2: Planned Maintenance Programme Process
C a r r i a g e w a y L i f e c y c l e P l a n D e c e m b e r 2 0 1 0
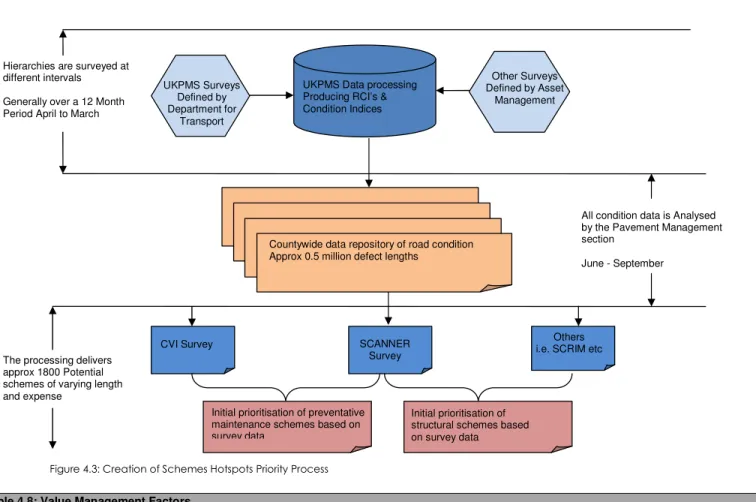
Figure 4.3: Creation of Schemes Hotspots Priority Process
Table 4.8: Value Management Factors Attributes
Score 1 2 3 4 5
Collision Rates 1 collision 2 collisions >3 collisions 1 KSI >1 KSI
UKPMS Data processing Producing RCI’s & Condition Indices
Other Surveys Defined by Asset
Management Hierarchies are surveyed at
different intervals Generally over a 12 Month Period April to March
All condition data is Analysed by the Pavement Management section
June - September
The processing delivers approx 1800 Potential schemes of varying length and expense
Others i.e. SCRIM etc SCANNER
Survey CVI Survey
Countywide data repository of road condition Approx 0.5 million defect lengths
Initial prioritisation of preventative maintenance schemes based on survey data
Initial prioritisation of structural schemes based on survey data UKPMS Surveys
Defined by Department for
C a r r i a g e w a y L i f e c y c l e P l a n D e c e m b e r 2 0 1 0
P a g e 17
Carriageway Shape Good Average Poor
Category 1&2 Defects <10 Number <20 Number <30 Number <40 Number >40 Number
Contribution to LI No Yes
Drainage
+ve drainage is present and working
+ve drainage is present and NOT working
No drainage & standing water
HGV Traffic Values Low <10% Medium <20% High >20%
Maintenance Hierarchy Hierarchy 5&6 Hierarchy 4 Hierarchy 3 Hierarchy 2 Hierarchy 1
Ride Quality Good Average Poor
Scheme Efficiency <50% >50% >60% >70% >80%
Scheme Length <500m >500m >1000m >1500m >2000m
Scheme Score from Site or UKPMS <20% >20% >40% >60% >80%
Urban or Rural Rural Urban
Winter Maintenance / Bus Routes No Yes
Contribution to Sustainability
Other Town Centre Industrial Estate Schools, Shops, Church etc
C a r r i a g e w a y L i f e c y c l e P l a n D e c e m b e r 2 0 1 0
We have also been undertaking a regime of preventative maintenance using surface dressing treatments where appropriate using SCRIM information condition assessment. The use of surface dressing is identified on a case by case basis taking into account the economies of scale.
4.7 Disposal
Redundant carriageways are those that the authority or the Secretary of State are to close or are no longer required. The maintenance of these would normally revert to persons whose property fronts the area.
The authority is required to coordinate with public utility undertakers to ensure their needs are met in relation to apparatus. New owners will need to be informed of any utility easement. Undertakers should also consider the installation of any ducts to facilitate any future diversionary works. Where new owners are to develop the area they must consult with the undertaker prior to any development work being carried out.
5
Investment
5.1 Historical Investment
Table 5.1 Carriageway Works Expenditure 2006/07 to 2010/11
Year Work Description Revenue (000) Capital (000) Total (000) Structural £ 00.0 £ 10,094.0 £ 10,094.0 Preventative £ 4,500.0 £ 1,000.0 £ 5,500.0 Routine Maintenance £ 7,788.1 £ 00.0 £ 7,788.1 2006-07 Total £ 12,288.1 £ 11,094.0 £ 23,384.0 Structural £ 00.0 £ 9,233.3 £ 9,233.3 Preventative £ 4,500.0 £ 1,000.0 £ 5,500.0 Routine Maintenance £ 8,050.2 £ 00.0 £ 8,050.2 2007-08 Total £ 12,550.2 £ 10,233.3 £ 22,783.5 Structural £ 00.0 £ 10,630.0 £ 10,630.0 Preventative £ 4,612.5 £ 1,000.0 £ 5,612.5 Routine Maintenance £ 8,641.8 £ 00.0 £ 8,641.8 2008-09 Total £ 13,254.3 £ 11,630.0 £ 24,884.3 Structural £ 00.0 £ 10,523.9 £ 10,523.9 Preventative £ 4,754.9 £ 1,112.4 £ 5,867.3 Routine Maintenance £ 7,607.6 £ 00.0 £ 7,607.6 2009-10 Total £ 12,362.5 £ 11,366.3 £ 23,728.8 Structural £ 00.0 £ 21,429.0 £ 21,429.0 Preventative £ 00.0 £ 4,228.8 £ 4,228.8 Routine Maintenance £ 7,729.3 £ 00.0 £ 7,607.6 2010-11 Total £ 7,729.3 £ 25,657.8 £ 33,387.1
C a r r i a g e w a y L i f e c y c l e P l a n D e c e m b e r 2 0 1 0
P a g e 19
5.2 Forecasting Financial Needs
A financial model has been developed that predicts the future budget required to achieve predefined conditions as measured by SCANNER, SCRIM and the Deflectograph.
The detail of the approach followed is documented in the WDM Ltd report ‘Use of a Model for Estimating the Budget Required for Staffordshire County Council to
achieve Predefined Pavement Conditions on their Road Network’ completed in 2009. The model separates the network into Road Classes A, B, C and Unclassified. The input information includes Condition Data, Maintenance Treatment Unit Costs and Design Lives.
The following four Scenarios were assessed:
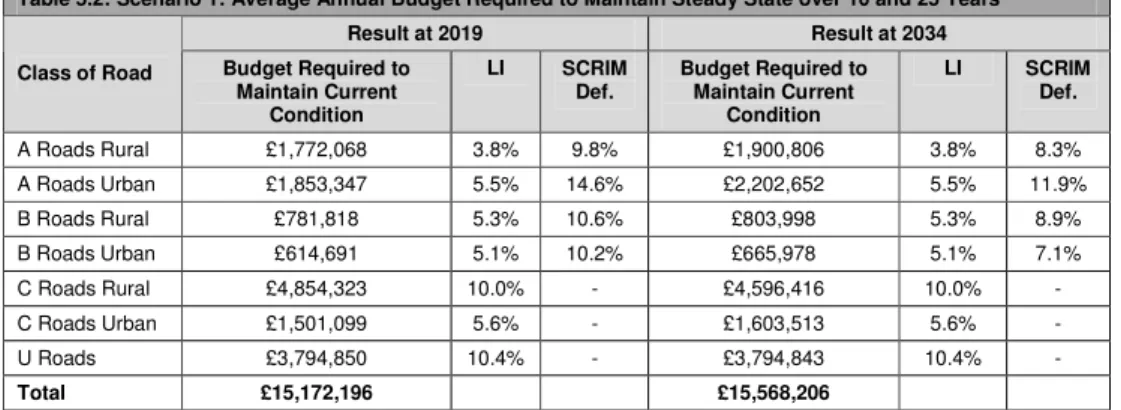
1. Determine budget to maintain current condition for the next 10 and 25 years (Steady State). Results are shown in Table 5.2.
Table 5.2: Scenario 1: Average Annual Budget Required to Maintain Steady State over 10 and 25 Years Result at 2019 Result at 2034 Class of Road Budget Required to
Maintain Current Condition LI SCRIM Def. Budget Required to Maintain Current Condition LI SCRIM Def. A Roads Rural £1,772,068 3.8% 9.8% £1,900,806 3.8% 8.3% A Roads Urban £1,853,347 5.5% 14.6% £2,202,652 5.5% 11.9% B Roads Rural £781,818 5.3% 10.6% £803,998 5.3% 8.9% B Roads Urban £614,691 5.1% 10.2% £665,978 5.1% 7.1% C Roads Rural £4,854,323 10.0% - £4,596,416 10.0% - C Roads Urban £1,501,099 5.6% - £1,603,513 5.6% - U Roads £3,794,850 10.4% - £3,794,843 10.4% - Total £15,172,196 £15,568,206
2. Determine the budget required to reduce all defect values to zero in 1 year. Table 5.3 shows the results of Scenario 2.
Table 5.3: Scenario 2: Reduce Defects to 0% Over 1 Year
Results at 2010 Class of Road
SCRIM Cost Network Cost Total Cost A Roads Rural £736,623 £7,041,456 £7,778,079 A Roads Urban £1,098,634 £9,880,906 £10,979,539 B Roads Rural £326,540 £3,608,216 £3,934,756 B Roads Urban £211,811 £3,099,875 £3,311,686 C Roads Rural - £35,606,337 £35,606,337 C Roads Urban - £10,194,090 £10,194,090 U Roads - £18,925,168 £18,925,168 Total £2,373,608 £88,356,048 £90,729,656
C a r r i a g e w a y L i f e c y c l e P l a n D e c e m b e r 2 0 1 0
3. Determine the budget required to achieve the proposed service levels of 4% for Principal roads, 5% for Non-Principal classified roads, and 6% for unclassified roads over 10 and 25 years. Table 5.4 shows the results of Scenario 3.
Table 5.4: Scenario 3: Achieve Proposed Service Levels over 10 and 25 Years
Result at 2019 Result at 2034 Class of Road Average Annual
Total Cost Local Indicator SCRIM Deficiency Average Annual Total Cost Local Indicator SCRIM Deficiency A Roads Rural £1,731,757 4.0% 9.8% £1,882,611 4.0% 8.2% A Roads Urban £2,016,796 4.0% 14.9% £2,272,871 4.0% 12.5% B Roads Rural £796,281 5.0% 10.6% £810,478 5.0% 9.0% B Roads Urban £619,838 5.0% 10.2% £668,135 5.0% 7.2% C Roads Rural £6,083,188 5.0% - £5,113,125 5.0% - C Roads Urban £1,571,424 5.0% - £1,632,034 5.0% - U Roads £4,433,461 6.0% - £4,050,288 6.0% - Total £17,252,745 £16,429,542
4. Determine the service levels achieved after ten years if an additional £30m is invested in the network over the next four years. This uses the steady state information obtained in Scenario 1 and adds the additional budgets for the first four years as shown in Table 5.5. Table 5.6 shows the results of Scenario 4.
Table 5.5: Scenario 4: Proposed Budget (2009/10 – 2012/13)
2009/10 2010/11 2011/12 2012/13
Road Type
Current
Budget Add. Bud. Tot. Bud Add. Bud. Tot. Bud Add. Bud. Tot. Bud Add. Bud. Tot. Bud A Road £6,000.0 £971.0 £6,971.0 £1,942.2 £7,942.2 £1,942.2 £7,942.2 £971.0 £6,971.0 B Road £2,000.0 £366.9 £2,366.9 £733.7 £2,733.7 £733.7 £2,733.7 £366.9 £2,366.9 C Road £3,391.3 £1,983.0 £5,374.3 £3,965.9 £7,357.2 £3,965.9 £7,357.2 £1,983.0 £5,374.3 U Road £3,000.0 £1,148.5 4,148.5 £2,297.0 £5,297.0 £2,297.0 £5,297.0 £1,148.5 4,148.5 Total £14,391.2 £4,469.4 £18,860.7 £8,938.8 £23,330.1 £8,938.8 £23,330.1 £4,469.4 £18,860.7
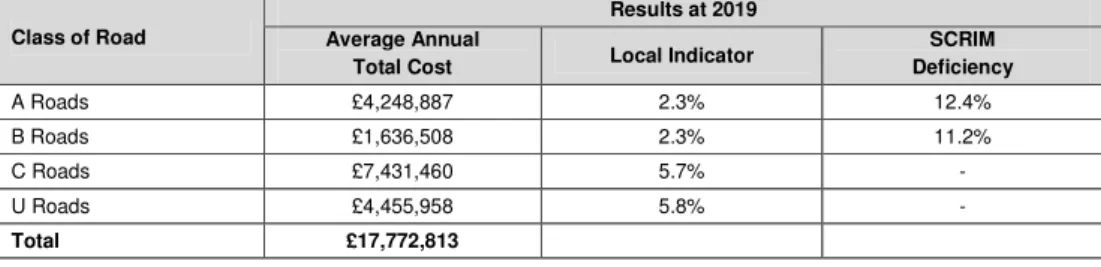
Table 5.6 highlights the significant anticipated improvements in the Local Indicators over the next ten years when adding the additional funding.
Table 5.6: Scenario 4: Achieve Proposed Service Levels over 10 Years after Additional £30m Investment in first four years
Results at 2019 Class of Road Average Annual
Total Cost Local Indicator
SCRIM Deficiency A Roads £4,248,887 2.3% 12.4% B Roads £1,636,508 2.3% 11.2% C Roads £7,431,460 5.7% - U Roads £4,455,958 5.8% - Total £17,772,813
C a r r i a g e w a y L i f e c y c l e P l a n D e c e m b e r 2 0 1 0
P a g e 21 Financial Model Scenarios Summary
Table 5.7 shows a breakdown of the results of the four scenarios assessed. Scenario 1 provides a steady state standard where the level of condition remains the same throughout the 10 and 25 year periods. This is the minimum that we strive for and to provide that would require an additional 5.43% per annum for the next 10 years.
We have chosen the Scenario 4 model for the next 10 year period. Our strategy is to use the additional investment to treat more of the high amber sections of road, which has the benefit of reducing further deterioration and the volume of road achieving the red condition level in the future. Through the investment of £26.8m it is evident that target service levels are achieved and sustained until 2019 for Road Type A, B and U. The higher priority Road Types, A and B, both achieve service levels of 2.3% which exceeds the target of 4.0%. If achieved, these roads will only require smaller investments in the future thus enabling our focus to shift to the other road types.
Table 5.7: Summary of Financial Model Scenarios
Values at 2019 Values at 2034 Scenario Average Annual Cost % Incr. from Current Budget Effect on Condition Average Annual Cost % Incr. from Current Budget Effect on Condition Current £14,391,200* NA Existing levels NA NA NA
1 £15,172,196 5.43% Existing levels £15,568,206 8.18% Existing levels 2 £90,729,656* 530.45% Remove all deficiencies NA NA 3 £17,252,745 19.88% Achieve target service levels £16,429,542 14.16% Achieve target service levels 4 £17,772,813 23.50% Achieves target service levels for Road Type A, B and U and improvement in Road Type C.
NA NA
*Budget for one year only
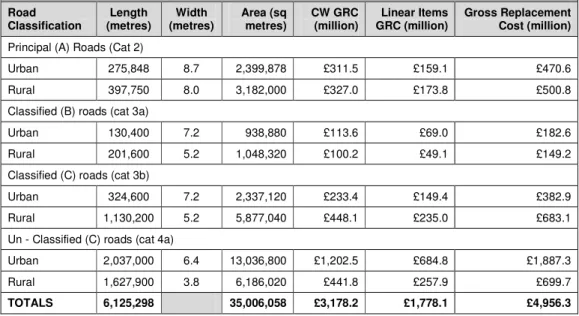
5.3 Valuation
Table 5.3 shows the breakdown of the 2009/10 Carriageway Gross Replacement Cost which has been completed in accordance with the Code of Practice on Transport Infrastructure Assets and the published timetable for Whole of Governments Accounts.
Note: The 2010/11 Whole of Government Accounts return will also require the calculation of the Depreciated Replacement Cost (DRC) and Annualised Depreciation Cost (ADC).
C a r r i a g e w a y L i f e c y c l e P l a n D e c e m b e r 2 0 1 0
Table 5.4: Carriageway Gross Replacement Cost (2009/10) Road Classification Length (metres) Width (metres) Area (sq metres) CW GRC (million) Linear Items GRC (million) Gross Replacement Cost (million)
Principal (A) Roads (Cat 2)
Urban 275,848 8.7 2,399,878 £311.5 £159.1 £470.6
Rural 397,750 8.0 3,182,000 £327.0 £173.8 £500.8
Classified (B) roads (cat 3a)
Urban 130,400 7.2 938,880 £113.6 £69.0 £182.6
Rural 201,600 5.2 1,048,320 £100.2 £49.1 £149.2
Classified (C) roads (cat 3b)
Urban 324,600 7.2 2,337,120 £233.4 £149.4 £382.9
Rural 1,130,200 5.2 5,877,040 £448.1 £235.0 £683.1
Un - Classified (C) roads (cat 4a)
Urban 2,037,000 6.4 13,036,800 £1,202.5 £684.8 £1,887.3
Rural 1,627,900 3.8 6,186,020 £441.8 £257.9 £699.7
TOTALS 6,125,298 35,006,058 £3,178.2 £1,778.1 £4,956.3
Note: Widths based on HAMFIG Default Values
6
Forward Works Programme
6.1 Existing Programmes
We currently have three works programmes:
1. Existing Programme – the value of the initial years programme equals the allocated budget. The selected schemes are compiled of the top scoring sites following the Value Management Process.
2. Year 2 Programme – a list of schemes valued at the same budget as the Existing Programme is compiled from the rolling programme which consists of the remaining top scoring sites from the Value Management Process. 3. Year 3 to 5 Programmes – All remaining schemes assessed using the Value
Management Process are grouped together to be completed between Year 3 and 5. Individual years aren’t allocated to these schemes as it is not
currently possible to predict how condition will be affected in the future.
6.2 Option Appraisal
The identification of the appropriate treatment required at an individual location is based at present on pavement investigation results and the engineering judgement of a professionally qualified engineer.
C a r r i a g e w a y L i f e c y c l e P l a n D e c e m b e r 2 0 1 0
P a g e 23
7
Risk
Risk management is a systematic approach to identifying and dealing with the risks that threaten our plans and projects and impact upon the continuation of service delivery.
7.1 Risk Control and Reporting
A risk register has been developed for the Transportation Asset Management Plan with individual asset risk registers also having been developed. Table 7.1 details the risks identified for the carriageway asset. The derivation of the ‘Scores’ within Table 7.1 are shown in Table 2.1a, b, and c of Staffordshire County Councils ‘Asset Lifecycle Plans’ document, October 2010.
Table 7.1 Controlled Risk Register (Carriageways)
Risk Likelihood Score Impact Score Uncontrolled
Risk Score Current Controls In Place
Revised Likelihood Score Revised Impac