Florida International University
FIU Digital Commons
FIU Electronic Theses and Dissertations University Graduate School
6-24-2016
Supporting Web-based and Crowdsourced
Evaluations of Data Visualizations
Mershack B. Okoe
Florida International University, [email protected]
DOI:10.25148/etd.FIDC000757
Follow this and additional works at:https://digitalcommons.fiu.edu/etd Part of theGraphics and Human Computer Interfaces Commons
This work is brought to you for free and open access by the University Graduate School at FIU Digital Commons. It has been accepted for inclusion in FIU Electronic Theses and Dissertations by an authorized administrator of FIU Digital Commons. For more information, please [email protected]. Recommended Citation
Okoe, Mershack B., "Supporting Web-based and Crowdsourced Evaluations of Data Visualizations" (2016).FIU Electronic Theses and Dissertations. 2566.
FLORIDA INTERNATIONAL UNIVERSITY Miami, Florida
SUPPORTING WEB-BASED AND CROWDSOURCED EVALUATIONS OF DATA VISUALIZATIONS
A dissertation submitted in partial fulfillment of the requirements for the degree of
DOCTOR OF PHILOSOPHY in
COMPUTER SCIENCE by
Mershack Bortey Okoe
ii
To: Interim Dean Ranu Jung
College of Engineering and Computing
This dissertation, written by Mershack Bortey Okoe, and entitled Supporting Web-based and Crowdsourced Evaluations of Data Visualizations, having been approved in respect to style and intellectual content, is referred to you for
judgment.
We have read this dissertation and recommend that it be approved.
_______________________________________ Christine Lisetti _______________________________________ Peter J. Clarke _______________________________________ Malek Adjouadi _______________________________________ Mark A. Finlayson _______________________________________ Jian Chen ______________________________________ Radu Jianu, Major Professor Date of Defense: June 24, 2016
The dissertation of Mershack Bortey Okoe is approved.
_______________________________________ Interim Dean Ranu Jung College of Engineering and Computing _______________________________________ Andrés G. Gil
Vice President for Research and Economic Development and Dean of the University Graduate School
iii
© Copyright 2016 by Mershack Bortey Okoe All rights reserved.
iv
DEDICATION
To my wife Cynthia, and my parents Grace and Emmanuel for their endless support and believe in me.
v
ACKNOWLEDGMENTS
Without the support and guidance of numerous people, this dissertation would not have been possible.
First, I would like to thank my advisor Radu Jianu for his guidance, mentorship, and support throughout this program. I greatly appreciate Radu’s commitment to ensuring I obtained the necessary skills as a researcher. From brainstorming ideas together, to debugging codes together, Radu’s involvement throughout the research process provided me with great research experiences and thoughtful lessons. I am very grateful for his influence as a supporter, mentor, challenger, and sounding-board through this research journey. I could not have imagined a more effective advisor.
Second, I would like to thank my committee members Christine Lisetti, Peter J. Clarke, Malek Adjouadi, Mark A. Finlayson, and Jian Chen for their time and effort in helping me improve this dissertation. I thank them for their useful comments and valuable feedback which helped made this dissertation better.
I am very grateful for professors in the School of Computing and Information Sciences whose classes and ideas had a major influence in my vision of Computer Science as a whole: thanks to Mark Weiss, Tao Li, Alex Pelin, and Geoffrey Smith. There are several amazing colleagues in the School of Computing and Information Sciences who I was fortunate to surround myself with. I would like to thank my fellow VizLab mates Sayeed Safayet Alam, and Nahid Ferdous for their friendship, and for being good collaborators on research projects. I am grateful for the friendship and company of several current and past colleagues of the School
vi
of Computing and Information Sciences including: Hasan Mahmud, Banik Madhusudan, Ugan Yasavur, Mahmudur Rahman, Mingming Guo, Kishwar Ahmed, and Melita Jaric.
I am also very grateful to the staff of the School of Computing and Information Sciences: thanks to Olga Carbonell for her good cheer and for making the bureaucratic aspect of the university seem tractable, Donaley Dorsett and Maureen Braham for their cheerful and friendly conversations, and Tiana Solis for the numerous conversations and encouragements.
I would also like to thank my amazing friends Albert and Ruby Yeboah-Forson for their friendship and for proofreading this dissertation. Thanks to Albert for his companionship and level-headed advices on issues related to school and life.
Finally, I would like to express my deepest gratitude to my family. Many thanks to my parents, Grace and Emmanuel for their love and endless believe in me. Special thanks to my wife, Cynthia, for being a great companion, loving, understanding, and for keeping me sane through this adventure. Many thanks to my brothers and sisters for their support and encouragements throughout this process.
vii
ABSTRACT OF THE DISSERTATION
SUPPORTING WEB-BASED AND CROWDSOURCED EVALUATIONS OF DATA VISUALIZATIONS
by
Mershack Bortey Okoe
Florida International University, 2016 Miami, Florida
Professor Radu Jianu, Major Professor
User studies play a vital role in data visualization research because they help measure the strengths and weaknesses of different visualization techniques quantitatively. In addition, they provide insight into what makes one technique more effective than another; and they are used to validate research contributions in the field of information visualization. For example, a new algorithm, visual encoding, or interaction technique is not considered a contribution unless it has been validated to be better than the state of the art and its competing alternatives or has been validated to be useful to intended users. However, conducting user studies is challenging, time consuming, and expensive.
User studies generally requires careful experimental designs, iterative refinement, recruitment of study participants, careful management of participants during the run of the studies, accurately collecting user responses, and expertise in statistical analysis of study results. There are several variables that are taken into consideration which can impact user study outcome if not carefully managed.
viii
Hence the process of conducting user studies successfully can take several weeks to months.
In this dissertation, we investigated how to design an online framework that can reduce the overhead involved in conducting controlled user studies involving web-based visualizations. Our main goal in this research was to lower the overhead of evaluating data visualizations quantitatively through user studies. To this end, we leveraged current research opportunities to provide a framework design that reduces the overhead involved in designing and running controlled user studies of data visualizations. Specifically, we explored the design and implementation of an open-source framework and an online service (VisUnit) that allows visualization designers to easily configure user studies for their web-based data visualizations, deploy user studies online, collect user responses, and analyze incoming results automatically. This allows evaluations to be done more easily, cheaply, and frequently to rapidly test hypotheses about visualization designs.
We evaluated the effectiveness of our framework (VisUnit) by showing that it can be used to replicate 84% of 101 controlled user studies published in IEEE Information Visualization conferences between 1995 and 2015. We evaluated the efficiency of VisUnit by showing that graduate students can use it to design sample user studies in less than an hour.
Our contributions are two-fold: first, we contribute a flexible design and implementation that facilitates the creation of a wide range of user studies with limited effort; second, we provide an evaluation of our design that shows that it can
ix
be used to replicate a wide range of user studies, can be used to reduce the time evaluators spend on user studies, and can be used to support new research.
x TABLE OF CONTENTS CHAPTER PAGE 1 INTRODUCTION ... 1 1.1 Thesis Overview ... 4
1.2 Original Contribution of the Study ... 6
2 LITERATURE REVIEW ... 7
2.1 Background on user studies ... 7
2.1.1 Controlled user studies ... 9
2.1.2 Independent and dependent variables ... 10
2.1.3 Trials ... 11
2.1.4 Examples of controlled user studies ... 11
2.1.5 Typical processes involved in controlled user studies ... 15
2.1.6 Typical protocol used in running controlled user studies ... 16
2.1.7 Within and between subjects study design ... 17
2.1.8 Learning effects ... 18
2.1.9 Controlling fairness and other factors that affect study validity ... 19
2.2 Tasks adapted in user studies ... 19
2.2.1 Recruiting participants ... 21
2.2.2 Web-based and crowdsourced user studies ... 22
2.2.3 Amazon mechanical turk ... 23
2.3 Research trends that motivate this thesis ... 24
2.4 Related work ... 26
2.5 Summary ... 28
3 PROBLEM DEFINITION AND METHODOLOGY ... 30
3.1 Research Problem ... 30
3.2 The need for a framework design that facilitates a wide range of controlled user studies. ... 30
3.2.1 The Existing Problem: ... 32
3.3 Research goals ... 33
3.4 Research Questions ... 33
xi
3.4.2 Middle-Level Questions ... 34
3.4.3 Lower-level questions ... 34
3.5 Research methodology ... 36
3.5.1 Designing a flexible user friendly online framework (VisUnit) that semi-automates the processes of visualization user studies and supports many types of user studies. ... 37
3.5.2 Evaluating the effectiveness and efficiency of VisUnit's design ... 38
3.6 Summary ... 39
4 GRAPHUNIT: A FRAMEWORK TO SUPPORT THE EVALUATION OF GRAPH USER STUDIES ... 41
4.1 Architecture ... 42
4.1.1 Extending GraphUnit with new datasets and tasks ... 44
4.2 Configuration of user studies ... 46
4.2.1 Connecting a visualization ... 46
4.2.2 Configuring ... 46
4.2.3 Putting studies on Mechanical Turk (AMT) ... 49
4.3 Running the user study ... 49
4.4 Optional methods ... 50
4.5 Analyzing study results ... 52
4.6 Evaluation ... 53
4.6.1 Study I - Evaluating node link diagrams vs. matrix diagrams ... 53
4.6.2 Evaluating multiple ways to represent edge directionality in node link diagrams ... 55
4.6.3 Study III - Configuring available visualization for a user study ... 58
4.7 Summary ... 63
5 VISUNIT - A FRAMEWORK THAT FACILITATES EVALUATION OF DATA VISUALIZATIONS ... 64
5.1 Designing VisUnit ... 64
5.2 VisUnit Architecture ... 66
5.3 Setup Interface to support the design of user studies ... 69
5.3.1 Specifying independent variables and experimental conditions ... 69
5.3.2 Specifying experimental design ... 73
xii
5.3.4 Standardized tests ... 74
5.3.5 Pre-study survey questions ... 75
5.3.6 Specifying post-study survey questions ... 75
5.3.7 Specifying study tasks ... 76
5.3.8 Post-study survey questions ... 77
5.3.9 Viewer dimensions ... 77
5.3.10 Running a demo and saving study designs for future use ... 78
5.4 Study Management Interface ... 79
5.5 User study interface to automatically manage study runs ... 80
5.5.1 Study-Run Manager ... 81
5.5.2 Choosing appropriate experimental conditions ... 82
5.5.3 Presenting introductions ... 83
5.5.4 Presenting standardized tests ... 84
5.5.5 Presenting pre-study survey questions ... 84
5.5.6 Presenting study tasks and training ... 84
5.5.7 Presenting post-study survey questions ... 90
5.5.8 Providing task translations ... 90
5.5.9 Providing in-situ task translations ... 91
5.6 Results Interface to support analysis of study results ... 92
5.6.1 Support filtering and cleaning of results data ... 92
5.6.2 Provide graph summaries of the results ... 94
5.6.3 Provide statistical analysis of the study results ... 96
5.7 Extending VisUnit with new tasks and datasets ... 99
5.7.1 Creating new tasks and survey questions ... 99
5.7.2 Creating new task instances ... 106
5.7.3 Adding new datasets ... 108
5.8 VisUnit storage ... 109
5.9 Summary ... 109
6 VALIDATION: EVALUATION OF VISUNIT ... 110
6.1 Evaluating the effectiveness of VisUnit ... 111
xiii 6.1.2 Laidlaw et al. [29] ... 117 6.1.3 Heer et al. [12] ... 117 6.1.4 Haroz et al. [88] ... 119 6.1.5 Robertson et al. [38] ... 120 6.1.6 Jianu et al. [15] ... 122
6.1.7 Discussion of the limitations of VisUnit ... 123
6.2 Evaluating the efficiency of VisUnit ... 116
6.2.1 User study setup ... 125
6.2.2 User study results ... 129
6.2.3 Survey involving researchers who conduct controlled user studies ... 129
6.2.4 Survey results ... 131
6.2.5 Statistical comparison of user study results and baseline survey results ... 133
6.3 Using VisUnit to support research studies ... 135
6.3.1 Ecological validity in quantitative user studies – a case study in graph evaluation ... 135
6.3.2 Original study ... 136
6.3.3 A discussion of ecological validity ... 136
6.3.4 User study ... 140
6.3.5 Results ... 142
6.4 Summary ... 143
7 CONCLUSION AND FUTURE WORK ... 145
7.1 Summary ... 145
7.2 Lessons learned in this research ... 146
7.3 Contributions ... 148
7.4 Future directions ... 149
REFERENCES ... 152
xiv
LIST OF TABLES
TABLE PAGE
2.1: A table showing a within-subject design and a between-subjects design. ... 17 2.2: Low-level tasks that are commonly used in the visualization user studies. .. 20 5.1: Statistical Analysis that are performed depending on the experimental
design of the user study and the number of experimental conditions
involved in the study. ... 98 5.2: Types of effect sizes that are performed depending on the statistical
analysis. ... 98 6.1: The properties of a list of user studies published in InfoVis that can be
supported by VisUnit ... 113 6.2: Results table showing the times in minutes that that it took study
participants to create tasks, create task instances, and design user
studies and see demos ... 129 6.3: Survey results table showing the times researchers expected graduate
students to use in designing the user study. ... 132 6.4: Survey results table showing the time researchers reported to spend on
designing user studies (Q3), running user studies (Q4), and analyzing the results of user studies (Q5). ... 132
xv
LIST OF FIGURES
FIGURE PAGE
2.1: Three different types of directed edges: tapered (a), curved (b), and
arrow-head (c). ... 11
2.2: Two different representations of graph data, node-link (a) and matrix (b). .. 12
2.3: Six different visualization methods for displaying 2D vector data. Image taken from [29]. ... 13
2.4: Three of the stimuli used for judgment tests in Heer et al. [12]. Image taken from Heer et al. [12]. ... 14
2.5: One of the stimuli used for judgment tests in Heer et al. [30]. ... 14
2.6: The typical processes that are involved in user studies. ... 16
2.7: Examples of Latin squares for 2, 3, and 4 conditions. ... 19
3.1: An overview of research questions that were approached and answered in this thesis. ... 35
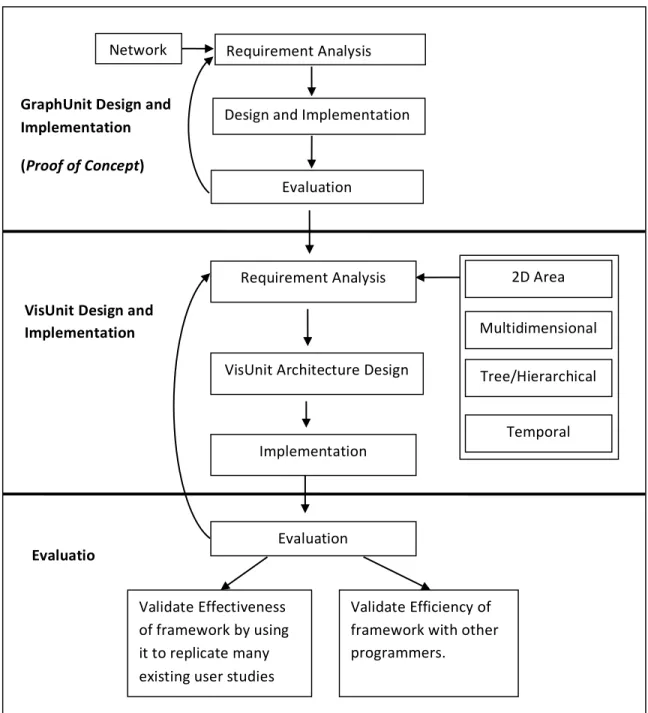
3.2: Overview of research methodology: First, an investigation was done to determine how to design a framework to support user studies of a specific visualization type (i.e. graph network). Second, requirements for different visualization types were analyzed. Third, VisUnit was designed, implemented and evaluated. ... 36
4.1: Architecture of GraphUnit. ... 42
4.2: An example of a task file. ... 44
4.3: Options of quantitative tasks that can be used for the evaluation. ... 45
4.4: An interface for configuring a user study. ... 47
xvi
4.6: An example of a user study, showing three stages: instruction about
task, training, and study. ... 51
4.7: The graph generated for the results of the user studies. Error bars are standard errors. ... 58
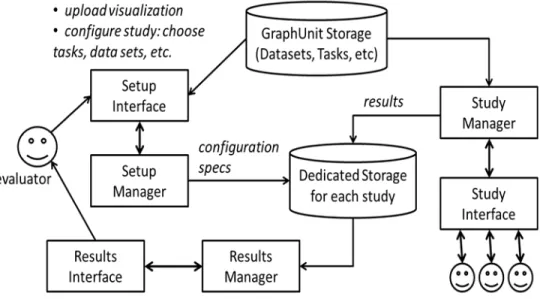
5.1: Architecture of VisUnit ... 68
5.2: Study setup page Part I. ... 70
5.3: Study setup page part2. ... 71
5.4: Study setup page part3 ... 72
5.5: An XML file showing details of a designed user study. ... 78
5.6: A Page for managing existing user studies. ... 80
5.7: The introduction stage of the user study. VisUnit loads the introduction file into an iframe. ... 86
5.8: A short instruction about the tasks and training involved in the user study. ... 87
5.9: Presenting training tasks. Participants can check the accuracy of their answers to quantitative tasks and the study is not timed. ... 88
5.10: Presenting actual study tasks. A countdown timer is started and the viewer window is hidden when the countdown timer gets to zero. ... 89
5.11: Results page (Part 1), showing a results table of the summarized quantitative results, with two rows filtered. ... 94
5.12: Results page (Part2). Showing the number of completed studies, bar charts of the accuracy and completion time of the quantitative tasks, and links to statistical analyses. ... 95
5.13: An interface for creating new tasks. ... 102
5.14: An example of an XML file for tasks. ... 106
xvii
6.1 : Radial tree visualization involved in the designed user study ... 127 6.2 : Collapsible indented tree involved in the designed user study. ... 128 6.3 : A bar-chart showing the mean time of the user study results
(withVisUnit) vs the mean time of the survey results (withoutVisUnit). ... 133 6.4 : Lexicographically ordered AMs (left) cannot reveal graph structure in
the same way that a clustered AM (center) and an NLD (right) can ... 137 6.5 : Available interactions: hovering/selecting a node highlights it and its
edges green/red; hovering a link highlights it and its end-points green. The images illustrate a task 5a instance ... 142 6.6 : Accuracy and time results for the three tasks. ... 143
xviii
LIST OF ABBREVIATIONS AND ACRONYMS 2D Two Dimension
3D Three Dimension
AJAX Asynchronous Javascript AMT Amazon Mechanical Turk ANOVA Analysis of variance CSV Comma separated values GRID Icons on a Regular Grid GUI Graphical User Interface HTML Hypertext Markup Language
HTML 5 Hypertext Markup Language version 5 InfoVis Information Visualization
JIT Icons on a Jittered Grid JSON Javascript Object Notation
LIT Icons using a layer that borrows from oil painting TSV Tab separated values
1 1 INTRODUCTION
Information visualization (InfoVis) is the use of visual representations of abstract data to amplify human cognition [1]. One of the main goals of InfoVis is to enable the quick absorption of large amounts of data by leveraging the powerful human visual system. InfoVis researchers increasingly work on algorithms, visual designs, and interaction techniques for visualizing and analyzing data. The scientific InfoVis process necessarily involves evaluating the effectiveness of such algorithms, designs, and interaction techniques. These investigations are mostly conducted with some form of user-driven evaluation, since the effectiveness of a visualization system is typically measured in terms of its ability to help users extract information or insight from it. As such, user-driven evaluation forms a key element in InfoVis research and human-centered visualization designs [2, 3, 4].
User-driven evaluations, also known as user studies in human centric experiments, are fundamental to validating research contributions in the field of visualization. For example, a new algorithm, visual encoding, or interaction technique is not considered a contribution unless it has been validated to be better than the state of the art and its competing alternatives or has been validated to be useful to intended users. Similarly, a design study (which involves designing a visualization system to support the workflow of a domain expert), is considered a contribution if it is validated to efficiently support the intended workflows of the domain expert. User studies are also instrumental in informing the choices visualization designers make between wide array of visualization types and
2
interaction techniques. For example, a network or relational data can be displayed as either a node-link or a matrix, and each method may support different tasks with different degrees of effectiveness. With the help of a user study, alternatives can be weighed to discover which one is more effective in supporting the goals of the designer. Finally, user studies can highlight problems with visual designs. For example, a user study can be used to pinpoint visualization properties that are problematic to users, which user tasks are inadequately supported by a given visualization, and which changes can be made to improve user experience.
Despite all the listed advantages, conducting user studies is challenging, time consuming, and expensive [2, 3, 5, 6]. These challenges may be a contributing factor to the disproportionately small number of formal user studies done in the infoVis community. For example, Lam et al. [7] revealed that only 42% of 850 papers published in the major visualization venues (between 2002 and 2012) reported an accompanying evaluation. Building infrastructure to facilitate the evaluation of visualizations is seen as a step towards making user studies more feasible for evaluators [8] [9] [10].
The goal of this dissertation is to reduce the overhead involved in designing and running controlled user studies of web-based data visualizations so evaluations can be done more easily, cheaply, and frequently to rapidly test hypotheses about visual designs. This goal was pursued with the following two objectives and contributions:
Contribution 1: Design of a framework (VisUnit), that can reduce the
3
friendly, and is sufficiently flexible to support a wide range of user study types. Prior to this work, such a framework did not exist, and there were no design recommendations for implementing one.
To this end we explored requirements for the design from previous user studies in the information visualization literature. Key technologies were explored and leveraged. A prototype framework (GraphUnit) that facilitates graph user studies was designed, implemented, and evaluated. Several user studies were ran to gather more requirements for different user study and visualization types; and VisUnit was designed and implemented. VisUnit is offered as an open source framework to be used and extended by the visualization community, and is also offered as an online service to provide real time support and time saving functionalities for user study evaluators.
Contribution 2: An evaluation of the effectiveness and efficiency of using such a framework (VisUnit) to support a wide range user study types.
To this end we demonstrated the effectiveness of the design, VisUnit, by showing that it can be used to replicate a wide range of existing user studies. Specifically, 84% of 101 controlled user studies published in IEEE Information Visualization conferences between 1995 and 2015 can be replicated with VisUnit. These user studies involve graphs, multidimensional visualizations, trees, 2D areas, and temporal visualizations. We also conducted a user study involving 5 computer science students to demonstrate the efficiency of the design. Students were asked to design user studies to evaluate alternate visual encodings using freely available web visualizations. On average, it took participants one hour to
4
design a study. In summary, the study portrays the efficiency of the design by showing that evaluators can use VisUnit to design user studies in less than an hour, run studies and analyze study results within a day.
An important merit of our work is recognizing that current research trends create the opportunity to significantly simplify and stream-line the evaluation of data visualization systems. First, current advances in web development such as HTML5, D3 [11], and WebGL, have prompted a migration of visualizations towards the web with increasing number of visualizations being targeted at web-based users. Second, crowdsourcing has been established as an effective tool for evaluating visualizations [12, 13, 14, 15]. Third, the visualization community has standard design guidelines [2, 3, 5, 6, 16, 17, 7] and task taxonomies [18, 19, 20, 21, 22, 23] to support the evaluation of visualizations. These advances create two opportunities: First, the overhead of evaluating visualizations can be lowered by semi-automating the processes involved in designing and running user studies, by managing study participants on the web and collecting their data automatically. Second, the size of study participants can be expanded, and studies can be targeted to users of diverse or specific demographics and expertise. This dissertation investigated a design of a framework to help user study evaluators harness these opportunities.
1.1 Thesis Overview
The dissertation is organized into 7 chapters. Introduction and motivation for the study are contained in Chapter 1, while the conclusions and contributions of
5
the study are presented in Chapter 7. Chapter 2 provides background information, literature review and related work necessary for laying the basic foundation of the entire study. Chapter 3 presents problem definition and methodology used in this dissertation whiles providing information on the key questions to be addressed.
Chapter 4 introduces the design, implementation, and evaluation of a prototype framework, GraphUnit, that semi-automates the process of designing, running, and analyzing results of graph user studies. GraphUnit simplifies the process of designing and fielding controlled quantitative user evaluations of web-based graph visualizations. This prototype provided a solution for a smaller problem that helped fine-tune the general design requirements and also helped test hypotheses on a smaller scale. The design and primary results contained in this chapter have been published in the Computer Graphic Forum (CGF) journal. GraphUnit is currently available as open-source software at
http://vizlab.cs.fiu.edu/graphunit/
Chapter 5 describes the novel design and implementation of VisUnit, a framework that semi-automates the process of designing, running, and analyzing results of a wide range of user studies that involve many visualization types. VisUnit is flexible, user-friendly and allows evaluators to design user studies with their own tasks and datasets, automatically manages the run of user studies. VisUnit automatically generates statistical analyses for finished studies, and provides functionalities to support the cleaning of results data. The detailed architecture and design of VisUnit are intended for submission to the IEEE Transactions on Visualization and Computer Graphics (TVCG) journal.
6
Chapter 6 evaluates VisUnit's effectiveness by showing that it can be used to replicate several existing user studies in the visualization literature, and also describe an example of a research work that was supported by VisUnit. The efficiency of VisUnit was tested by evaluators with advance degrees in the field who are familiar with information visualization and who are unaffiliated to this project. VisUnit is currently available as open-source software at
http://vizlab.cs.fiu.edu/visunit/
1.2 Original Contribution of the Study
The major original contributions of this dissertation, which can be found in Chapters 4, 5, and 6 discusses the significance of this work primarily to the field of information visualization. First, this dissertation introduced a novel design that facilitates web-based user studies and supports a wide range of user study types. Secondly, an implementation of an open-source system and an online service that offers time saving functionalities to evaluators was introduced. Thirdly, we provide evaluations to demonstrate the efficiency and effectiveness of our design to support a wide range of user studies, and we provide an example of a research work that was supported by our design. Ultimately, this research offers a new way of designing web-based infrastructure to facilitate user studies, and shows the potential impact of VisUnit to the visualization community.
7 2 LITERATURE REVIEW
This chapter presents a detailed background information on user studies, research trends that motivated this dissertation, as well as previous works related to this dissertation.
2.1 Background on user studies
Information visualization (InfoVis) is the study of visual representations of abstract data to amplify human cognition [1]. InfoVis researchers study algorithms, visual designs, and interaction techniques for visualizing and analyzing data.
This thesis targets evaluation studies involving real users that allow visualization designers to obtain empirical evidence of the usability of their designs [2]. User studies play an important role in data visualization research because they allow us to measure the strengths and weaknesses of different visualization techniques, provide insight into what makes one technique more effective than another, demonstrate the practical use of new techniques, and inform refinement and redesigns of techniques [2, 5].
User studies are fundamental to validating research contributions in the field of visualization. For example, a new algorithm, visual encoding, or interaction technique is not considered a contribution unless it has been validated to be better than the state of the art and its competing alternatives or has been validated to be useful to intended users. User studies are also instrumental in informing the choices visualization designers make between the wide array of visualization types
8
and interaction techniques. For example, a network or relational data can be displayed as either a node-link or a matrix. Knowing which visual encoding is better for a specific case will depend on the task that the visualization will be used to perform, the data, or the domain. With the help of a user study, alternatives can be weighed to know which one is more effective in supporting the goals of the designer.
However, conducting user studies is challenging, time consuming, and expensive [2, 3, 5, 6, 17]. Challenges faced by evaluators include finding the right variables to evaluate, picking the right tasks and datasets, choosing the right methodology, and being rigorous in procedure and data collection. Evaluators also face challenges in recruiting participants and analyzing study data [1, 7]. These challenges may partly explain a widening gap between technique development and their independent formal evaluation in the visualization community. For example, the most recent comprehensive graph drawing survey cited about 100 papers on techniques and only about 30 papers on design and evaluation studies together [15, 24]. Lam et al. [7] also revealed that only 42% of 850 papers published in the major visualization venues (between 2002 and 2012) reported an evaluation. The work presented in this dissertation helps reduce the overhead involved in conducting controlled user studies and allows evaluators to easily design study protocols, field such studies with online crowdsourcing, and receive appropriate analyses of the study results.
In visualization research, user studies can broadly be grouped into three categories [2]: controlled studies - which compare two or more designs
9
quantitatively; usability evaluations - which are used to identify problems users encounter with a design; and case studies - which are used to observe how users use designs in their natural environment. Case studies and usability evaluations both answer evaluation questions with subjective human responses with the goal of deriving information that can be used to improve a given visualization system.
Controlled user studies on the other hand are quantitative studies aimed at producing generalizable and reproducible results [7]. This dissertation focused on controlled user studies because they follow an established methodology, are challenging to conduct, can be successfully run with web-based or crowdsourced participants, and are common in the visualization community [7, 25].
2.1.1 Controlled user studies
Controlled user studies are quantitative studies used to compare two or more visualizations or interactive techniques by measuring human performance (typically accuracy and time) on simple tasks abstracted from real life tasks. For example, a controlled study can be employed to determine if a node-link visualization is better at depicting graph connections than a matrix visualization by allowing study participants to repeatedly identify if two selected nodes are connected in each visualization and comparing their performance in the two visualizations.
In controlled user studies, evaluators follow a rigorous process of developing hypotheses, identifying independent variables, choosing tasks that users will perform, measuring dependent variables such as performance time and accuracy, and using statistics to declare confidence in the results [17]. Ultimately, due to the
10
relatively high precision in controlling experimental factors and measuring dependent variables, study results of controlled user studies can be generalized to a larger population [17].
2.1.2 Independent and dependent variables
Independent variables are characteristics related to the properties of a visualization system that can be manipulated or controlled in an experiment for a change in user behavior [26]. Independent variables are manipulated across at least two levels of the characteristic. In visualization, an independent variable can take the form of a visualization type or visual encoding, (e.g. different visual encodings for representing multidimensional data, such as parallel coordinate plots vs. star plots), an interaction technique (e.g. different ways of performing a selection), or a dataset (e.g. a small dataset vs a big dataset). The levels of an independent variable are known as "test conditions" or "conditions".
Dependent variables on the other hand are human behaviors that can be measured whiles users are interacting with the independent variables. The common dependent variables used in visualization experiments are task completion time and task accuracy (or error rate). More broadly, dependent variables can be any measurable human behavior that can provide an insight into the difference in strength for any two test condition such as answer re-entries, number of interactions used, or amount of time spent in training [26].
11 2.1.3 Trials
Typically, each user task is repeated with several task instances, each of them is known as a trial, and the mean of the trials is taken as the user's performance on the user's task. For example, for the connectivity graph task "Are the two highlighted nodes connected?", there will be several trials or task instances, with each trial having two different highlighted nodes.
2.1.4 Examples of controlled user studies
Below are examples of controlled user studies in visualization.
Example 1 - Holten et al. [27] investigated how different types of directed edges (Figure 2.1) affect user performance on graph tasks. The independent variable used was "directed edge", and the test conditions of the independent variable were "tapered edge", "curved edge", and "arrow-head edge". The measured dependent variables were accuracy and completion time.
12
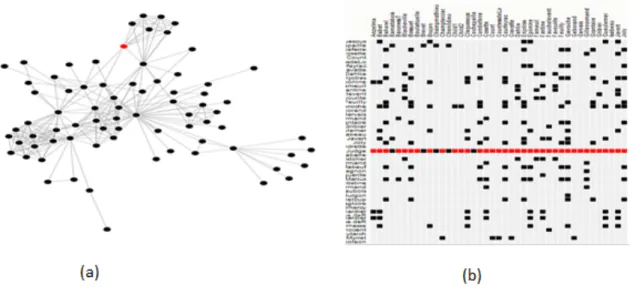
Example 2 - Ghoniem et al. [28] investigated the readability of two different graph representations (Figure 2.2) on graph tasks. The independent variable used was "graph representation", and the test conditions of the independent variable were node-link, and matrix. The measured dependent variables were accuracy and completion time.
Figure 2.2: Two different representations of graph data, node-link (a) and matrix (b).
Example 3 -Laidlaw et al. [29] compared six visualization methods used for displaying two dimensional vector data (Figure 2.3) using tasks related to fluid mechanics. The independent variable used was "visualization methods for 2D vector data", and the test conditions were icons on a regular grid (GRID), icons on a jittered grid (JIT), icons that borrow concepts from oil painting (LIT). The measured dependent variables were accuracy and completion time.
13
Figure 2.3: Six different visualization methods for displaying 2D vector data. Image taken from [29].
Example 4 - Heer et al. [12] compared judgment types corresponding to different types of visual encodings (Figure 2.4) using judgment tasks. The independent variable used was "types of judgments", and the test conditions were "judgment based on position along a common scale", "judgment based on length", and "judgment based on "angle". The measured dependent variables were
14
accuracy and completion time.
Figure 2.4: Three of the stimuli used for judgment tests in Heer et al. [12]. Image taken from Heer et al. [12].
Example 5: Heer et al. [30] evaluated the effect that chart size and layering have on perceptions of time series visualizations (Figure 2.5) using judgment tasks. The independent variable used was "chart type - size type", and the test conditions used include 3 (charts) x 4 (chart sizes). The measured dependent variables were accuracy and completion time.
15
2.1.5 Typical processes involved in controlled user studies
The methodology of quantitative empirical evaluations has been around for centuries and they include developing hypothesis, identifying independent variables, controlling other factors of the study, measuring dependent variables, and applying statistics to the study [31, 32]. Controlled user studies in visualization generally follow this established methodology [17].
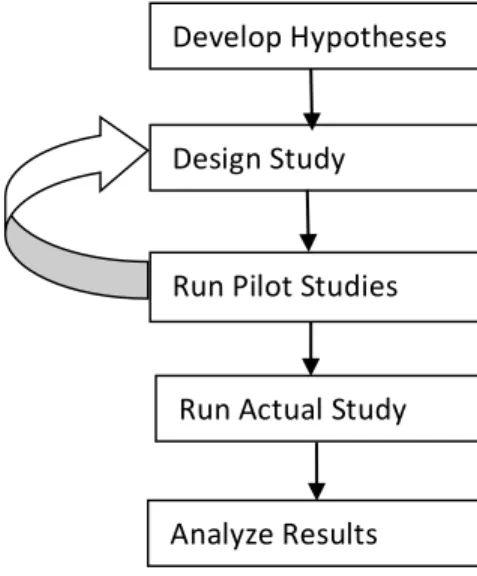
The processes commonly used by evaluators can be grouped into 5 stages [13, 29, 33, 34, 35, 36, 37, 38]:
Stage1: Develop hypothesis - identify the independent variables for the study (i.e. visualizations or datasets or combination of visualization and dataset), identify the dependent variables, and identify the tasks to be performed.
Stage 2: Design the study - specify the independent variables, specify the dataset(s) and tasks to be used, specify the dependent variables, and specify the experimental design of the study (i.e. within-subject or between-subject).
Stage 3: Run pilot studies with participants - have participants perform the study to identify problems with the study design.
Stage 4: Run actual study with participants - have participants perform tasks with the appropriate test conditions, and measure and save dependent variables.
Stage 5: Filter results and analyze results - clean the data and perform statistical analysis of the results.
Problems discovered and observations made during pilot studies are addressed iteratively to improve the user study design. The actual study is run after successful run of pilot studies. Afterwards, results are analyzed with statistics to
16
determine the effects that the independent variables have on the dependent variables.
Aside stage1, where the evaluator makes decisions on the visualization to evaluate and the data and tasks to use for the user study, stages 2 through stage 5 can be automated. This dissertation therefore focuses on how to facilitate or automate these processes listed in figure 2.6.
Figure 2.6: The typical processes that are involved in user studies.
2.1.6 Typical protocol used in running controlled user studies
A typical controlled study protocol has pre-study, actual-study, and post-study activities. Pre-study activities include providing an introduction of the experiment to participants, having participants sign consent forms, and gathering demographic data (e.g. age, gender, and experience). Pre-study activities also include demonstrating the tasks with examples, and allowing participants to perform practice trials of the tasks they will be performing in the study. Additionally, pre-study activities sometimes include providing participants with standardized tests
Develop Hypotheses Design Study
Run Pilot Studies
Analyze Results Run Actual Study
17
that measure their characteristics, such as color-blindness test, perceptual speed test, and visual working memory test. Actual-Study activities include having participants perform the tasks with the appropriate test conditions, measuring and saving dependent variables related for the tasks. Post-study activities include gathering data on the experience and opinions of participants using a questionnaire. For example, users can be asked to rate their experience on a Likert scale and provide their comments and preferences among competing test conditions.
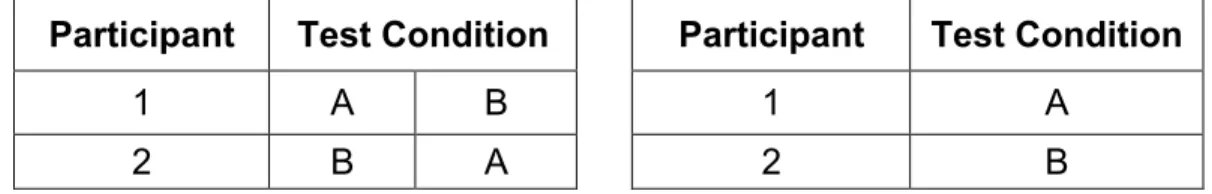
2.1.7 Within and between subjects study design
Studies can either be designed as within-subjects or between-subjects. The Table 2.1b below illustrates how test conditions are assigned to participants. In within-subjects (also known as repeated measure), each participant performs the study tasks with all the test conditions, one after the other as illustrated in Table 2.1a. In between-subjects studies, each participant performs the tasks with only one of the test conditions being evaluated (Table 2.1b).
Table 2.1: A table showing a within-subject design and a between-subjects design.
a) Within-subjects design (b) Between study design
Participant Test Condition Participant Test Condition
1 A B 1 A
18
Using a within-subjects or a between-subjects study design comes with advantages and disadvantages [26]. A key advantage of within-subjects studies is that it requires fewer study participants because subjects are tested on all conditions. As a result, behavioral differences of subjects have less impact on the variance of the study data because subjects are likely to exhibit their performance behavior across all conditions. On the other hand, within-subjects studies require longer study duration, and results can be compromised by learning effects or fatigue.
2.1.8 Learning effects
Learning effects occur due to the order in which conditions are presented, for example if participants performed tasks with condition A before performing the same tasks with condition B, they may perform better with condition B due to experience gained from condition A. However, there are protocols to minimize learning effects such as counterbalancing where subjects are first placed in groups and the order of conditions are presented differently to each group using a Latin Square. For example, if there are two conditions in the study (condition A and condition B), subjects can be equally assigned to two groups (Group 1 and Group 2), Group 1 members will perform tasks with condition A before condition B, and Group 2 members will perform the tasks with condition B before condition A. An example of a Latin square ordering for 2, 3, and 4 test conditions is illustrated in Figure 2.7. A more robust Latin square has also been recommended by other
19
researchers which include having a balanced table in which conditions follow each other equally [26]
.
Figure 2.7: Examples of Latin squares for 2, 3, and 4 conditions.
2.1.9 Controlling fairness and other factors that affect study validity
The validity of user studies can be affected by several factors, these include: providing unfair experiences across participants, having inconsistent instructions and tasks across participants, providing unequal training to participants, overstressing participants, and learning effects [5, 17]. If these factors are not controlled properly, they can lead evaluators to make erroneous conclusions about studies. Example includes, finding a relationship between the independent and dependent variables when there is none (type I error) and not finding a relationship when there is one (type II error) [17]. These types of errors indicate that performing valid user studies require skill, carefulness and rigorous work.
2.2 Tasks adapted in user studies
One important component of user studies is the tasks users perform. Tasks commonly used in user studies range from low-level domain-independent taxonomy tasks such as the taxonomies of Amar et al. [39], Lewis et al. [40], and
20
Zhou et al. [41], to compound and domain-specific tasks that build on these low-level tasks such as the graph taxonomy [18], and the network evolution taxonomy [21]. Table 2.2 shows the low-level tasks commonly used in visualization user studies. The focus of this work is on how to present these tasks to users and how to accurately receive and validate responses of these tasks.
Table 2.2: Low-level tasks that are commonly used in the visualization user studies.
Low-Level Tasks Description
Retrieve value [39] Find attributes of a set of data cases.
Filter [39] Find data cases whose attribute values satisfy a set of conditions. Compute Derived Value
[39]
Compute an aggregate numeric value representation of a set of data cases.
Find extremum [39] Find data cases that have an extreme value of an attribute Sort [39] Rank a set of data cases according to some ordinal
metric.
Determine Range [39] Find the span of values of an attribute within a set of data cases.
Characterize distribution [39]
Characterize the distribution of a quantitative attribute's values over a set of data cases.
Find anomalies [39] Identify any anomalies within a set of data cases with respect to a given relationship or expectation. Cluster [39][40][41] Find clusters of similar attribute values within a set of data
cases.
Correlate [39][40][41] Determine useful relationships between the values of two attributes of a set of a data cases. Scan [18] Quickly review a list of items.
Set Operation [18] Perform set operations on sets of data cases E.g. intersection.
21
Identify [40][41] Find a data case that was not necessarily known previously.
Distinguish [40] [41] Find differences in attribute values between sets of data cases. Categorize [40] [41] Find divisions that a set of data cases can be sorted by. Distribution [40] Describe the overall pattern of a set of data cases. Rank [40][41] Find the order of a set of data cases based on values of
an attribute.
Compare [40] Compare a set of similar data cases based on some attributes. Associate [40][41] Find the relationship between sets of data cases.
2.2.1 Recruiting participants
In lab-based user studies, participants are usually solicited through several mediums such as email, word-of-mouth, phone calls, and wall notices [26]. Participants have to be scheduled on days and times within the week that is favorable to them. Due to this, studies that require large number of users can run into weeks, and even months. Participants are also compensated for their time. Generally, the recommended compensation is at least the minimum wage rate to be able to attract enough prospective participants [12].
Ideally, participants should be drawn at random from a broad population. However, the common practice in lab-based studies is that, participants are selected from an available group of people such as undergraduate and graduate students, and work colleagues [26, 13]. Results from such studies can compromise the external validity of a research in cases where the population used for the study is too different than the intended population [26].
22
Recruiting and managing diverse and large number of participants for lab-based studies is challenging and can lead to user studies lasting for weeks and months. As such, most lab-based user studies are used as a final validation of research projects. A framework that reduces the effort required in running user studies will enable user studies to be done within hours or days, which will enable designers and researchers to frequently evaluate competing visual designs.
Additionally, recruiting domain experiments for experiments is a challenge, because domain experts are rarely free to participate in lab-based user studies. A framework that automates the management of user studies on the web will also provide an opportunity to get access to busy participants such as domain experts who can perform the study at their own free time.
2.2.2 Web-based and crowdsourced user studies
The web provides tremendous opportunities for empirical researchers to perform experiments and evaluate ideas quickly, as such web-based experiments is increasingly popular in several research fields [12, 15, 42, 43, 44, 45]. Furthermore, advancements in web technologies such as HTML5, D3 [11], and WebGL, has also made it possible to increasingly develop interactive web-based visualizations and perform web-based user studies. A web-based user study provides the opportunity of having access to many participants from different parts of the world. In addition, it provides the opportunity to distributes studies easily through email requests, posting on forums, and sharing on social media platforms.
23
Crowdsourcing user studies refers to the process of recruiting a group of web-based participants to perform tasks that require human effort. Crowdsourcing takes many forms such as gamification [46], wisdom of the crowd [47], and peer-production science [48]. Crowdsourcing platforms such as Amazon Mechanical Turk provide an infrastructure for deploying experiments and recruiting diverse user populations to participate in the study. This dissertation provides a design that supports both web-based user studies and user studies performed with crowdsourced participants.
2.2.3 Amazon mechanical turk
Amazon Mechanical Turk (AMT) [49] [50] is a paid crowdsourcing platform where Requesters (employers) post microtasks known as Human Intelligence Tasks that are completed by Workers (employees). Payments can be as low as $0.01 and rarely exceeds $1, but AMT recommends rewarding user effort based on the minimum wage. Requesters can also choose to reward good work with bonuses and choose not to pay Workers that perform very badly.
Workers are anonymous to requesters, and they can be pre-screened or filtered with "Qualifications" such as level of experience, and country of residence. The Qualification feature opens opportunities for performing research with specific user groups and the possibility of performing longitudinal user studies with selected class of users [50].
The low cost and relative ease of recruiting large number of participants makes Amazon Mechanical Turk an attractive platform for large scale experimentation.
24
AMT has been used to successfully run research experiments in information visualization and several areas of Computer Science such as HCI [51], Computer Vision [52], information Retrieval [53], and Natural Language Processing [54].
This research provides a design that leverages crowdsourcing platforms such as Amazon Mechanical Turk to support the recruitment of participants for web-based user studies.
2.3 Research trends that motivate this thesis
This dissertation leverages four recent research trends in information visualization research. First, guidelines and protocols for fielding evaluation studies effectively are becoming increasingly standardized [2, 3, 5, 6, 7, 16, 17]. For example, Carpendale provided guidance on the different quantitative and qualitative evaluation approaches [17], Munzner presented the appropriate evaluation methodology to use for different design choices [16], and Lam et al. [7] provided an overview of current evaluation practices in visualization.
Second, online crowdsourcing platforms such as Amazon Mechanical Turk (AMT) have been shown to be valid for running evaluative visualization research [12, 13, 14, 15], and crowdsourcing has several advantages over on-site experimentation. These includes easy access to a diverse population of participants, low cost of experiments, and fast iteration between hypothesis formation and hypothesis testing [13, 55]. Heer et al. [12] replicated previous laboratory studies of spatial encoding and luminance contrasts on AMT to show that results obtained online can match results obtained in laboratory studies.
25
Kosara et al. [13] successfully leveraged AMT to replicate a previous lab study on how visual metaphors affect users' understanding of node-link and treemap diagrams. More recently, Jianu et al. [15] used AMT to evaluate how four different node-link visualization methods display group information, and Boukhelifa et al. [14] employed AMT to investigate how sketchiness can serve as a visual variable to encode data uncertainty in information visualization. Following the same trend in HCI, Komarov et al. [56] re-implemented three previous experiments on user interface designs both in the lab and on AMT, and did not find any significant difference in accuracy, time, and consistency between the two settings. All such studies were specific and manually set up. This research leverages AMT to semi-automate the evaluation of visualization user studies.
In addition, advances in web technologies such as Asynchronous Javascript and XML (AJAX), HTML5, WebGL, Data Driven Documents (D3) [11], and Processing [57] have caused a transition of visualization development from desktop to the web, and as such, an increasing number of visualizations are prototyped and developed directly to run in web-browsers [58, 59, 60].
Finally, standard task taxonomies and datasets have been organized in the visualization community for the evaluation of specific types of visualizations. These task taxonomies include Lee et al. for graphs [18], Saket et al. for group-level graphs [19], Valiati et al. for multidimensional visualizations [20], Ahn et al. for network evolution analysis [21], and Fekete et al. for tree visualizations [22]. Benchmark datasets include datasets used for the InfoVis contests 2003 - 2005 [23].
26
These four trends make it now feasible to stream-line user study evaluation by assembling user studies that conform to standard evaluation protocols and uses taxonomy tasks linked to benchmark datasets; fielding such user studies online using web-visualizations; and using crowdsourcing to automatically recruit study subjects. The proposed methodology of integrating these four research trends is novel, even though efforts to simplify the design of experiments exist.
2.4 Related work
There are previous systems that have worked on simplifying how controlled user studies are designed and run in data visualization and HCI. TouchStone [61] is a platform for designing and running lab-based user studies. It facilitates the process of creating new experiments and extending existing experiments. However, it was targeted at HCI experiments that evaluate pointing and navigation interaction techniques; and it supports tasks that require answers through interaction but not other types of inputs such as text or numbers.
The Hierarchical Visualization Testing Environment (HVTE) [62] is a testing environment for running comparative studies of hierarchy browsers. It launches predefined tasks, and records users answers and completion times. However, it was built on top of a Java framework for visualizing hierarchies and it is tightly coupled to that framework.
EvalBench [63] is a software library that supports controlled lab-based visualization user studies. It provides commonly used evaluation methods and functionalities that evaluators can use to simplify their work such as generating
27
answer widgets, and logging user answers and interactions. However, EvalBench requires additional implementation effort from evaluators. Evaluators have to extend and implement interfaces, and modify the source code for the design of a study. Implementation efforts for the use of EvalBench can be as much as 800 lines of codes (LOC).
Experimentr [64] is a light-weight library that aims to support module-based evaluation of web-based visualization systems. It is an unpublished work-in-progress, and currently provide helper functions and sample modules that evaluators can use. Experimentr [64] however, do not support the design and running of experiments.
A More recent work is VEEVVIE [65] which supports the analyses of result data of visualization and virtual reality user studies. They provided tools such as heatmaps, parallel coordinates, and other widgets to support the exploration of results data. Their motivation for simplifying the data analysis process is close to the motivation of this research. Although VEEVVIE provides visual exploration of the data, the tool presented in this study automatically generates graphs and appropriate statistical analyses of the data which is absent from VEEVVIE.
This research work is also closely related to research efforts to provide infrastructure that facilitate experimentation in human computation experiments, social experiments, and website usability experiments. For example, Bakshy et al. [66] provided a language to simplify web-based randomized field experiments; their language provides a library to separate experimental design from application logic, however, it is not user friendly, and requires a significant amount of code
28
writing from evaluators. TurkServer [67] provides a framework that supports designing and running human computation and social experiments on Amazon Mechanical Turk, but it also requires a significant amount of code writing on both client and server sides. CrowdStudy [68] also provides a framework that supports designing and running website usability experiments with online study participants. This research work differs from these efforts by focusing on supporting processes involved in visualization user studies.
This dissertation was also inspired by TurkIt [69], a toolkit that leverages crowdsourcing for iterative text editing tasks, and CrowdDB [70], a system that uses crowdsourcing to answer queries that cannot be otherwise answered by traditional database systems. However, these systems do not support visualization user studies.
2.5 Summary
This research work differs from the above efforts of simplifying and facilitating user studies and experiments. First, this research work provides a design and implementation of a framework that facilitate a wide range of web-based user studies, which differs from TouchStone [61] that was targeted at lab based HCI experiments, HVTE [62] that was targeted at specific hierarchical browsers, and EvalBench library [63] that provides reusable functionalities to support lab-based visualization studies. Second, this research work provide a high degree of simplicity and automation derived from the use of standardized protocols which differs from EvalBench [63] that requires significant implementation effort from
29
evaluators. Third, this research work provides a design that enables evaluators to design user studies with a user-friendly interface, automatically manage the run of web-based user studies, and automatically analyze results of user studies with minimal effort.
30
3 PROBLEM DEFINITION AND METHODOLOGY
This chapter presents the research problem, describes the research goals in detail, presents the research methodology, and describes the research questions that were addressed.
3.1 Research Problem
The problem investigated in this research was how to design an online framework that can reduce the overhead involved in conducting controlled user studies involving web-based visualizations. Currently such a framework does not exist and there is no clear design guideline in the literature on how to design and build such a framework that is user-friendly and flexible to support many types of studies and tasks.
3.2 The need for a framework design that facilitates a wide range of controlled user studies.
User studies are commonly used in information visualization to validate research contributions and validate effectiveness of design decisions. For example, imagine the following scenarios:
Scenario 1: John has developed a new visual encoding to represent multidimensional data. John will have to perform a user study to compare his new visual encodings with the state of the art visual encodings such as parallel coordinate plots and start plots in order to validate the effectiveness of his design.
31
Scenario 2: Kate have designed a novel interaction technique for performing overview+detail. Kate will have to compare her new interaction technique with the state of the art such as "pan and zoom" and fisheye lens to validate the effectiveness of her design or to identify the unique functionalities of her design.
Scenario 3: Mark is developing a visualization system for a given data, domain, or task; Mark want to choose the right visualization or the right visualization properties that will be more effective or useful for his specific domain and tasks. First Mark can use guidelines in the visualization literature and choose the right visualization and/or visualization properties that apply to his condition. In situations where there are no specific guidelines, Mark can perform user studies to choose the right visualization and the right visual properties for his specific condition. After the visualization is done, Mark can also conduct a user study to see how best his solution supports the intended tasks.
As can be seen in the above scenarios, user studies are central to information visualization researchers as well as visualization designers. Apart from its importance in evaluating finished designs, user studies are also essential to support decisions that visualization designers make during the developmental stages of a visualization design. During a visualization design, designers make a lot of decisions on variables such as size, value, area, surface, volume, texture, color, orientation, and shape [71] [72]. Each of these variables have different expressive power depending on the data, domain, or intended tasks. As such using user studies to choose the right variables enables evaluators to make more informed decisions.
32 3.2.1 The Existing Problem:
User studies generally requires careful experimental designs, iterative refinement, recruitment of study participants, careful management of participants during the run of the studies, accurately collecting user responses, and expertise in statistical analysis of study results. There are several variables that are taken into consideration which can impact user study outcome if not carefully managed. Hence the process of designing user studies, running pilot studies, and successfully running the actual studies can take several weeks to months.
Due to the huge amount of time and expertise required for user studies, it is not surprising that user studies have been used predominantly to evaluate finished designs. But finished designs can be inherently complex, and as noted by Walenstein [73] and Tory et al. [3] they can also be problematic and error prone. For example, uncontrolled features in a given visualization system can dominate results and lead to unexpected study outcomes. As such, it will be beneficial to have user studies focus on comparing the effectiveness of design ideas and on hypothesis that are easily testable. However, given the amount of time required to run user studies, running many different studies to evaluate different design ideas and hypothesis can be time consuming and challenging.
Based on these limitations, having a design that facilitates user studies will save evaluators considerable time on designing and running user studies. Such a framework will also enable evaluators to run many different user studies to test
33
different design ideas and hypothesis involved in designing visual encodings, interactive techniques, or domain based visualization design.
3.3 Research goals
The main goal of this research project was to lower the overhead of evaluating data visualizations quantitatively through user studies. To this end, the study implemented the research goal with the following objectives: (1) Design an online framework (VisUnit) that semi automates the processes involved in the evaluation of visualization user studies, which is flexible to support many tasks and visualization types. (2) Evaluate the effectiveness (ability to support a wide range of user studies and efficiency (ability to save evaluators time) of such an online framework in supporting visualization user studies.
3.4 Research Questions
To achieve the research objectives, three different levels of research questions categorized as high-level, middle-level, and low-level (Figure 3.1) were addressed.
3.4.1 High-Level Questions
On the high-level, the following two research questions were addressed. (1) "How can we design a framework that is user-friendly and flexible to semi-automate web-based user studies of many visualization types and task types?". Answering this research question is important to solve the main research problem. (2) "Can this framework be effective and efficient to facilitate a wide range of user
34
studies?". Answering this question is important to evaluate the effectiveness and efficiency of the solution to the research problem.
3.4.2 Middle-Level Questions
On the middle-level, smaller research questions were explored to help achieve the high-level research questions. These research questions include: "How can we support the design of web-based user studies?", "How can we support the automatic running of user studies?", "How can we support the analysis of user study results?", "How can the framework be made extensible with task types, task instances, and datasets?", "How can this framework design be made effective?", and "How can this framework design be made efficient?"
3.4.3 Lower-level questions
On the low-level, low level design and implementation questions were explored to help address the research questions at the middle-level. These questions include how to design the architecture of VisUnit, how to design interfaces, and how to design and implement research solutions in general.
![Figure 2.3: Six different visualization methods for displaying 2D vector data. Image taken from [29]](https://thumb-us.123doks.com/thumbv2/123dok_us/809321.2602337/32.918.210.776.108.543/figure-different-visualization-methods-displaying-vector-image-taken.webp)
![Figure 2.4: Three of the stimuli used for judgment tests in Heer et al. [12]. Image taken from Heer et al](https://thumb-us.123doks.com/thumbv2/123dok_us/809321.2602337/33.918.180.758.105.362/figure-stimuli-judgment-tests-heer-image-taken-heer.webp)