Repository ISTITUZIONALE
Estimation of the return period of rockfall blocks according to their size / DE BIAGI, Valerio; Napoli, MARIA LIA; Barbero, Monica; Peila, Daniele. In: NATURAL HAZARDS AND EARTH SYSTEM SCIENCES. ISSN 16849981.
-ELETTRONICO. - 17(2017), pp. 103-113. Original
Estimation of the return period of rockfall blocks according to their size
Publisher: Published DOI:10.5194/nhess-17-103-2017 Terms of use: openAccess Publisher copyright
(Article begins on next page)
This article is made available under terms and conditions as specified in the corresponding bibliographic description in the repository
Availability:
This version is available at: 11583/2664274 since: 2017-07-11T12:54:58Z
doi:10.5194/nhess-17-103-2017
© Author(s) 2017. CC Attribution 3.0 License.
Estimation of the return period of rockfall blocks according
to their size
Valerio De Biagi1, Maria Lia Napoli1, Monica Barbero1, and Daniele Peila2
1Department of Structural, Geotechnical and Building Engineering, Politecnico di Torino, Corso Duca degli Abruzzi 24,
10129 Turin, Italy
2Department of Environmental and Infrastructural Engineering, Politecnico di Torino, Corso Duca degli Abruzzi 24,
10129 Turin, Italy
Correspondence to:Valerio De Biagi ([email protected])
Received: 1 July 2016 – Published in Nat. Hazards Earth Syst. Sci. Discuss.: 5 July 2016 Revised: 12 December 2016 – Accepted: 27 December 2016 – Published: 30 January 2017
Abstract.With reference to the rockfall risk estimation and the planning of rockfall protection devices, one of the most critical and most discussed problems is the correct definition of the design block by taking into account its return period. In this paper, a methodology for the assessment of the design block linked with its return time is proposed and discussed, following a statistical approach. The procedure is based on the survey of the blocks that were already detached from the slope and had accumulated at the foot of the slope in addition to the available historical data.
1 Introduction
Rockfall is one of the most critical slope instabilities because it can be highly destructive and unpredictable. The analysis of this phenomenon is very difficult because it is affected by aleatory variability (irreducible natural variability) and epis-temic uncertainty (lack of knowledge). For these reasons, probabilistic methods are a suitable approach for modelling rockfall. When risk analysis has to be performed for forecast-ing and protection purposes, the size of the involved blocks and the corresponding return period are the most important variables among the ones that characterize the phenomenon (Peila et al., 1998, 2006; Peila and Ronco, 2009).
Modern design approaches for buildings, for example, aim to guarantee the structural safety of the building throughout its expected lifetime. In such reliability-based framework, the buildings have to be robust, i.e. to support forces due to an-thropic and natural hazards without being significantly
dam-aged. Proper design processes for common natural hazards, such as extreme winds or seisms, are already present in the building codes (Elishakoff, 1999; ISO, 1998; Leporati, 1979; Madsen et al., 2006; Melchers, 1999); these define the mag-nitude of the external force on the base of the probability of exceeding such intensity during the design life of the struc-ture. In addition, the structural safety must be guaranteed on the base of the consequences caused by natural hazards on the structure (vulnerability).
Dealing with natural hazards, one of the common ways to input the external forces applied to the structures is to estab-lish a link between the magnitude of the forces and the corre-sponding return period. A larger return period implies higher intensity in the force. In a recent work, De Biagi et al. (2016a) proposed a reliability-based design procedure for structures subjected to snow-avalanche hazards.
The magnitude–frequency relationship is at the basis of the probabilistic hazard analysis. In seismic analysis, the Gutenberg–Richter law expresses such relationship. Straub and Schubert (2008) proposed a probabilistic approach for rockfall risk assessment based on a frequency law, but did not investigate its nature. Lari et al. (2014) considered the an-nual frequency of occurrence of a rockfall volume as “given” data. The proposed approach intends to be the base for more complex and complete probabilistic hazard assessments.
In designs of engineering works that protect a village or a road from falling rocks (e.g. net fences or embankments), the size of the falling block used in the modelling is currently not linked to its probability of occurrence, i.e. the return pe-riod of a block with such volume. The most frequently
ap-plied approaches refer to an analysis of the blocks that had already collapsed, integrated with a survey of the slope. The size of the falling design block is chosen from among the al-ready collapsed blocks and the surveyed blocks of the slope.. Adapting the well-known procedures of modern design prac-tice requires that the sizes of the falling blocks have to be related to their probability of occurrence and vice versa.
Examples of volume–frequency laws are proposed in the literature. They are obtained from the analysis of a large number of rockfall events for which each observed event is dated and the volume is estimated. This allows a volume– frequency curve to be drawn, in which each point corre-sponds to an observation. In general, precise catalogues with a large number of events are rare because the road owners or the territorial administrations started the records of events, which have large return periods, only some tens of years ago. For common uses, e.g. design of protective devices or risk estimation, for which there are no long records of events nor detailed surveys on site, no operative procedures are consol-idated and the designer develops the project following his personal experience. In any case, the choice of the “charac-teristic block volume” (design volume) has to be done by the designer’s own engineering judgement. For this reason, it is affected by subjectivity.
With the aim of contributing to overcoming this design problem, this paper proposes a methodology for estimating the block volume–frequency relationship that can be used for deriving the size of the falling design block having a pre-scribed return period. The procedure, which is depre-scribed in detail in Sect. 3, is based on the data reported in rockfall in-ventories and on surveys at the foot of the slope, managed following a statistical procedure.
2 Power laws in rockfall analysis
Statistical analyses of historical data or experimental tests re-lated to a certain natural phenomenon give evidence that it is possible to deduce power laws that link the magnitude of the event to its frequency. These mathematical relationships can be used for predicting type, extent, return time and magni-tude of future events.
In the fifties, Gutenberg and Richter (1956) observed that there was a relationship between the cumulative number of earthquake events exceeding a given value of magnitude
N (m M) and the magnitude itself. They formulated the
following law:
logN (m M)=↵ M, (1)
where↵and are site-dependent constants. More recently, as for earthquakes, statistical analyses of historical data sets have been widely applied to derive the recurrence rate of events of a given magnitude for other natural phenomena such landslides, rockfalls, snow avalanches, etc.
(Dussauge-Peisser et al., 2002; De Biagi et al., 2012; Corominas et al., 2014).
The analysis of historical data, which are available in pub-lic archives or catalogues, is therefore extremely important for the study of natural phenomena. With particular refer-ence to landslides and rockfalls, this statistical approach has been recently studied and applied by several authors in many mountain sites. Research has mainly focused on the analysis of the volume distribution of rockfall events for the sites of Grenoble, Yosemite Valley, Arly gorges, British Columbia, Hong Kong, Italian Apennines, Aosta Valley, Christchurch-Canterbury and La Réunion Island (Dussauge-Peisser et al., 2002; Dussauge et al., 2003; Keith Turner and Schuster, 2012; Abbruzzese et al., 2009; Brunetti et al., 2009; De Biagi et al., 2016b; Guzzetti et al., 1994; Lari et al., 2014).
The comparison of the previous studies showed that neg-ative power laws fit all rockfall recurrence volume distribu-tions well. However, some variability in the values assigned to the power law coefficients does appear. This has been mainly attributed to the variability in the sampling proce-dures of the landslide volumes. At present, no proper test equipment (which provide, as for earthquakes, objective and reliable values that are comparable from one site to another) and standard procedures have been defined for the different geological and structural settings where rockfalls may occur (Brunetti et al., 2009).
Rockfall inventories do not always contain quantitative and detailed information, and the description of historical events is often characterized by a low degree of accuracy. For example, in the Yosemite rockfall inventory (Wieczorek and Snyder, 2004; Guzzetti et al., 2003), which can be con-sidered one of the largest detailed rockfall inventories, the exact locations of rockfalls, the detachment areas and the block volumes (or weights) are not always given. More of-ten, size and triggering information of the events is given in a qualitative and incomplete way; temporal information is not precise. Rockfalls that occurred within a few hours from the same source area are sometimes listed as the same event, overestimating their magnitude. In general, a lack of data on smaller rock blocks subsists while large and more damag-ing rockfalls were recorded regularly. Thus, it is clear that a certain degree of uncertainty and lack of homogeneity in the collected data exist.
Previous considerations, which have to be taken into ac-count in treating historical data, are related to Yosemite Val-ley but can be easily referred to almost all of the histori-cal archives (Corominas et al., 2014; Brunetti et al., 2009; Corominas et al., 2005).
In addition, the temporal length of the observations can affect the recurrence volumetric distribution. In particular, a few years time window underestimates larger collapses. Many authors examined the frequency–size distributions of both rockfalls and fallen blocks and noted that the cumulative frequency is linearly related to the magnitude (block volume or rockfall volume) on a log–log plot. In mathematical terms,
log
V
log
n
1
a
1
b
Figure 1.Sketch of an=aV bpower law relationship.
the following power law relationship subsists:
n (v V )=aV b, (2)
wheren (v V )is the frequency of blocks volume (or
rock-falls volume) with size larger thanV (generally, the size is
expressed in m3), whilea andbare constants:a relates to
the frequency of blocks volume (or rockfalls volume) larger than a unit volume (i.e. 1 m3) andbrepresents the slope of the
regression line or the fractal dimension (Turcotte, 1997), as sketched in Fig. 1. With reference to the example of Fig. 1, if the volumes are expressed in cubic metres, a is the
an-nual frequency of occurrence of a rockfall larger than 1 m3. In this case, supposingV =2.5 m3,n (v V )is the annual
frequency of volumes larger than 2.5 m3.
This formulation implies that (i) larger rockfall events are less frequent than those characterized by smaller size and (ii) frequency–size distributions are well fitted by a power law only over a given range of volumes. The power law ex-hibits a deviation from the observed distribution for volumes smaller than a certain value. This discrepancy has been dis-cussed in the literature. It can be the result of undersampling of the smallest rockfall events (Brunetti et al., 2009; Stark and Hovius, 2001). While collapses of considerable sizes are easily identifiable and are almost always recorded, collapses of very small sizes, mainly causing no damage, are unnoticed and, especially in the past, they have been rarely reported in the archives. In addition, the formulation implies that rock-falls on huge scales can be considered more reliable as the recording time increases.
Regarding power laws that are applied to rockfall vol-umes, the values of the parameters of Eq. (2) are variable. Dussauge-Peisser et al. (2002) analysed a range of volumes
spanning from 101 to 106m3 and suggested that b is not
dependent on the scale of study, slope lithology and frac-ture systems. Other authors propose different values of b,
depending on the degree of fracturing: the less the rock-mass fracturing, the smaller thebvalue. Various studies have
been performed for rockfalls less than 10 m3(Gardner, 1970; Hungr et al., 1999), also by means of topographical tech-niques down to 10 3m3(Rosser et al., 2005; Abellán et al.,
2010; Dewez et al., 2013). Dai and Lee (2001) studied 2811 landslides and rockfalls and Rousseau (1999) used seismic monitoring technique. On the contrary, coefficientaexhibits
relevant fluctuation from one site to another.
As mentioned, Eq. (2) can be related to the distribution of the volumes of the fallen blocks. The values of the parame-tersa andb are variable. Parameterbcould assume
differ-ent values in the range 0.5 to 1.3. Various examples can be found in the literature. Crosta et al. (2007) determined dif-ferent fractal dimensions in analysing grain size curves ob-tained from different spots of the deposits of a large rock avalanche that occurred in 1987 in the central Italian Alps. Ruiz-Carulla et al. (2015) carried out a detailed survey in order to highlight the differences in block distribution in var-ious portions of the deposit of a rockfall and found abvalue
ranging from 0.89 to 1.28. The same authors analysed the dependency between the free-fall height and the value ofb
for various well-documented rockfall events in Spain. They found thatbincreases as the falling height of the block
in-creases (Ruiz-Carulla et al., 2016). Observing the data re-ported in the previously mentioned paper, it emerges that the lithology of the rock mass affects the value of parame-terb. For similar free-fall heights,b=0.72 was computed
for rockfall in limestones andb=0.92 for rockfall in schists.
The larger theb value, the more comminuted the deposit.
Hantz et al. (2016) surveyed four limestone deposits in the area of Grenoble, France, and foundb values ranging from
0.63 to 1.12. Parametera exhibits relevant variability from
one site to another and it is essentially linked to the number of blocks counted on the deposit of the rockfall.
3 Proposed method
A three-step procedure for deriving a volume–frequency re-lationship for blocks with a reduced amount of available data is built up and discussed in the following. Some aspects of the proposed methodology result from hydrological approaches in flood-frequency analyses (see Claps and Laio, 2003). The main hypothesis of the procedure is that the temporal occur-rences (i.e. the events) are considered separately from the de-posit volumes distribution in a representative area where the rockfall occurs. A representative area is defined as the por-tion of deposit beyond a defined line, in which the hazard is computed. We consider the foot of the slope as a representa-tive area.
As described in detail in this section, the required data for deriving a volume–frequency relationship are as follows.
i. A catalogue of events, i.e. events with quantitative rock-fall volume estimates observed in the representative area, is denoted asC. Referring to such input, at present, no real-time automatic systems able to detect the occur-rence of a rockfall event are diffused. A few examples of monitoring through sensors able to detect microseis-mic activity are present in the literature. Unfortunately, the calibration of such systems is difficult and the results largely depends on the environmental noises. Other non-real-time methodologies exist. For example, if the phe-nomena occur in a forested area, the continuous growing of plants can give information about potential impacts (and tree damages) that occurred in the past (Dorren et al., 2007). Anyway, this method suffers many epis-temic uncertainties: the same rockfall event can dam-age more than one tree, or it is not possible to distin-guish between one or more events that occurred dur-ing the same plant-growdur-ing season (Moya et al., 2010). Alternatively, topographical approaches, e.g. laser scan-ning, are largely used to monitor rock faces (Abellán et al., 2010, 2011), but a lasting survey campaign is re-quired to get a robust catalogue of events. The direct observation is still the most common, being a simple and cheap solution for drawing up a catalogue of rock-fall events. Usually, the local government, road super-visors or forestry service agents are involved in the col-lection of data related to rockfall events, as reported by Dussauge-Peisser et al. (2002). Since direct observation is affected by errors, in the proposed procedure a thresh-old volume is considered, as described in the following. ii. A list of measured volumes that may have fallen down at any time is denoted as F. Referring to such input, different counting procedures have been developed. The simplest method consists of counting the fallen blocks and classifying them into volume classes. Different ap-proaches have been proposed, depending on the size of the rockfall. For example, Corominas et al. (2012) di-rectly counted (and classified) all the fallen blocks in small-scale rockfall events in Andorra. For larger phe-nomena, Ruiz-Carulla et al. (2015) proposed a method-ology for obtaining a rockfall block size distribution (RBSD) essentially based on block counting in small sampling plots and homogenization to the whole debris cover. More complex methods make use of topographic techniques (digital elevation models, orthophotos) to identify the existing discontinuity sets and to compute the volume of the unstable rock blocks on the slope face (Jaboyedoff et al., 2009; Mavrouli et al., 2015). In such cases, the time–magnitude relationship would refer to the release of blocks and fragmentation and comminu-tion should be considered in the propagacomminu-tion analysis. In order to avoid these problems, the authors suggest
considering a distribution of volumes obtained from sur-veys in the representative area.
Obviously, both the catalogue and the list must be related to the same area of the slope, i.e. its foot. All the blocks in catalogue C are elements of list F. In addition, list F
also contains fallen blocks that have not been observed or recorded. Because of that, its cardinality, i.e. the number of elements, is larger than the one ofC.
The first step of the analysis consists of choosing “rele-vant” events within catalogueC. To this aim, a threshold vol-umeVtis identified (details on the choice ofVtare provided
in Sect. 3.1) and the elements of catalogueC are split into two sets. The events corresponding to a volume equal to or larger than the threshold volumeVtare included in a reduced
catalogueC⇤mathematically described as
C⇤= {e:e2C^V (e) Vt}, (3)
whereV (e)is the volume associated to falling evente. The
events not satisfying this condition were discarded, thus not considered in the analysis. ListFis treated in the same way: a listF⇤including all the volumes equal or larger than the threshold volumeVtis set up:
F⇤= {s:s2F^V (s) Vt}, (4)
whereV (s)is the volume associated to thesth record of the
survey at the foot of the slope (in the representative area). As before, the surveyed volumes smaller thanVtare not further
considered in the analysis.
The second step of the analysis consists of the choice of two probabilistic models. One should be able to describe the temporal occurrences of the events of catalogueC⇤, the other should describe the distribution of the surveyed volumes in listF⇤. It is assumed that the observed events are
indepen-dent if the threshold value, Vt, is sufficiently high. Thus,
the temporal occurrences can be described with a rare-event probabilistic law, i.e. a Poisson distribution. The block sizes at the foot of the slope follow a power law, as previously de-tailed. A generalized Pareto distribution (GPD) is adopted to describe the sizes of the surveyed blocks in listF⇤. The GPD has two degrees of freedom and represents a good compro-mise between the quality of the fitting (which, in general, increases as much as the number of degrees of freedom in-creases) and the robustness of the model (which depends on the number of observations). GPD is chosen since it well fits the records of listF⇤, being a power-like distribution, but other probabilistic distributions can be adopted and the proposed procedure easily adapted (Burnham and Anderson, 2003).
Knowing the annual mean number of blocks bigger thanVt
(i.e. ) and the cumulative distribution function of the block volumeFV(v), the temporal frequency (the inverse of the
return periodT) of blocks bigger thanvis
[1 FV(v)]= 1
Inversely, the volume with return periodT,vT is vT =FV1 ✓ 1 1 T ◆ , (6)
whereFV1(·)is the inverse of the cumulative density
func-tion of the probabilistic distribufunc-tion describing the size of the surveyed blocks, i.e. GPD, is the annual mean number of events.
The third step of the analysis consists of the estimation of the parameters of the statistical laws by means of the mea-sured rockfall data contained inC⇤andF. The former gives the parameter temporal frequency, and the latter the parame-ters of the GPD.
3.1 Definition of the threshold volume
The catalogue of the eventCcontains all the recorded events gathered in a time window, i.e. from the beginning to the end of the observation period. For sake of simplicity we con-sider that the end of catalogueCcoincides with the present time. The catalogue has a temporal length ⌧(C)=t and is
composed by events related to both small and large rockfall phenomena.
Since the recording of the events is related to in situ ob-servations after the occurrence, events involving small rock blocks are not always recorded. Therefore, there is the pos-sibility that catalogue Ccontains only a part of these small events. This fact was considered in the proposed analysis with the introduction of a threshold volume, Vt, defined as
the minimum size of a fallen block that has always been ob-served and recorded (after its occurrence). This means that the threshold volume is not necessarily the smallest volume in the catalogue of the eventsC. This concept is similar to the so-called perception threshold in flood-frequency analy-sis (Claps and Laio, 2003).
A reduced catalogue, which is mathematically described by Eq. (3), is created. The cardinality ofC⇤, i.e.|C⇤|, is equal
to n⇤ and, as already specified, the events are considered
independent. The value of the threshold volume influences the temporal length of C⇤. Since the decision to monitor a rockfall-prone slope usually begins after the occurrence of an event larger than the threshold volume, it is possible to consider that, in a previous time interval of about half the re-turn period of the events of the reduced catalogue, i.et /n⇤,
no events were recorded. This means that the temporal length of the reduced catalogue is
t⇤=⌧(C⇤)=t+ t
2n⇤. (7)
If n⇤ is large enough, the term t /n⇤ is a good estimate of
the return period of the events of the reduced catalogue. In the casen⇤=1, the return period may be strongly
underesti-mated if the observation period is short.
Figure 2.Sketch of the catalogues of eventsCandC⇤. The events with volumeV (e)larger than the threshold volumeVtare indicated
with blue bullets, those smaller than the threshold volumeVt are
indicated with black bullets.
3.2 Probabilistic model describing the temporal occurrence of the events inC⇤
Under the hypothesis of independence between the observa-tions, the rockfall phenomenon is considered to be a com-pletely random process for which any realization consists of a set of isolated stochastically independent points in time (McClung, 1999). In statistics, such a process is known as a Poisson point process. Therefore the events of the reduced catalogueC⇤within the temporal ranget⇤are considered to
be a realization of a Poisson point process. The mathemat-ical relationship between the probability of occurrence of
nevents during the observation periodt⇤, i.e. the probability
mass function, is
p (n)=e
t⇤( t⇤)n
n! , (8)
where >0 is the so-called parameter of the Poisson
tribution. The hypothesis of independent and Poisson dis-tributed rockfall events is essential to relate the cumulative density function of the sizes of the surveyed blocks,FV(v),
to that of the annual maxima,GV(v), by means of
GV(v)=e [1 FV(v)]. (9)
GV(v)represented the annual probability of occurrence of a
block of volume smaller thanv.
3.3 Probabilistic model describing the record distribution inF⇤
The probabilistic model of the volume distribution at the foot of the slope is determined using the records contained in list
F⇤. As discussed, only blocks larger than the threshold
vol-ume,Vt, are considered. The generalized Pareto distribution
equal to FV(v)=1 ✓ 1+⇠v µ ◆ 1/⇠ , (10)
where ,⇠ andµare scale, shape and location parameters,
respectively. The scale parameter is always positive and the distribution has supportv µfor⇠ 0 orµvµ /⇠ for ⇠<0. The location parameter bounds the distribution.
Since the volumes smaller than Vt are not considered, the
location parameter is equal to threshold volume, i.e.µ=Vt.
The inverse of Eq. (10), to be used in Eq. (6), is equal to
v(FV)=FV1(FV)=µ+
⇥
(1 FV) ⇠ 1
⇤
⇠. (11) In the present framework, substituting FV =1 1T, the
volume,v(T ), corresponding to a return periodT years is v(T )=µ+⇥( T )⇠ 1⇤
⇠, (12)
and the return period,T (v), corresponding to a volumevis T (v)=1
✓
1+⇠v µ
◆1/⇠
. (13)
As a consequence, the annual frequency of occurrence, which is the reciprocal of the return period, is
1 T = ✓ 1+⇠v µ ◆ 1/⇠ . (14)
3.4 Evaluation of the parameters of the distributions
An estimate of the parameter of the Poisson distribution was obtained through the maximum likelihood method. The maximum likelihood estimate is an unbiased estimator of and was determined as
=n⇤
t⇤, (15)
i.e. as the ratio between the cardinality and the length of the time window of catalogueC⇤.
The estimates of the scale and shape parameters,⇠ and , are determined through a maximum likelihood scheme af-ter imposing that the location parameaf-ter, µ, is equal to the
threshold volume.
4 Examples
With the aim of better explaining the proposed methodol-ogy, it was applied to two areas affected by rockfalls. Both Buisson and Becco dell’Aquila are located in Aosta Valley, north-western Italian Alps, as shown in Fig. 3.
Figure 3.Map of the two test site locations in the north-western Italian Alps. The Buisson site is shown with a red bullet in(a), the Becco dell’Aquila site is shown with a red bullet in(b).
4.1 Buisson site
The Buisson site (UTM: 392267, 5077165, 32,T) is located
on the left bank of the Marmore torrent in the municipality of Antey-Saint-André in Valtournenche at an altitude ranging from 1130 m to 1612 m a.s.l. The source area is composed of gneiss, which are fine- to medium-grained rocks with the dominant foliation plane orientation at 195/35.
Discontinu-ity sets are observed along 270/85 and 320/80 planes, the
latter being the orientation of the slope face. The study slope is mainly composed of debris which extend down the slope to the alluvial plain and are covered by irregular (from scanty to very dense) vegetation. The site is close to a camping area, for which protection measures and thus records of rockfall events have been taken since 1994, when a large block (3 m3) hit a part of the area.
A detailed survey in the deposition area was performed: 60 blocks with volume ranging from 0.02 to 308 m3were
ob-served and their position recorded through GPS. These data constitute listF (Table 1). The analysis of the occurrences was done after the historical catalogue of the Regional Ge-ological Service of Aosta Valley that reports five events at the site from 1994 (September 1994, March 1995, Septem-ber 1996, April 1998, OctoSeptem-ber 2002). Because of the contin-uous monitoring after the construction of the camping site, all the events after 1994 were recorded and thus considered in catalogueCand the reduced catalogueC⇤, which are coin-cident. The threshold volumeVtwas set equal to 0.5 m3, i.e.
the minimum size of the observed events inC. The number of events considered in the analysis is equal ton⇤=n=5. The
corrected timet⇤is computed through Eq. (7) and is equal to
25.3 years. Eq. (15) gives =0.1976.
The reduced list,F⇤, was determined after the definition of
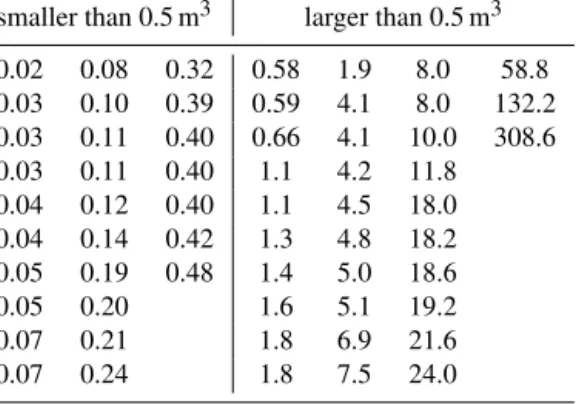
Table 1.Volumes of the surveyed blocks in the deposition area of the Buisson site. The blocks are divided into two classes, depending on their size (smaller or larger thanVt). All the blocks belong to list F; blocks larger thanVtbelong to the reduced listF⇤.
smaller than 0.5 m3 larger than 0.5 m3 0.02 0.08 0.32 0.58 1.9 8.0 58.8 0.03 0.10 0.39 0.59 4.1 8.0 132.2 0.03 0.11 0.40 0.66 4.1 10.0 308.6 0.03 0.11 0.40 1.1 4.2 11.8 0.04 0.12 0.40 1.1 4.5 18.0 0.04 0.14 0.42 1.3 4.8 18.2 0.05 0.19 0.48 1.4 5.0 18.6 0.05 0.20 1.6 5.1 19.2 0.07 0.21 1.8 6.9 21.6 0.07 0.24 1.8 7.5 24.0
Table 2.Input and results of the analyses performed at the Buisson site. The estimates of the parameters of the distribution are reported in the bottom rows.
Obs. 1994–2016 t 23 yr Vt 0.5 m3 n 5 n⇤ 5 t⇤ 25.30 yr 0.1976 ⇠ 0.994 4.418 µ 0.5
The volumes of the reduced list served the evaluation of the parameters of the GPD, the estimates of which are reported in the bottom part of Table 2.
Figure 4 plots the volume–annual frequency of occurrence relationship given in Eq. (14). Even if the theory allows all the possible sizes bigger than Vt to be defined, an upper
threshold value can be introduced by taking into account the geostructural survey of the rock slope, which can give evi-dence of the maximum block size.
4.2 Becco dell’Aquila site
Becco dell’Aquila site (UTM: 341345, 5074157, 32, T) is
located on the eastern side of Mont Chétif (2343 m a.s.l.) in the municipality of Courmayeur at an altitude ranging from 1230 m to 1800 m a.s.l. The study area is largely composed of Mont Chétif gneisses, which are fine- to medium-grained rocks, with the foliation plane N 140/50. The site is close to a deposit of aggregates used for concrete production onto which a 20 m3 block fell on 5 May 2012. Despite a large
rockfall event being recorded in 1903, systematic observa-tions and monitoring activities on the site started in 1998.
Volume (m3)
10-1 100 101 102 103
Annual frequency of occurrence (yr
-1) 1/1000 1/100 1/10 1 Estimated
Figure 4.Volume–annual frequency of occurrence plot related to Buisson site.
An on-site survey was performed in the framework of a risk analysis for the activities at the foot of the slope. The block volumes were estimated by rough measurements and through the experience of a geologist. Blocks are grouped into size classes in a geometric progression following 21/2with
vol-ume, as reported in Table 3.
The historical catalogue of the Regional Geological Ser-vice of Aosta Valley reports three events in this site since 1998 (April 1998, April 2001, May 2012). The size of the fallen blocks is always larger than 5 m3. Considering that the
slope is constantly monitored, it is evident that any event big-ger than 5 m3can be immediately observed and recorded. For
this reason a threshold volumeVt=5 m3was adopted.
Cat-alogueC and the reduced catalogue C⇤ are coincident; see Table 4 for details.
The number of events considered in the analysis is equal ton⇤=n=3. The corrected timet⇤ is computed through
Eq. (7) and is equal to 22.17 years. Eq. (15) gives =0.1353.
Referring to the distribution of the volumes, the reduced list,F⇤, was determined after the definition of the threshold volume (Table 3). The neglected data, i.e. belonging to vol-ume classes smaller than 5 m3, are in italic in Table 3. The
estimates of the GPD are reported in Table 4.
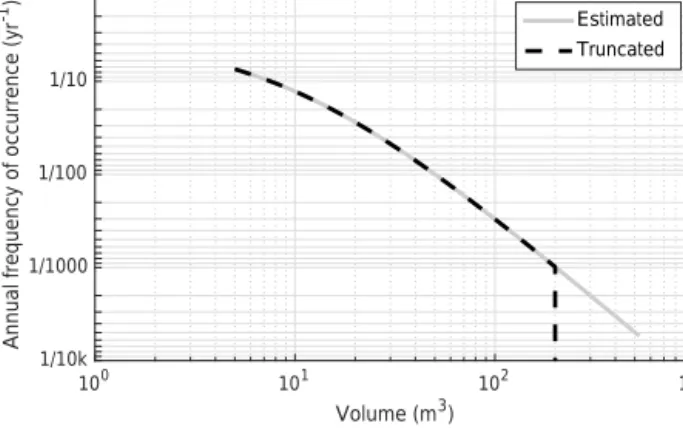
Based on the previously discussed data it was possible to obtain the volume–annual frequency of occurrence that is re-ported in Fig. 5 (grey line). A detailed survey of the poten-tial instabilities in the source area showed that the maximum size of the detachable block is about 200 m3. Similarly, an
additional truncated volume–annual frequency of occurrence relationship is plotted (dashed black line).
5 Discussions and conclusions
The definition of the relationship between the volumes that can stop on a slope and their return period is a parameter of paramount importance for a correct design procedure. The proposed methodology allows a volume–frequency law to be
Table 3.List of the grouped volumes of the surveyed blocks on the slope of Becco dell’Aquila site. All the blocks belong to listF; the blocks that are larger thanVt, in normal font, belong to the reduced
listF⇤. The blocks in italic are those that are not part of the reduced listF⇤.
Volume No. Volume No.
(m3) records (m3) records 1.000 10 16.000 6 1.414 0 22.627 5 2.000 8 32.000 2 2.828 0 45.255 3 4.000 3 64.000 0 5.657 0 90.510 1 8.000 26 128.000 1 11.314 4 181.019 1
Table 4.Input and results of the analyses performed on the Becco dell’Aquila site. The estimates of the parameters of the distribution are reported in the bottom rows (the standard deviations are detailed into brackets). Obs. 1998–2016 t 19 yr Vt 5 m3 n 3 n⇤ 3 t⇤ 22.17 yr 0.1353 ⇠ 0.5509 7.7836 µ 5.0
computed, which can be used in engineering calculations. Two different probabilistic models are considered: one for the Poisson’s point process related to the occurrences of the events, the other for the fallen-block volume distributions (the GPD, which is independent of the year of rockfall occur-rence). In order to make these considerations and use these probabilistic models, hypotheses are necessary.
The two probabilistic models are merged considering the hypothesis that the annual frequency of a rock block having a volume equal to the threshold volume is the parameter of the Poisson distribution.
The events described by Poisson’s probabilistic models need to be independent. In other words, no causality links have to subsist. Under this hypothesis, the process is ran-dom (Moller and Waagepetersen, 2003). In the framework of rockfalls, the validity of the hypothesis was discussed by McClung (1999), who stated that the interaction between a natural hazard and anthropic elements (e.g. vehicles, build-ings) is a rare event that can be ascribed to a Poisson process.
Volume (m3)
100 101 102 103
Annual frequency of occurrence (yr
-1) 1/10k 1/1000 1/100 1/10 1 Estimated Truncated
Figure 5.Volume–annual frequency of occurrence plot related to Becco dell’Aquila site.
Similarly, Lari et al. (2014) and Hantz and colleagues (Hantz et al., 2003; Hantz, 2011) invoke the same assumption.
The GPD has been chosen for fitting the values of listF
for various reasons.
– Pareto family distributions are very similar to power law distributions except for the fact that the former are bounded distributions. The bound is represented by the location parameterµin Eq. (9).
– GPD differs from the classical Pareto model for the in-troduction of a location parameter, which does not affect the slope of the right part of the plot, being governed by the exponent ⇠ 1.
– GPD is suitable for extreme value analysis. Pickands (1975) introduced it in the extreme value framework, as the distribution of a sample of exceedances above a certain high threshold.
In rockfall studies, the main distinction between GPD and power law can be observed when the value of the volume tends to zero. GPD is finite forv!0, while power law
di-verges to1, as required by scale invariance (Turcotte, 1997). That is, for the calculations proposed in the present paper, GPD and power law have the same right tail (linear in a log– log plot), while for small volumes, the former is able to catch the fact that, although the volumes are close to the threshold value,Vt, a finite number of blocks is counted in the
repre-sentative area.
The degree of precision of the estimates of the parameters of a generalized Pareto distribution is determined through a bootstrap analysis (Efron and Tibshirani, 1994; Bengoubou-Valerius and Gibert, 2013). This analysis allows us to deter-mine the variance and the confidence bounds of the param-eters of the GPD that fit each reduced listF⇤ of the
previ-ously considered rockfall sites. A 100 000 bootstrap replica-tions are made for each reduced list. For each replication, a bootstrap sample, i.e. a resampling of the reduced list, is
gen-Table 5.Bootstrap statistical parameters of the estimates of the parameters of the generalized Pareto distribution related to the two example sites.
Buisson Becco dell’Aquila
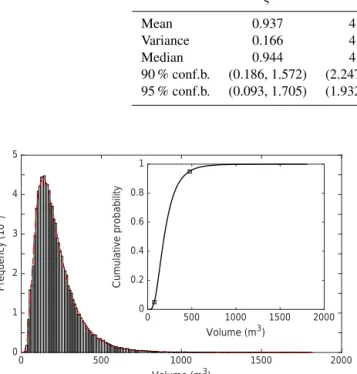
⇠ ⇠ Mean 0.937 4.919 0.511 8.104 Variance 0.166 4.511 0.032 2.226 Median 0.944 4.610 0.520 7.897 90 % conf.b. (0.186, 1.572) (2.247, 8.481) (0.196, 0.783) (6.088, 10.871) 95 % conf.b. (0.093, 1.705) (1.932, 9.563) (0.103, 0.831) (5.821, 11.587) Volume (m3) 0 500 1000 1500 2000 Frequency (10 3) 0 1 2 3 4 5 Volume (m3) 0 500 1000 1500 2000 Cumulative probability 0 0.2 0.4 0.6 0.8 1
Figure 6.Histogram of the volumes having 1000 years return pe-riod fitted by a log-normal law (red dashed line). The empirical dis-tribution function is plotted in the box: the squares bound the 90 % confidence interval.
erated and an estimate of the parameters⇠ and of the fitting generalized Pareto distribution is made.
From the set of the estimates of the parameters, the boot-strap mean, variance and median and the values of 90 and 95 % confidence bounds are determined (Table 5). Note that the estimates of the parameters reported in Tables 2 and 4 are close to bootstrap medians.
In addition, for each bootstrap replication, once parame-ters⇠ and are estimated, the volumes related to different (25 in total) return periods between 10 and 1000 years are computed through Eq. (12). As an example, the histogram of Fig. 6 shows the frequency of the 1000-year return pe-riod volumes obtained at Becco dell’Aquila: they are well fit by a log-normal law (red dashed line). The empirical distri-bution function is plotted in the box of Fig. 6. The values corresponding to cumulative probabilities of 0.05 and 0.95 are identified with squares. These corresponds to the bounds of the 90 % confidence interval: in other words, this means that 90 % of the volumes are larger than 73.8 m3and smaller
than 473.2 m3. Similarly, the bounds are determined on both
sites for all the return periods considered in the range 10– 1000 years. They are shown with dashes in Fig. 7.
Volume (m3)
100 101 102 103
Annual frequency of occurrence (yr
-1) 10-3 10-2 10-1 100 Volume (m3) 100 101 102 103
Annual frequency of occurrence (yr
-1)
10-3 10-2 10-1 100
Buisson Becco dell'Aquila
(a) (b)
Figure 7.Results of the bootstrap analysis on the records on Buis-son and Becco dell’Aquila sites. The continuous lines are plotted from Eq. (14) with the parameters reported in Tables 2 and 4. The dashed lines are the bounds of the 90 % confidence intervals. In or-der to easily compare the two, the bounds of the axes are kept equal on the two plots.
It results that the width of the 90 % confidence interval increases as much as the return period increases. This implies a spread of the value of the volumes of the blocks. Detailed and long records of the events as well as a proper survey of the volumes of the blocks would permit an increase in the quality of the volume–frequency law and, as a consequence, reduce the statistical errors in the procedure.
The proposed method allows the relationship between the return period and the volume of the blocks to be defined. This is a key aspect in land management and planning, design of protection devices (Peila et al., 1998, 2007; Keith Turner and Schuster, 2012; Mignelli et al., 2012, 2013; Dimasi et al., 2015) and for modern design approaches based on return pe-riods of natural hazards (De Biagi et al., 2015, 2016a) and structural robustness (Cennamo et al., 2015; De Biagi and Chiaia, 2013; De Biagi, 2016). The bootstrap analysis has shown that the quality of the input data can affect the results particularly when long return periods are considered. Hence, in these cases, a critical analysis of the estimated volumes is required in the design process.
6 Data availability
The historical data can be accessed at http://catastodissesti. partout.it.
Competing interests. The authors declare that they have no conflict of interest.
Acknowledgements. The authors acknowledge the two anonymous referees for their observations and comments of the manuscript. F. Laio is particularly acknowledged for having generously shared his experience and for his valuable comments. This research was supported by Regione Autonoma Valle d’Aosta under the framework of the project “Realizzazione di scenari di rischio per crolli di roccia”.
Edited by: T. Glade
Reviewed by: two anonymous referees
References
Abbruzzese, J. M., Sauthier, C., and Labiouse, V.: Considerations on Swiss methodologies for rock fall hazard mapping based on trajectory modelling, Nat. Hazards Earth Syst. Sci., 9, 1095– 1109, doi:10.5194/nhess-9-1095-2009, 2009.
Abellán, A., Calvet, J., Vilaplana, J., and Blanchard, J.: Detection and spatial prediction of rockfalls by means of terrestrial laser scanner monitoring, Geomorphology, 119, 162–171, 2010. Abellán, A., Vilaplana, J. M., Calvet, J., García-Sellés, D., and
Asensio, E.: Rockfall monitoring by Terrestrial Laser Scanning – case study of the basaltic rock face at Castellfollit de la Roca (Catalonia, Spain), Nat. Hazards Earth Syst. Sci., 11, 829–841, doi:10.5194/nhess-11-829-2011, 2011.
Bengoubou-Valerius, M. and Gibert, D.: Bootstrap determination of the reliability ofb-values: an assessment of statistical
estima-tors with synthetic magnitude series, Nat. Hazards, 65, 443–459, 2013.
Brunetti, M. T., Guzzetti, F., and Rossi, M.: Probability distributions of landslide volumes, Nonlin. Processes Geophys., 16, 179–188, doi:10.5194/npg-16-179-2009, 2009.
Burnham, K. P. and Anderson, D. R.: Model selection and mul-timodel inference: a practical information-theoretic approach, Springer Science & Business Media, 2003.
Cennamo, C., Chiaia, B., De Biagi, V., and Placidi, L.: Monitor-ing and compartmentalized structures, ZAMM-Z. Angew. Math. Me., 95, 638–648, 2015.
Claps, P. and Laio, F.: Can continuous streamflow data sup-port flood frequency analysis? An alternative to the par-tial duration series approach, Water Resour. Res., 39, 1216, doi:10.1029/2002WR001868, 2003.
Corominas, J., Copons, R., Moya, J., Vilaplana, J., Altimir, J., and Amigó, J.: Quantitative assessment of the residual risk in a rock-fall protected area, Landslides, 2, 343–357, 2005.
Corominas, J., Mavrouli, O., Santana, D., and Moya, J.: Simplified approach for obtaining the block volume distribution of fragmen-tal rockfalls, Landslides and engineered slopes, Taylor and Fran-cis, 2, 1159–1164, 2012.
Corominas, J., Van Westen, C., Frattini, P., Cascini, L., Malet, J.-P., Fotopoulou, S., Catani, F., Van Den Eeckhaut, M., Mavrouli, O., Agliardi, F., Pitilakis, K., Winter, M. G., Pastor, M., Ferlisi, S., Tofani, V., Hervás, J., and Smith, J. T.: Recommendations for the
quantitative analysis of landslide risk, B. Eng. Geol. Environ., 73, 209–263, 2014.
Crosta, G., Frattini, P., and Fusi, N.: Fragmentation in the Val Pola rock avalanche, Italian Alps, J. Geophys. Res.-Earth, 112, F01006, doi:10.1029/2005JF000455, 2007.
Dai, F. and Lee, C.: Frequency–volume relation and prediction of rainfall-induced landslides, Eng. Geol., 59, 253–266, 2001. De Biagi, V.: Structural behavior of a metallic truss under
progres-sive damage, Int. J. Solids Struct., 82, 56–64, 2016.
De Biagi, V. and Chiaia, B.: Complexity and robustness of frame structures, Int. J. Solids and Struct., 50, 3723–3741, 2013. De Biagi, V., Chiaia, B., and Frigo, B.: Fractal grain distribution in
snow avalanche deposits, J. Glaciol., 58, 340–346, 2012. De Biagi, V., Chiaia, B., and Frigo, B.: Impact of snow avalanche on
buildings: Forces estimation from structural back-analyses, Eng. Struct., 92, 15–28, 2015.
De Biagi, V., Barbero, M., and Borri-Brunetto, M.: A reliability-based method for taking into account snowfall return period in the design of buildings in avalanche-prone areas, Nat. Hazards, 81, 1901–1912, 2016a.
De Biagi, V., Botto, A., Napoli, M., Dimasi, C., Laio, F., Peila, D., and Barbero, M.: Calcolo del tempo di ritorno dei crolli in roccia in funzione della volumetria, GEAM Geoingegneria Ambientale e Mineraria, LIII, 39–48, 2016b.
Dewez, T., Rohmer, J., Regard, V., and Cnudde, C.: Probabilistic coastal cliff collapse hazard from repeated terrestrial laser sur-veys: case study from Mesnil Val (Normandy, northern France), J. Coastal Res., 65, 702–707, 2013.
Dimasi, C., Luciani, A., Martinelli, D., Paganone, M., and Peila, D.: Controllo delle barriere paramassi a rete per la loro gestione e manutenzione, GEAM. GEOINGEGNERIA AMBIENTALE E MINERARIA, 146, 65–73, 2015.
Dorren, L., Berger, F., Jonsson, M., Krautblatter, M., Mölk, M., Stoffel, M., and Wehrli, A.: State of the art in rockfall-forest in-teractions, Schweizerische Zeitschrift fur Forstwesen, 158, 128– 141, 2007.
Dussauge, C., Grasso, J.-R., and Helmstetter, A.: Statistical analysis of rockfall volume distributions: Implications for rockfall dynamics, J. Geophys. Res.-Sol. Ea., 108, 2286, doi:10.1029/2001JB000650 , 2003.
Dussauge-Peisser, C., Helmstetter, A., Grasso, J.-R., Hantz, D., Desvarreux, P., Jeannin, M., and Giraud, A.: Probabilistic ap-proach to rock fall hazard assessment: potential of histori-cal data analysis, Nat. Hazards Earth Syst. Sci., 2, 15–26, doi:10.5194/nhess-2-15-2002, 2002.
Efron, B. and Tibshirani, R.: An introduction to the bootstrap, CRC press, 1994.
Elishakoff, I.: Probabilistic Theory of Structures, Courier Dover Publications, 1999.
Gardner, J.: Rockfall: a geomorphic process in high mountain ter-rain, Albertan Geographer, 6, 15–20, 1970.
Gutenberg, B. and Richter, C. F.: Earthquake magnitude, intensity, energy, and acceleration (second paper), B. Seismol. Soc. Am., 46, 105–145, 1956.
Guzzetti, F., Cardinali, M., and Reichenbach, P.: The AVI Project: A bibliographical and archive inventory of landslides and floods in Italy, Environ. Manage., 18, 623–633, 1994.
Guzzetti, F., Reichenbach, P., and Wieczorek, G. F.: Rockfall haz-ard and risk assessment in the Yosemite Valley, California, USA,
Nat. Hazards Earth Syst. Sci., 3, 491–503, doi:10.5194/nhess-3-491-2003, 2003.
Hantz, D.: Quantitative assessment of diffuse rock fall hazard along a cliff foot, Nat. Hazards Earth Syst. Sci., 11, 1303–1309, doi:10.5194/nhess-11-1303-2011, 2011.
Hantz, D., Vengeon, J. M., and Dussauge-Peisser, C.: An his-torical, geomechanical and probabilistic approach to rock-fall hazard assessment, Nat. Hazards Earth Syst. Sci., 3, 693–701, doi:10.5194/nhess-3-693-2003, 2003.
Hantz, D., Ventroux, Q., Rossetti, J., and Berger, F.: A new ap-proach of diffuse rockfall hazard, in: Landslides and Engineered Slopes. Experience, Theory and Practice: Proceedings of the 12th International Symposium on Landslides, edited by: Aversa, S., Cascini, L., Picarelli, L., and Scavia, C., vol. 2, 1063–1068, 2016. Hungr, O., Evans, S., and Hazzard, J.: Magnitude and frequency of rock falls and rock slides along the main transportation corridors of southwestern British Columbia, Can. Geotech. J., 36, 224– 238, 1999.
ISO: General Principles on reliability for structures ISO 2394:1998, International Organization for Standardization, 1998.
Jaboyedoff, M., Couture, R., and Locat, P.: Structural analysis of Turtle Mountain (Alberta) using digital elevation model: toward a progressive failure, Geomorphology, 103, 5–16, 2009. Keith Turner, A. and Schuster, R. L.: Rockfall: characterization and
control, Transport Research Board of the National academies, 2012.
Lari, S., Frattini, P., and Crosta, G.: A probabilistic approach for landslide hazard analysis, Eng. Geol., 182, 3–14, 2014. Leporati, E.: The Assessment of Structural Safety, Research
Stud-ies, USA, 1979.
Madsen, H., Krenk, S., and Lind, N.: Methods of structural safety, Courier Dover Publications, 2006.
Mavrouli, O., Corominas, J., and Jaboyedoff, M.: Size Distribution for Potentially Unstable Rock Masses and In Situ Rock Blocks Using LIDAR-Generated Digital Elevation Models, Rock Me-chanics and Rock Engineering, 48, 1589–1604, 2015.
McClung, D.: The encounter probability for mountain slope haz-ards, Can. Geotech. J., 36, 1195–1196, 1999.
Melchers, R.: Structural Reliability Analysis and Prediction, Wiley, 1999.
Mignelli, C., Lo Russo, S., and Peila, D.: ROckfall risk MAn-agement assessment: the RO. MA. approach, Nat. Hazards, 62, 1109–1123, 2012.
Mignelli, C., Pomarico, S., and Peila, D.: Use of Multi-Criteria Model to Compare Devices for the Protection of Roads against Rockfall, Environ. Eng. Geosci., 19, 289–302, 2013.
Moller, J. and Waagepetersen, R.: Statistical inference and simula-tion for spatial point processes, CRC Press, 2003.
Moya, J., Corominas, J., and Arcas, J.: Assessment of the rockfall frequency for hazard analysis at Solà d’Andorra (Eastern Pyre-nees), in: Tree Rings and Natural Hazards, Springer, 161–175, 2010.
Peila, D. and Ronco, C.: Technical Note: Design of rockfall net fences and the new ETAG 027 European guideline, Nat. Hazards Earth Syst. Sci., 9, 1291–1298, doi:10.5194/nhess-9-1291-2009, 2009.
Peila, D., Pelizza, S., and Sassudelli, F.: Evaluation of behaviour of rockfall restraining nets by full scale tests, Rock Mech. Rock Eng., 31, 1–24, 1998.
Peila, D., Oggeri, C., and Baratono, P.: Barriere paramassi a rete, Interventi e dimensionamento, Quaderni, GEAM, 2006. Peila, D., Oggeri, C., and Castiglia, C.: Ground reinforced
embank-ments for rockfall protection: design and evaluation of full scale tests, Landslides, 4, 255–265, 2007.
Pickands, J.: Statistical inference using extreme order statistics, the Annals of Statistics, 119–131, 1975.
Rosser, N., Petley, D., Lim, M., Dunning, S., and Allison, R.: Ter-restrial laser scanning for monitoring the process of hard rock coastal cliff erosion, Q. J. Eng. Geol. Hydroge., 38, 363–375, 2005.
Rousseau, N.: Study of seismic signals associated with rockfalls at 2 sites on the Reunion island (Mahavel Cascade and Souffriere cavity), PhD thesis, IPG, Paris, 1999.
Ruiz-Carulla, R., Corominas, J., and Mavrouli, O.: A methodology to obtain the block size distribution of fragmental rockfall de-posits, Landslides, 12, 815–825, 2015.
Ruiz-Carulla, R., Corominas, J., and Mavrouli, O.: Comparison of block size distributions in rockfall, in: Landslides and En-gineered Slopes, Experience, Theory and Practice: Proceedings of the 12th International Symposium on Landslides, edited by: Aversa, S., Cascini, L., Picarelli, L., and Scavia, C., vol. 3, 1767– 1774, 2016.
Stark, C. and Hovius, N.: The characterization of landslide size dis-tributions, Geophys. Res. Lett., 28, 1091–1094, 2001.
Straub, D. and Schubert, M.: Modeling and managing uncertainties in rock-fall hazards, Georisk, 2, 1–15, 2008.
Turcotte, D.: Fractals and chaos in geology and geophysics, Cam-bridge University Press, 1997.
Wieczorek, G. and Snyder, J.: Historical rock falls in Yosemite Na-tional Park, California, US Geological Survey, 2004.