Citation: Yarovaya, Larisa (2016) Return and Volatility Transmission in Emerging and Developed Stock Markets. Doctoral thesis, Northumbria University.
This version was downloaded from Northumbria Research Link: http://nrl.northumbria.ac.uk/30223/
Northumbria University has developed Northumbria Research Link (NRL) to enable users to access the University’s research output. Copyright © and moral rights for items on NRL are
retained by the individual author(s) and/or other copyright owners. Single copies of full items can be reproduced, displayed or performed, and given to third parties in any format or medium for personal research or study, educational, or not-for-profit purposes without prior permission or charge, provided the authors, title and full bibliographic details are given, as well as a hyperlink and/or URL to the original metadata page. The content must not be changed in any way. Full items must not be sold commercially in any format or medium without formal permission of the copyright holder. The full policy is available online:
Return and Volatility Transmission in
Emerging and Developed Stock Markets
L YAROVAYA
PhD
2016
Return and Volatility Transmission in
Emerging and Developed Stock Markets
LARISA YAROVAYA
A thesis submitted in partial fulfilment of the
requirements of the University of
Northumbria at Newcastle for the degree of
Doctor of Philosophy
Research undertaken in Newcastle Business
School
ABSTRACT
This dissertation provides empirical evidence on the patterns of intra- and inter-regional transmission of information across 10 developed and 11 emerging markets in Asia, the Americas, Europe and Africa using both stock indices and stock index futures. First, the main channels of contagion are examined in the period from 2005 to 2014 through the analysis of return and volatility spillovers around the most recent crises based on the generalized vector autoregressive framework. The findings demonstrate that markets are more susceptible to domestic and region-specific volatility shocks than to inter-regional contagion. Second, the inter-regional spillovers across markets with non-overlapping trading hours are investigated using asymmetric causality test. The results demonstrate that the signal receiving markets are sensitive to both negative and positive volatility shocks, which reveals the asymmetric nature of volatility transmission channels. Third, this study explores the ability of foreign information to forecast returns on domestic market. The results have implications for international portfolio diversification. The spillovers between emerging and developed markets are weaker than between developed markets, consequently the benefits of international portfolio diversification are best achievable by investing in emerging markets in different geographical zones. The burst in spillovers during crisis episodes is verified, which is important for investors as during periods of turmoil diversification benefits are limited. A novel results reported in the study is a difference in patterns of international transmission between models employing indices and futures data. The study shows that futures data provide more efficient channels of information transmission, because the magnitude of return and volatility spillovers across futures is larger than across indices. The results presented in this dissertation suggest that the analysis of spillovers across stock index futures has important practical implications for the development of trading strategies. The findings are relevant to practitioners and policy makers to enhance their understanding of financial markets interconnectedness.
Content
List of Tables ... VI List of Figures ... VIII List of Acronyms ...IX Acknowledgements ...XII Declaration ...XIII
Chapter 1 Introduction to the thesis ... 1
1.1 Introduction ... 1
1.2 Research background and motivation ... 2
1.3 Aims and objectives of the research ... 4
1.4 Research contribution and implications ... 6
1.5 Structure of the thesis ... 9
Chapter 2 Review of the literature and methodology ... 12
2.1 Introduction ... 12
2.2 Global stock market integration and opportunities for international portfolio diversification16 2.2.1 Early proponents of international portfolio diversification ... 16
2.2.2 Integration of financial markets ... 20
2.2.3 Tests on co-integration... 25
2.3 Return and volatility spillovers during crisis episodes ... 29
2.3.1 Defining contagion and the spillover effect ... 29
2.3.2 The ARCH-family models... 33
2.3.3 The Dynamic Conditional Correlation ... 36
2.3.4 Empirical evidence of contagion ... 37
2.4 Intra- and inter-regional return and volatility spillovers ... 40
2.4.1 Regional perspective ... 40
2.4.2 VAR framework ... 42
2.4.3 The meteor shower and heat waves hypotheses of Engle, Ito and Lin (1990) ... 44
2.4.4 Same day effect ... 45
2.5 Asymmetry in return and volatility transmission mechanisms ... 48
2.5.1 Key concepts and definitions ... 48
2.6. Forecasting of returns on financial markets ... 56
2.6.1 Predictability of returns ... 56
2.6.2 Signal extraction problem ... 59
2.6.3 Trading strategies and trading rules ... 63
2.6.4 International information transmission and efficient market hypothesis ... 66
2.7 Return and volatility spillovers across stock index futures ... 69
2.7.1 Lead-lag relationships between stock indices and stock index futures ... 69
2.7.2 Information transmission across futures markets ... 72
2.8 Literature gap ... 77
2.9 Chapter summary ... 82
Chapter 3 Research design and philosophical assumptions ... 83
3.1 Introduction ... 83
3.2 Philosophical assumptions ... 84
3.3 Research questions and research hypotheses ... 90
3.4 Designing quantitative research ... 96
3.5 Chapter Summary ... 98
Chapter 4 Data and preliminary analysis ... 99
4.1 Introduction ... 99
4.2 Data ... 100
4.2.1 Selection of countries and estimation period ... 100
4.2.2 Data collection ... 101
4.3 Estimation of return and volatility ... 106
4.4 Descriptive statistics ... 107
4.4.1 Stock index returns and volatility ... 107
4.4.2 Stock index futures returns and volatility... 110
4.5 Preliminary data analysis ... 113
4.5.1 Correlation coefficient estimation... 113
4.5.2 Unit root test ... 116
Chapter 5 Return and volatility spillovers across emerging and developed markets: evidence from stock indices and stock index futures ... 119
5.2 Methodology ... 121
5.3 Empirical results and discussion ... 124
5.3.1 Full-sample period ... 124
5.3.2 Subsample analysis: comparison of evidence from futures and spot markets ... 129
5.3.3 Intensity of return and volatility spillovers around the recent crisis episodes ... 136
5.5 Structural breaks ... 142
5.6 Chapter Summary ... 145
Chapter 6 Asymmetric return and volatility spillovers ... 147
6.1 Introduction ... 147
6.2 Methodology ... 149
6.2.1 Test on causalities ... 149
6.2.2 Data filtering ... 150
6.3 Asian markets as recipients of positive and negative shocks ... 155
6.3.1 Asymmetry in return spillovers across futures markets ... 155
6.3.2 Asymmetry in volatility spillovers across futures markets ... 161
6.4 European and South African markets as recipients of positive and negative shocks ... 168
6.4.1 Asymmetry in return spillovers across futures markets ... 168
6.4.2 Asymmetry in volatility spillovers across futures markets ... 172
6.5 American markets as recipients of positive and negative shocks ... 177
6.5.1 Asymmetry in return spillovers across futures markets ... 177
6.5.2 Asymmetry in volatility spillovers across futures markets ... 181
6.6 Chapter summary ... 185
Chapter 7 International information transmission mechanism and forecasting ... 187
7.1 Introduction ... 187
7.2 Methodology ... 188
7.2.1 ARDL Model ... 188
7.2.2 The bootstrap aggregating methodology ... 189
7.2.3 Forecast combining methodology ... 190
7.2.4 Forecast encompassing tests ... 192
7.2.5 Data and model specification ... 194
7.3 Individual ARDL model forecasts ... 195
7.3.2 Europe and Africa ... 199
7.3.3 The Americas ... 202
7.4 Forecast encompassing test ... 204
7.5 Chapter summary ... 213
Chapter 8 Discussion of findings and conclusion ... 215
8.1 Introduction ... 215
8.2 Summary of findings ... 216
8.2.1 Difference in patterns of information transmission ... 216
8.2.2 The asymmetry in return and volatility spillovers ... 218
8.2.3 Predictive power ... 221
8.3 Contribution and implications ... 226
8.4 Limitations to, and recommendations for, further research ... 229
List of Tables
Table 4.1Trading hours and time-zone description
Table 4.2 Expiration month symbol codes
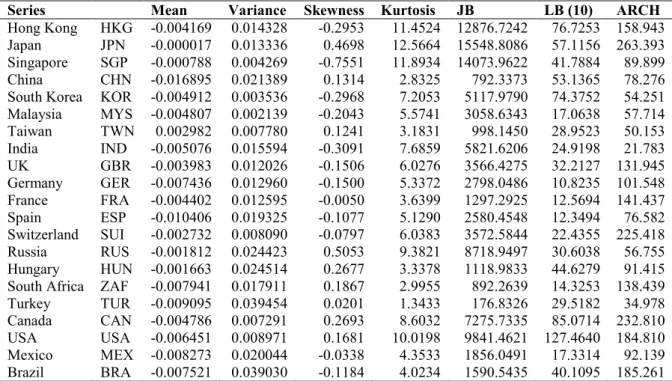
Table 4.3 Descriptive statistics of stock indices returns. Table 4.4 Descriptive statistics of stock indices volatility
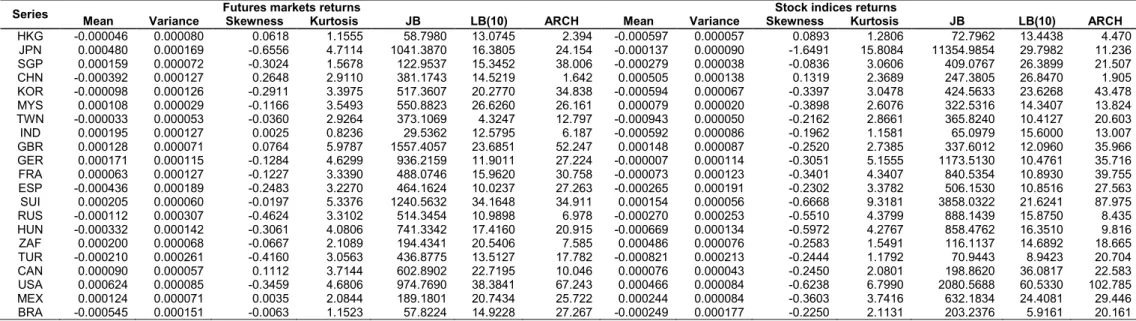
Table 4.5 Descriptive statistics for futures and spot market returns for subsample: 4 October 2010 - 3 October 2014
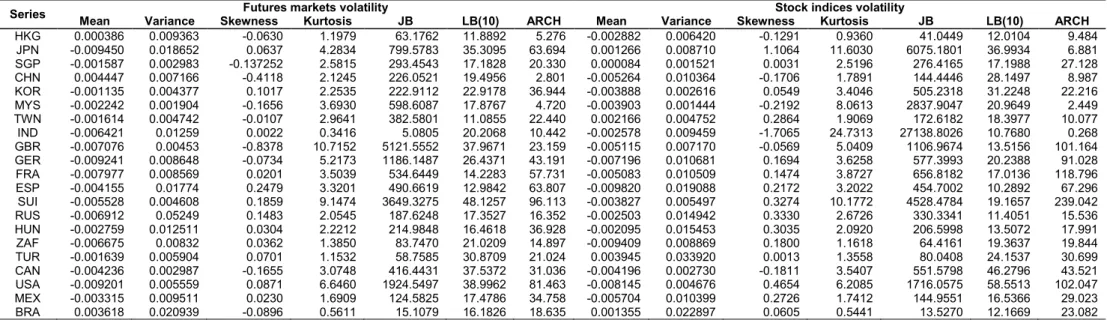
Table 4.6 Descriptive statistics for futures and spot markets volatility for subsample: 4 October 2010 - 3 October 2014
Table 4.7 Correlation coefficient matrix for futures returns Table 4.8 Correlation coefficient matrix for stock indices
Table 4.9 Stationarity test for stock indices and stock index futures returns, in-sample Table 5.1 Return spillovers across stock markets
Table 5.2 Volatility spillovers across stock markets Table 5.3 Return spillovers across stock index futures. Table 5.4 Volatility spillovers across stock index futures Table 5.5 Return spillovers across stock markets subsample Table 5.6 Volatility spillovers across stock markets subsample Table 5.7 Structural Breaks, full-sample
Table 5.8 Structural breaks, subsample
Table 6.1 Markets pairs with non-overlapping trading hours
Table 6.2 Channels of inter-regional return and volatility transmission Table 6.3 The asymmetric causality test results for returns, Asia
Table 6.4 The asymmetric causality test results for volatility, Asia
Table 6.5 The asymmetric causality test results for returns, Europe and Africa Table 6.6 The asymmetric causality test results for volatility, Europe and Africa Table 6.7 The asymmetric causality test results for returns, the Americas
Table 6.8 The asymmetric causality test results for volatility, the Americas
Table 7.1 Individual ARDL model forecasting results for 2014:10:03-2015:10:02 out-of-sample period, forecasting horizon =1, Asia.
Table 7.2 Individual ARDL model forecasting results for 2014:10:03-2015:10:02 out-of-sample period, forecasting horizon =1, Europe and Africa.
Table 7.3 Individual ARDL model forecasting results for 2014:10:03-2015:10:02 out-of-sample period, forecasting horizon =1, the Americas
Table 7.4 Forecasting and encompassing test results for the bagging model and combining method, out-of-sample period, forecasting horizon = 1, Asia.
Table 7.5 Forecasting and encompassing test results for the bagging model and combining method, out-of-sample period, forecasting horizon = 1, Europe and Africa.
Table 7.6 Forecasting and encompassing test results for the bagging model and combining method, out-of-sample period, forecasting horizon = 1, the Americas.
List of Figures
Figure 1.1 Thesis structure in relation to research aims Figure 2.1 Literature and methodology review
Figure 3.1 The matrix of social science by Burrell and Morgan (1979) Figure 3.2 Design of the quantitative research
Figure 4.1 Selection of countries
Figure 5.1 Subsample total spillovers plot: futures and spot markets Figure 5.2 Return spillover plot, stock indices, full-sample
Figure 5.3 Volatility spillover plot, stock indices, full-sample
Figure 5.4 Volatility spillover plot, Eurozone, stock indices, full-sample Figure 5.5 Intra-regional return spillovers plot
Figure 5.6 Intra-regional volatility spillovers plot Figure 6.1 Inter-regional information transmission Figure 8.1 Relative forecasting performance, Asia
Figure 8.2 Relative forecasting performance, the Americas Figure 8.3 Relative forecasting performance, Europe and Africa
List of Acronyms
ADF test - The Augmented Dickey-Fuller Test ANN - Artificial Neural Networks
ARDL Model – theAutoregressive Distributed Lag Model
ARCH -Autoregressive Conditional Heteroskedasticity
ASEAN -The Association of Southeast Asian Nations
BA – Bootstrap Aggregating (bagging)
BEKK model – acronym from Baba, Engle, Kraft and Kroner BRIC - Brazil, Russia, India, China
BRICS - Brazil, Russia, India, China and South Africa
BRIICKS - Brazil, Russia, India, Indonesia, China, South Korea and South Africa BRA - Brazil
CAN - Canada
CAPM - the Capital Asset Pricing Model CB- Combination Forecast
CHN – China
DCC – Dynamic Conditional Correlation DJIA – the Dow Jones Industrial Average index DST – Daylight Saving Time
EDC – European Debt Crisis
EFSF – the European Financial Stability Facility
EFSM - the European Financial Stabilization Mechanism EMH - Efficient Market Hypothesis
ESP - Spain
ETF- Equity Traded Funds
FIT – Foreign Information Transmission FRA – France
GARCH - Generalized Autoregressive Conditional Heteroskedasticity GBR – Great Britain
GER - Germany
GFC – Global Financial Crisis
GIPSI - Greece, Ireland, Portugal, Spain and Italy GMT – Greenwich Mean Time
HAR Model - Heterogeneous Autoregressive Model HKG – Hong Kong
HUN - Hungary
ICAPM - the International Capital Asset Pricing Model I-CAPM - the Intertemporal Capital Asset Pricing Model ICSS – the Iterated Cumulative Sum of Squares
IND - India
IPD – International Portfolio Diversification JPN- Japan
KOR - Korea
KPPS – acronym from Kwiatkowski, Phillips, Schmidt, and Shin MA- Moving Average
MEX - Mexico
MPT - Modern Portfolio Theory
MSCI –Morgan Stanley Capital International
MSFE – Mean Squared Forecast Error MST - Minimum Spanning Tree MFV – Multifractal Volatility MYS – Malaysia
NDC - Next-day correlation OLS – Ordinary Least Squares
P-P - Phillips-Perron unit root tests RUS – Russia
SDC - Same-day correlation SGP – Singapore
SHCI - the Shanghai Stock Exchange Composite Index SIC - Schwarz Information Criterion
SUI - Switzerland
SZCI - Shenzhen Stock Exchange Component Index
TGARCG- Threshold Generalized Autoregressive Conditional Heteroskedasticity TUR - Turkey
TWN – Taiwan
UEDCC - Unrestricted Extended Dynamic Conditional Correlation USA – United States of America
VAR – Vector Autoregressive WLS – Weighted Least Squares
WTC –Wavelet Coherence
Acknowledgements
I am grateful to my Lord Jesus Christ for His mercy and to allow me to go through all difficulties and challenges and to produce this piece of work.
I would like to thank my supervisors Professor Janusz Brzeszczynski and Dr. Chi Keung Marco Lau for their support and valuable recommendations.
I wish to thank my mom, Nina, dad, Alexander, and my sister, Daria, for their love and encouragement at every stage of my PhD.
I am grateful to Team Northumbria for their support and exciting sporting experiences that have brightened my student life.
I would like to thank Dr. David Grundy for supporting me at a difficult time, and to Dr. Roman Stepanov and Dr. Andrey Yukanaev for their help at the very beginning of my academic journey.
Declaration
I declare that the work contained in this thesis has not been submitted for any other award and it is entirely my own work. I also confirm that this work fully acknowledges opinions, ideas and contributions from the work of others. Any ethical clearance for the research presented in this thesis has been approved.
Approval has been sought and granted by the Faculty Ethics Committee on 28/01/2014
Part of the empirical results has been published in the following paper:
Yarovaya, L., Brzeszczynski, J. and Lau, C.K.M. (2016). Intra- and inter-regional return and volatility spillovers across emerging and developed markets: Evidence from stock
indices and stock index futures, International Review of Financial Analysis, 43, 96-114.
I declare that the Word Count of this thesis is 80311 words.
Name: Larisa Yarovaya
Signature:
Chapter 1 Introduction to the thesis
1.1 Introduction
The issues of return and volatility spillovers across international financial markets have become critically important due to the increased integration of emerging markets in the world economy. Although much has been written about the economic and financial linkages between stock markets, the globalization and liberalization processes keep altering the geography of financial interconnectedness, suggesting that this topic is still
relevant today and requires further consideration. Hence, this thesis investigates the
dynamic of return and volatility spillovers between stock markets contributing to the contagion, international portfolio diversification (IPD), and predictability literature. Furthermore, the analysis of information transmission mechanisms has important practical implications, which makes this research particularity relevant to practitioners and policy makers.
This chapter is organized as follows:
Section 1.2 discusses the main sources of motivation to conduct the research on international return and volatility transmission. It also provides the research background of the thesis, discussing the most influential journal articles in this area.
Section 1.3 demonstrates the relevance of the research topic and presents the aims and objectives of this thesis.
Section 1.4 discusses to what extent this thesis is different from previous studies and how current research contributes to existing knowledge.
1.2 Research background and motivation
The background literature is vast. However, the drive to further augment the existing empirical evidence on information transmission mechanism is motivated by a few specific, but influential, papers that investigated the issue of cross-market information conveyance. This section focuses on these articles.
The first primary source of motivation for this research is the paper by Engle, Ito and Lin (1990), that introduced the ‘heat wave’ and ‘meteor shower’ hypotheses which were then further analysed by Baillie and Bollerslev (1990), Melvin and Hogan (1994) and Melvin and Peiers Melvin (2003), among others. The effect of meteor shower manifests itself in a situation when a volatile day on one market is followed by a volatile day on the other market. While heat wave effect suggests that a volatile day on one market is likely to be followed by a volatile day on the same market (Ibrahim & Brzeszczynski, 2009). Particularly, the meteor shower effect has been hypothesized and tested by many authors in order to extract signals transmitted from foreign markets that can be used in forecasting
future returns on the domestic markets (e.g., Henriksson & Merton, 1981; King &
Wadhwani, 1990; Hamao et al., 1990; Ito, Engle & Lin, 1992; Melvin & Melvin, 2003; Ibrahim & Brzeszczynski, 2009, 2012; Ye, 2014; Strohsal & Weber, 2015). However, Ibrahim and Brzeszczynski (2009) claimed that there is a lack of evidence in this topic area on the relative strength, direction and stability of the heat-wave-like and meteor-shower-like region-specific or inter-regional transmission of returns. Furthermore, Chapter 2 of this thesis identifies the fact that there is a lack of research investigated information transmission mechanisms employing alternative data to that of equity indices. This thesis aims to fill this gap in knowledge and to provide evidence from both stock indices and stock index futures.
The next sources of motivation are the papers by Koutmos and Booth (1995),
Segal, Shaliastovich and Yaron (2015),Strohsal and Weber (2015), Baruník, Kočenda, and
Vácha (2015), Kundu and Sarkar (2016), all of which inspired the analysis of the
conveyance of both positive and negative return and volatility shocks which forms the main content of this thesis. This analysis provides the evidence on asymmetry in spillover effects that have not been widely discussed in this topic area to date, in contrast to the
concept of asymmetric volatility (e.g., Nelson, 1991; Bekaert & Wu, 2000). The
and volatility spillovers by utilizing both emerging and developed stock index futures was appealing due to the lack of similar relevant research in this topic area.
New methodological developments in analysis of return and volatility transmission have also proved to be one of the sources of motivation for this thesis. The paper by Rapach and Strauss (2010) was particularly inspirational in this regard in that it led to the employment of the bootstrap aggregating and combination forecasts methods to further test the relevance of foreign information transmission between markets by assessing the predictive power of stock index futures returns. In previous literature, the Rapach and Strauss (2010) methodology, which is discussed in detail in Chapter 7, has been applied to the large number of macroeconomic predictors but has not been tested in the context of the international return and volatility transmission across stock index futures as yet.
This thesis is also justified by the need to provide global evidence on information transmission mechanisms that are being accessible to a wide variety of practitioners. Therefore, the methodology employed had to generate the results and be presented in a clear way to allow the reader to interpret and understand the main channels of transmission
and to employ the results in practice. The Spillover Tables suggested by Diebold and
Yilmaz (2009, 2012) provide useful tools to summarize the evidence for a large group of markets and display both intra- and inter-regional spillovers clearly. Furthermore, the DY framework employed in this thesis plots the dynamic of spillover, over the estimation period, and allows the linkage of the Total Spillover trend to key economic events. Consequently, the findings of this thesis can be easily understood, not only by econometricians and experts in international finance, but also by academics from other fields (which suggests the potential to employ the results in multidisciplinary studies), students at different levels and practitioners from diverse backgrounds.
1.3 Aims and objectives of the research
The primary goal of this thesis is to enhance the understanding of return and volatility transmission mechanisms across emerging and developed financial markets. More specifically, the aims and objectives of this study are specified below:
1. To analyse the differences in patterns of return and volatility spillovers across emerging and developed stock market indices and across stock index futures:
to investigate the return and volatility spillovers between emerging and
developed stock markets, employing the stock indices data of 21 emerging
and developed markets, for the full-sample periodfrom 03 October, 2005 to
03 October, 2014;
to investigate the return and volatility spillovers between emerging and
developed stock markets, employing the stock indices data of 21 emerging and developed markets, over the subsample period from 04 October, 2010 to 03 October, 2014;
to compare the intensity and dynamic of spillovers for both the return and
volatility across stock indices and stock index futures over the subsample
periodfrom 04 October, 2010 to 03 October, 2014;
to analyse and discuss the differences obtained for returns and volatilities;
to plot the Total Spillover index for both futures and spot markets and link
the dynamic of spillovers with key economic events;
to plot the Total Spillover index for each region to provide a regional
perspective of cyclical movements of total return and volatility spillovers;
to analyse and discuss the results in relation to previous studies.
2. To investigate the asymmetry in return and volatility spillovers across futures markets with non-overlapping stock exchange trading hours:
to identify the market pairs with non-overlapping trading hours;
to employ an asymmetric causality test for stock index futures returns of
market pairs with non-overlapping trading hours;
to employ an asymmetric causality test for stock index futures volatilities of
to evaluate the number of cases suggesting asymmetry in spillovers for all market pairs from each region;
to summarize the evidence on asymmetry in spillover effects;
to discuss the results in relation to previous studies.
3. To evaluate the ability of foreign information contained in stock index futures returns to forecast returns on the domestic market:
to generate an individual out-of-sample forecast for all combinations of the
markets, i.e. with and without overlap in trading hours;
to compare the accuracy of individual out-of-sample forecasts with the
autoregressive (AR) benchmark model forecasts using the reduction in mean squared forecast error (MSFE) as a criterion;
to conclude which foreign markets are better predictors for returns for each
market in the sample;
to employ bootstrap aggregating (BA) methodology to generate
out-of-sample forecasts of futures markets (taking the period from 04 October, 2014 to 02 October, 2015 as the out-of-sample estimation period);
to compare the accuracy of the BA forecasts with the AR benchmark model
forecasts using the reduction in MSFE as a criterion;
to employ various combination forecasts (CB) to generate an out-of-sample
forecast for each market in the sample;
to compare the accuracy of the CB forecasts with AR benchmark model
forecasts using the reduction in MSFE as a criterion;
to compare the relative forecasting performance of the BA model over
various other combination forecasts methods employed;
to conduct forecast encompassing tests to compare the influential power of
information contained in BA and CB forecasts;
1.4 Research contribution and implications
There are various fields of literature to which the analysis of international information transmission is related, for example the literature on international portfolio
diversification (IPD), financial contagion, stock market integration, and predictability.The
analyses of the meteor shower hypothesis (Engle et al, 1990) have implications to the predictability of equity returns (see, e.g., Ibrahim & Brzeszczynski, 2009; 2012), which may challenge the efficient market hypothesis (EMH). Indeed, although the spillover effect and increased correlation between markets limits the benefits of IPD, the conveyance of information between markets can generate buying and selling signals. These can then be used in practice for the creation of a trading strategy able to outperform the market. Therefore, information transmission mechanisms provide the opportunity to forecast the behaviour of return and volatility of the markets which are susceptible to foreign shocks. The analysis of the dynamic, intensity and direction of return and volatility spillovers should be extended to analysis of the transmission of positive and negative shocks across markets and, moreover, to the assessment of the predictive power of foreign information.
This thesis augments the existing literature in several important areas. First, this thesis provides evidence of the patterns, asymmetry and predictive power of spillover effects across stock index futures, which distinguishes this research from the majority of the previous studies that utilized only equity indices data. The employment of futures data in analysis of information transmission has more realistic practical implications, since the futures contracts are actually tradable instruments and attractive for investors due to the relatively lower costs of trading on financial futures than managing a portfolio of
constituent stocks. This thesis is original and differs from previous studies in that it
provides international evidence on the issues of information transmission mechanisms (i.e., contagion, asymmetry, predictability etc.) using alternative data to that derived from equity indices.
Second, this thesis adds to existing knowledge by comparing the patterns of intra- and inter-regional spillovers across stock index futures with the patterns of spillovers across equity indices, something which has not been explained before. The study utilized data from 21 emerging and developed markets from four geographical regions: Asia, the Americas, Europe and Africa. While the existing literature on the meteor shower
hypothesis is restricted to analysis of the largest developed marketsof the USA, Japan and
investigating the spillovers effect in a sample which is not restricted to developed markets (see, e.g., Worthington & Higgs; 2004; Syriopoulos, 2007; Diebold & Yilmaz, 2009, 2012; Singh, Kumar & Pandey, 2010; Beirne et al, 2013; Beirne & Fratzscher, 2013; Cho, Hyde & Nguyen, 2014). Consequently, the study provides implications for international portfolio diversification and provides evidence of return and volatility transmission between emerging and developed financial markets.
According to Modern Portfolio Theory (MPT), introduced by Markowitz (1952), minimization of the volatility of a portfolio can be achieved by combining negative correlating assets. The observed historically low correlation between emerging and developed stock markets revealed the opportunities for improving the risk-return position of a portfolio by including emerging stocks in it (Levy & Sarnat, 1970). However, it has been established that correlation between emerging and developed stock markets increased dramatically in the last decades, diminishing the opportunities of IPD for investors (e.g., Erb, Harvey & Viskanta, 1994; Longin & Solnik, 1995, 2001). This thesis has utilized the most recent data available to date and provides the most recent evidence on the new geography of financial market interconnectedness which is highly significant for portfolio management. It also takes into account the constantly changing correlation structure among markets. Due to the fact that this thesis employed alternative data from equity indices which, in practice, are not easily investable assets, the results have significant practical implications, especially for investors that have diversification as a goal.
Third, this thesis analyses the intensity and dynamic of spillovers across the most recent crisis episodes, i.e. the Global Financial Crisis (GFC) and the European Debt Crisis (EDC), and so contributes to contagion literature. The intensification of spillovers across markets during crisis periods can limit the opportunities for global diversification, and may also destabilize the markets in other regions, threatening global financial stability. Therefore, the results of this research are important for policy makers and financial regulators. Furthermore, the thesis goes beyond the investigation of the intensity of spillovers during periods of turmoil and tranquillity and also analyses the transmission of negative and positive returns and volatility shocks across markets with non-overlapping trading hours, providing the evidence from stock index futures data. In addition, this thesis contributes to the literature by providing an empirical investigation of the relatively unexplored concept of asymmetry in return and volatility spillovers across markets, providing new evidence on stabilizing and destabilizing spillover effects.
Finally, since the analysis of the meteor shower effect has implications on return predictability (Ibrahim & Brzeszczynski, 2009), this thesis demonstrates that the international return spillovers can be used as predictors of domestic stock market returns. The present research compares the forecasting performance of the individual autoregressive distributed lag (ARDL), bootstrap aggregating (BA) and combination (CB) models over the autoregressive (AR) benchmark providing the evidence for a large number of markets and predictors. Furthermore, it employs a forecast encompassing test to evaluate the usefulness of the information contained in both BA and CB models for the prediction of futures returns. The returns of stock index futures of 21 markets is also utilized, providing international evidence as to the predictive power of futures returns that, so far, does not have the analogues in the literature.
1.5 Structure of the thesis
While Chapter 1 highlights the aims and objectives, relevance, motivation and
contribution of the research, the remainder of the thesis is organized as follows:
Chapter 2 presents a review of the core literature on return and volatility transmission and describes the most commonly used econometric methods that have been employed by researchers investigating stock market linkages and information transmission mechanisms.
Chapter 3 presents a discussion of research philosophy and research design employed in this thesis and highlights the research questions and research hypotheses which have been tested. It also presents the research design of this study, and explains the process of new knowledge creation.
Chapter 4 describes data and presents the results of the preliminary data analysis, i.e. tests on the stationarity of data and cross-market correlation. It also discusses data collection issues.
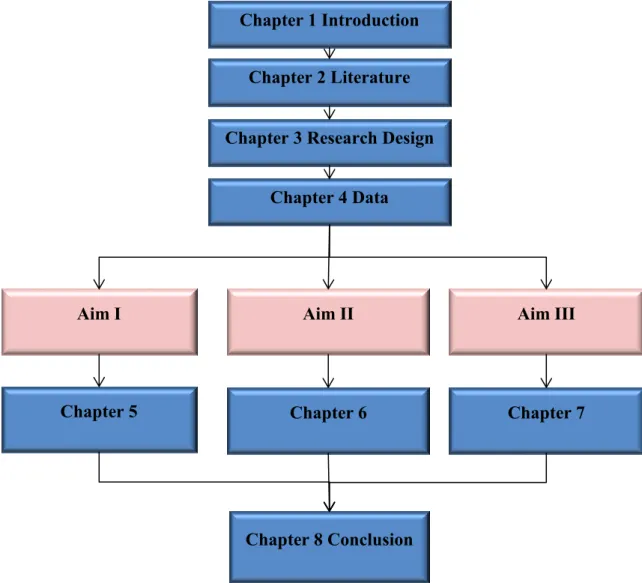
Chapter 5, 6 and 7 are three empirical chapters structured in accordance with the articulated aims and objectives.
Figure 1.1 illustrates the logical linkages between the empirical analysis carried out and the aims of this research.
Figure 1.1 Thesis structure in relation to research aims.
Chapter 5 investigates the differences in patterns of return and volatility spillovers across 21 emerging and developed stock market indices and across stock index futures utilizing the Diebold and Yilmaz (2009, 2012) methodology. It compares the intensity and dynamic of spillovers for both the return and volatility across stock indices and stock index
futures over a subsample estimation period from 04 October, 2010 to 03 October, 2014.
Chapter 5 also plots the Total Spillover index for both futures and spot markets, linking the dynamic of spillovers to key economic events. This provides evidence on intra- and inter-regional information transmission across financial markets, taking into account structural breaks in variances.
Chapter 6 explores asymmetry in return and volatility spillovers across futures markets with non-overlapping stock exchange trading hours. The chapter identifies market
Chapter 1 Introduction
Chapter 2 Literature
Chapter 3 Research Design
Chapter 4 Data
Aim I Aim II Aim III
Chapter 5 Chapter 6 Chapter 7
pairs with non-overlapping trading hours and employs an asymmetric causality test by Hatemi-J (2012) for stock index futures returns and volatilities separately, and explores stabilizing and destabilizing volatility spillover effects.
Chapter 7 analyses the ability of foreign information, contained in stock index
futures returns, to forecast returns on the domestic market. The performance of individual out-of-sample forecasts for all combinations of markets, i.e. with and without overlap in trading hours, is compared with the AR benchmark using reduction an MSFE ratio as criterion. The chapter follows the Rapach and Strauss (2010) paper which employs a similar methodological framework in the context of the predictive power of international stock index futures returns. There is also an evaluation of the relative forecasting performance of the BA-model over various combination forecast methods employed using the MSFE criterion. Furthermore, Chapter 7 conducts the forecast encompassing test to compare the influential power of information contained in BA and CB forecasts.
Chapter 8 summarizes the findings of the empirical chapters to address the research questions and tests the hypotheses put forward It also highlights the contribution and implications of the empirical results for existing knowledge. Finally, Chapter 8 discusses the limitations of this thesis and provides direction and suggestions for further research.
Chapter 2 Review of the literature and methodology
2.1 Introduction
The question of stock market interlinkages has already been considered in many studies in the finance area. The structuring of the literature review presented in this thesis is informed by the main literature surveys in this topic area (e.g., Gagnon & Karolyi, 2006). The review starts with the earliest pioneering studies which formed the theoretical basis of the research and continues to cover the most recent studies which provided empirical evidence on information transmission mechanisms. The aims and objectives of the research indicate the need to evaluate different strands in the literature to demonstrate the place of this specific research within existing knowledge. Since the contemporary theoretical and empirical evidence of each literature field covering the issues of return and volatility transmission is very rich, this chapter cannot be a fully comprehensive review of every article published on the topic. Therefore, the main purpose of this chapter is to provide an overview of the core and key literature on information transmission
mechanisms across international financial markets. The chapter focuses on the seminal
papers, which are the most influential in the topic area and significant for the present research, based on the fact that these papers provided contextualisation of the main theoretical concepts, and proposed the key methodologies, actively employed by researchers
Besides the papers framing the intellectual basis of this research, the chapter also discusses the empirical evidence provided by recent studies on return and volatility transmission. Preference was given to those papers that included analysis based on similar aims and objectives, utilised the same or a similar selection of countries (i.e. evidence for Asia, Europe, Africa and the Americas markets are of interest), and a similar time period
examined in this thesis. More specifically, the chapter particularly focuses on the data
employed by existing empirical studies; firstly, whether developed or emerging markets are considered (or a combination of both, which is the most desirable); secondly, whether stock index data or stock index futures data are used (or a combination of both); and thirdly, whether the estimation period covers the most recent crisis episodes, i.e. The Global Financial Crisis and the European Debt Crisis.
The review of the background literature provides an explanation for the existing gaps in knowledge and supports the need for, and relevance, of this research. The literature review highlights the importance of the research questions and explains the terminology used in the specification of the research hypotheses discussed in Chapter 3. Furthermore, this chapter discusses the main methodologies and econometric techniques employed by researches within this topic area, explaining the choice of methods used in the empirical analysis conducted in this thesis.
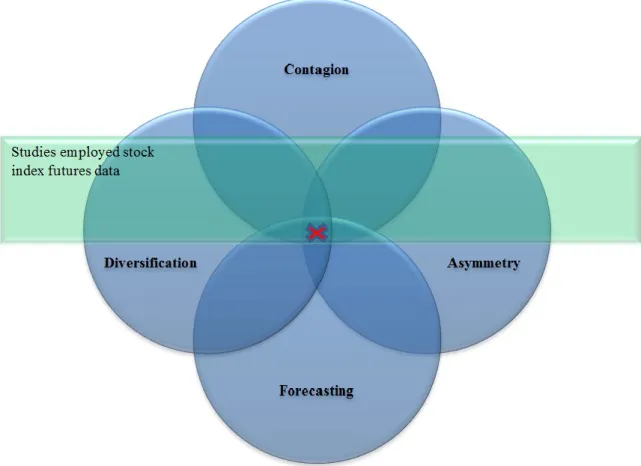
Although, as mentioned earlier, this literature review was informed by seminal literature surveys in the topic area, Figure 2.1 shows that this chapter forms an original, and customized, literature survey based on logical reasoning and philosophical beliefs of the author of this thesis. For instance, Andersen and Bolleslev (1997, p.117) divided existing literature into three categories. The first group of studies analysed the interrelation between returns in geographically separated financial markets that trade sequentially, while the second group of studies is concerned with the lead-lag relations between two or more markets that trade simultaneously. A third group of studies investigates the role of information flow and other microstructure variables as determinants of intraday return volatility. Another classification is provided in the notable literature review by Gagnon and Karolyi (2006). First, they divided early papers on international portfolio diversification into the three categories: i) studies motivated by the mean-variance introduced by Markowitz (1952), which investigate the potential benefits of international diversification; ii) studies analysing the structural patterns in international financial market co-movements; iii) studies focusing on the lead-lag relationships between international markets. Gagnon and Karolyi (2006) further split the third category, i.e. studies on lead-lag relationships across markets, according to data sample and data frequency employed in the analyses. This chapter structures the background literature differently in order to match the aims and objectives of the research and provides an overview of diversification, contagion, asymmetry, and forecasting literature fields focusing on the data utilised in existing papers. Figure 2.1 illustrates the literature fields covered in literature survey in the formation of the theoretical background to the present research:
Figure 2.1 Literature and methodology review.
The remainder of the chapter is organised as follows:
Section 2.2 discusses the pioneer studies on international portfolio diversification and global stock market interconnectedness which form the theoretical basis for this thesis. These studies employed the most commonly used methods and techniques to investigate correlation, co-integration and causal linkages across global financial markets. This section focuses on the integration of developed and emerging markets to explore the diversification opportunities, and challenges, of investing in emerging stock markets.
Section 2.3 presents studies investigating the behaviour of stock market interconnectedness around periods of economic turbulence. This section also defines the terms contagion and spillover effect used in this thesis. Furthermore, this section includes both contagion papers and papers investigating the intensity of return and volatility spillovers around crisis episodes.
Section 2.4 discusses literature that analysed the asymmetry in causal linkages across markets, providing an overview of the most popular methodologies used in this field. This section also defines the term asymmetry in spillover effect used in this thesis.
Section 2.5 discusses literature on intra- and inter-region return and volatility spillovers to capture the global perspective on the investigated phenomena. This section explains the Meteor Shower and Heat Waves hypotheses by Engle et al (1990) and other studies that investigated return and volatility transmission across markets with non-overlapping trading times.
Section 2.6 investigates the predictability literature and sheds light on the practical significance of foreign information transmission mechanisms. It also discusses how investigation of return and volatility transmissions across emerging and developed stock markets can contribute to studies on stock market efficiency.
Section 2.7 provides an overview of studies using data alternative from stock market indices in the analysis of global return and volatility transmission, i.e. stock index futures.
Section 2.8 highlights the literature gap, based on a discussion of relevant studies and methods, to justify the necessity of this research.
2.2 Global stock market integration and opportunities for international portfolio diversification
2.2.1 Early proponents of international portfolio diversification
One of the main issues faced by individual investors and financial institutions is how to allocate their wealth among assets available in the market. The complexity of this problem increases if investors aim to diversify their portfolios globally. Modern Portfolio Theory (MPT) introduced by Markowitz (1952, 1959) aims to find an optimal portfolio in a situation where the investor is informed about return distribution over a specific time period. Markowitz (1952) formulated the portfolio problem as a choice of the mean and variance of a portfolio of assets. In the context of the Markowitz portfolio theory, investors should optimise the weighting of assets in a portfolio with regard to the expected rate of return and volatility. Tobin (1958) contributed to Portfolio Theory by the introduction of Efficient Frontier. The process of investment choice involves two parts: “first, the choice of a unique optimum combination of risky assets; and second, a separate choice concerning the allocation of funds between such a combination and a single riskless asset” (Sharpe, 1963, p.426). Based on individual risk-return preferences investors can choose the combination of assets in their portfolio from market efficient frontier. The important message of portfolio theory is that investors could not consider the individual characteristics of a single security without understanding how this asset will be co-moved with other securities (Elton & Gruber, 1997). These co-movements of assets entail the possibility of constructing the portfolio with a desirable rate of return and lower variance rather than any individual security, which justifies the necessity of diversification. Elton and Gruber (1997) claimed that Modern Portfolio Theory (MPT) is the cornerstone in this topic area, despite all alternatives developed later, for two main reasons. First, the proponents argued that there is no evidence that adding additional data requirements to mean variance theory could improve the desirability of the portfolio selected. Second, MPT is well developed and implemented in practice, and mean variance theory is widely known and has a huge impact on academics and practitioners.
The measures of diversification benefits found natural implications in asset pricing, due to the fact that the consideration of diversification and dependence between assets should affect the price of risk in international markets (e.g., Chollete, de la Pena & Lu, 2012). The Capital Asset Pricing Model (CAPM) is built on the portfolio choice model by
Markowitz (1959). The CAPM introduced by Sharpe (1964) and Lintner (1965) signals the birth of asset pricing theory along with- parallel studies on CAPM presented, for example, by Mossin (1966) and Black (1972). The CAPM is widely used in measuring equity risk premium, estimating a firm’s cost of equity, evaluating the performance of diversified portfolios, and consequently has implications for stock market integration. Providing mathematical equations describing the relation between expected return and risk of asset, the CAPM model has become a basic theoretical model widely discussed in all finance textbooks as a fundamental model of portfolio theory. The Sharpe-Linter CAPM equitation can be described as follow:
𝐸(𝑅𝑖) = 𝑅𝑓+ [𝐸(𝑅𝑚) − 𝑅𝑓]𝛽𝑖𝑀, (2.2.1)
where 𝐸(𝑅𝑖) is the expected return from an asset 𝑖 (𝑖 = 1, … , 𝑁); 𝑅𝑓 is the risk free interest
rate, 𝐸(𝑅𝑚) is the expected market return and 𝛽𝑖𝑀 is the asset’s market beta.
The CAPM assumes first, that the investor agrees to the joint distribution of asset
returns from t-1 to t period of time. The second assumption is that borrowing and lending
is at a fixed risk-free rate and is available in the market for all investors, for any amount of funds involved in investment transactions (Fama & French, 2004). However, the list of simplifying assumptions of CAPM is not limited to these two, hence such assumptions as the normal distribution of returns, and the single-period problems of mean-variance theory, also entail further empirical problems (Fama, 1970). The notable paper by Fama and French (2004) provided a critical review of CAPM empirical records and tests of the model. Authors concluded that the problems with the model are serious enough to invalidate most applications of the CAPM. For example, Black, Jensen, and Scholes (1972), as well as Friend and Blume (1970), indicated failure of CAPM in the estimation of the cost of capital: for high beta securities the model’s forecasts are too high compared
with historical averages; for low beta securities they are too low. Many financial
economists, during the more than forty years of its existence, tried to improve the CAPM. For example, one of the logical extensions of CAPM is the intertemporal capital asset pricing model (I-CAPM) developed by Merton (1973). The main idea of Merton’s model was to capture dynamic effect while maintaining CAPM’s simplicity. In reality, the list of I-CAPM assumptions is not inferior in size to Sharpe-Lintner’s model, including such standard assumptions of the perfect market where investors could rebalance its assets continuously in time, ignoring transaction costs, taxes and further restrictions.
In order to predict the effectiveness of complex internationally diversified portfolios, the logic of CAPM had been transferred to a global perspective. The existing need to capture more factors that have an effect on expected returns of portfolio led to the appearance of the International Capital Asset Pricing Model (ICAPM), initially proposed by Solnik (1974), Merton (1980), Sercu (1980), Adler and Dumas (1983) and others. According to Bartram and Dufey (2001), ICAPM can be formally stated as:
𝐸(𝑅𝑖) − 𝑅𝑓 = 𝛽𝑖𝑤𝑅𝑃𝑤 + ∑𝑘=1𝐾 𝛾𝑖𝑘𝑅𝑃𝑘, (2.2.2)
where 𝑅𝑃𝑤 and 𝑅𝑃
𝑘 are the risk premia on the world market portfolio and the relevant
currencies, respectively, 𝑅𝑓 is the risk-free interest rate.
The ICAPM has, generally, been tested in terms of performance of a simulated trading strategy based on Markowitz’s mean-variance framework. The fact that a mean variance framework could not be assumed automatically without close monitoring of the stock markets limits the advantage provided by the simplicity of this framework. In an international context, a portfolio constructed according to the market capitalization of the
individual markets is not mean-variance efficient (Bartram & Dufey, 2001).
Lagoarde-Segot and Lucey claim that under financial integration, the domestic equity market
becomes part of the global equity market (2006). They make the point that “therefore
domestic assets are rewarded in function of their covariance with the world portfolio, as the risk premium on any asset is proportional to its world beta” (2006, p.19), thus highlighting the implications of ICAPM model to the measurement of financial market integration.
It was Grubel (1968) who first suggested that one country’s specific risk could be diversified through investing in different countries’ financial markets. The results also indicated that the allocation of assets across different countries would boost the performance of a US investor portfolio by increasing the annual rate of return from 7.5% to 12.6%. Solnik (1974) successfully demonstrated that investing in foreign securities can provide greater risk reduction than domestic diversification. These studies were based on the concept of constructing a diversified portfolio by including stock from international markets with a low or negative correlation with domestic markets. Therefore, the increased attention to emerging markets was a natural extension of the literature in this area. Correlation between emerging and developed markets was lower than among developed markets, providing benefits for international portfolio diversification. Levy and Sarnat (1970) considered 28 developed and emerging markets over the period 1951–1967 and
found that the inclusion of emerging stock in American investor’s portfolios improved the risk-return position. However, Brumelle (1974, p.473) argues that negative correlation is sufficient only if variables have “bivariate normal distribution or the investors have a quadratic utility function”. This author proves that negative correlation is neither necessary nor sufficient for diversification, while the form of dependence, involving the entire distribution of assets returns, is sufficient for diversification. A study by Brumelle (1974) is in line with earlier work by Samuelson (1967) which also discusses the need for restriction on joint distribution, in order to achieve diversification.
There are two main problems widely discussed in literature with assets joint distribution: heavy tails and tail dependence, where the former refers to marginal asset distributions, while the latter refers to the connection between asset distributions at extreme quantiles (Chollete et al., 2012). Both heavy tails and tail dependence can significantly affect the diversification features of the portfolio (e.g., Samuelson, 1967;
Brumelle, 1974; Ibragimov & Walden, 2007; Chollete et al., 2012). For example,
Ibragimov, Jaffee and Walden (2011, p.334) claim that “the higher the correlation and the heavier the tails of the risk distribution, the less beneficial risk-sharing is”.
The studies by Markowitz (1952, 1959), Tobin (1958), Samuelson (1967), Grubel (1968), Solnik (1974), and other early period scholars, inspired extensive research that investigated the interconnectedness of stock markets across the globe. However, while early papers indicated a stability of correlation between markets (e.g., Panton, Lessig, &
Joy, 1976;Watson, 1980), further papers reported that correlation changes with time (e.g.,
Longin & Solnik, 1995; Bekaert & Harvey, 1995; Cappiello, Engle & Sheppard, 2006). The correlation between financial markets was found to be increasing over time, which
was explained byCampbell and Hamao (1992), Roll (1992),Bracker and Koch (1999), to
name but a few, and was identified as a cause of increases in real economic linkages between markets. The instability of correlation structure and, consequently, the time-varying benefits of international portfolio diversification, were actively discussed in studies that considered equity market integration.
2.2.2 Integration of financial markets
Increasing financial market interconnectedness has been found to be consistent with
increasing equity market integration (e.g., Erb, Harvey & Viskanta, 1996; Forbes &
Rigobon, 2002; Hardouvelis, Malliaropulos & Priestley, 2006; Kearney & Poti, 2006), and is seen to be driven by markets forces (e.g., increasing international trade, increasing business cycle synchronization, low and convergent inflation and interest rates etc.) but
constrained by regulatory barriers (Aggarwal, Lucey & Muckley, 2010). Similar to the
correlation between financial markets, international equity market integration varies over time and among markets. It is a dynamic process which is often considered in literature within the context of increasing financial liberalization, globalization and economic development. According to the generic definition, as stated in Lagoarde-Segot and Lucey, (2006, p.17), the integration of financial markets means that “all potential market participants with the same characteristics (i) face a single set of rules when they decide to deal with financial instruments, (ii) have equal access to these financial instruments, and (iii) are treated equally when they are active in the market (Baele et.al, 2004)”. More specifically, increased financial market integration manifests itself in the absence of arbitrage opportunities among markets situated in different geographical regions. Therefore, integration of financial markets leads to an intensification of equity market interconnectedness at both intra-regional, and inter-regional, levels.
As the integration of the financial markets is not a uniform process that significantly progressed in time, many studies analyse integration utilizing various estimation periods and varying country selections, providing evidence from different methodologies. Due to the fact that integration is a dynamic process it is challenging to measure it. The study by Kearney and Lucey (2004) discussed different approaches to the investigation of integration. There are two main categories of measures that can be used to evaluate the integration of financial markets: direct measures and indirect measures. The first approach, i.e. direct measures, suggests evaluating the extent to which the rate of returns of financial assets, with the same maturity and risk characteristics, are equalized across financial markets. The direct measures approach is based on the so-called law of one price, following the logic that the lessening of regulatory barriers between markets will cause the distribution of capital flows to the most attractive asset classes across the globe, consequently equalising the returns on the assets with the same risk characteristics. However, the main challenge of this approach to measuring integration is to identify assets
that are sufficiently homogenous in terms of their risk profiles to make an adequate comparison of the equalisation of financial markets (Kearney & Lucey, 2004, p. 573). Examples of studies that employed the first approach includes, but is not limited to, Lewis (1999), Ayuso and Blanco (1999), and Coelho et al. (2007). The second approach, i.e. indirect measures, can also be divided into two categories. The former examines whether asset returns are a function of domestic or international factors, relying on the concept of international capital market completeness. The latter assumes equity market integration can be assessed through investigation, whether domestic investment is financed from world savings or from domestic savings. Examples of studies that used indirect measures include
Portes and Rey (2000) and Bekaert, Harvey, and Lumsdaine (2003). A more detailed
literature review of the measures of integration can be found in Kearney and Lucey (2004), Bekaert et al. (2003), and Goetzmann and Rouwenhorst (2005). However, both approaches to measuring integration are based on a similar idea, that is, the existence of unrestricted capital flow between markets, which naturally links to unrestricted information flow and the minimising of asymmetry of information.
The investigation of the information transmission mechanisms, including responses to the common macroeconomic shocks of the financial markets, as well as transmission of shocks occurring on one of the markets compared to other markets, are used as direct measures of integration as well. Generally, as it was claimed by Coelho et al. (2007, p.456) the direct approach is considered to be preferable among researchers, despite the complexity in finding reliable data and a method to prove the existence of integration. One of the methods used, for example, by Coelho et al (2007) is a rolling and recursive minimum spanning tree (MST) to assess the evolution of integration among 53 equity markets for the period from 1997 to 2006.
The MST is a graph of interconnected N nodes, where each of the nodes is a
variable that represents the return of equity indices from the selected data set. The MST methodology starts with minimising the sum of the distances between nodes that are measured by a correlation matrix of returns. First, the correlation coefficient is computed for all pairs of returns (𝑖, 𝑗) using the following equation:
𝜌𝑖𝑗 = 〈𝑅𝑖𝑅𝑗〉−〈𝑅𝑖〉〈𝑅𝑗 〉 √(〈𝑅𝑖2〉−〈𝑅𝑖〉2)(〈𝑅𝑗2〉−〈𝑅𝑗〉2)
, (2.2.3)
Second, each correlation coefficient is converted to a metric, i.e. the distance between pairs of returns:
𝑑𝑖𝑗 = √2(1 − 𝜌𝑖𝑗), (2.2.4)
where 𝑑𝑖𝑗 ∈ [0; 2], corresponding to correlation values 𝜌𝑖𝑗 ∈ [−1; 1], i.e. smaller values of
𝑑𝑖𝑗 imply high correlation. Third, these distances form the 𝑁 × 𝑁 distance matrix D, which
is used to construct the MST.
The MST methodology provides useful visualisation of the interconnectedness between large set of markets, that can be also applied dynamically to capture the evolution in patterns of stock market linkages over time. The results obtained by Coelho et al. (2007) show that the developed European countries have consistently constituted the most tightly linked markets among the countries in the sample. Further, the results have implications for international portfolio diversification indicating diminishing diversification benefits with time. However, due to the fact, that the correlation structure between markets is less likely to stay stable during the average holding period of portfolio investment, it makes sense to rebalance the assets in a portfolio to maximise the benefits of the diversification available in a specific time period (Coelho et al., 2007).
The fact the empirical results of integration tests suggests that there are implications for international portfolio diversification is not surprising, due to the meaning of integration assumed by the majority of studies. The increase in integration between financial markets will cause a reduction in diversification benefits. Besides, Aggarwal et al. (2010, p. 643) shows that increased integration can also have the following implications: i) the more complete the world’s capital markets are, the more robust the economies of individual states will be; ii) household savings rates will consequently change over time. While the former will have a generally positive impact on the economic
growth of a country, variability of household savings has a more uncertain impact. First,
the increased attractiveness of domestic stock investment may lead to restructuring of household expenditure, replacing the consumption on domestic stock market investment. Second, lessening regulatory barriers will encourage a search for more profitable investments on foreign markets, ultimately resulting in a higher mobilization of savings
(Oshikoya & Ogbu, 2003;Lagoarde-Segot & Lucey, 2006).
Kearney and Lucey (2004, p. 574) further divided the literature on financial integration into three categories, testing: i) the segmentation of equity markets via the
international CAPM (e.g.,Bekaert & Hodrick, 1992; Campbell & Hamao, 1992; Errunza, Losq, & Padmanabhan, 1992); ii) the extent, and determinants, of changes in the
correlation or co-integration structure of markets (e.g., Bernard, 1991; Gilmore &
McManus, 2002); and iii) time-varying measures of integration (e.g., Bekaert & Harvey,1995; Longin & Solnik, 1995; Forbes & Rigobon, 2002; Barari, 2004; Birg & Lucey, 2006; Aggarwal, Lucey, & Muckley, 2003, 2010). While the first two categories demonstrated limited attempts to measure the time-varying nature of integration, the third category of papers used more sophisticated methodologies to capture the dynamic linkages between markets.
For example,Birg and Lucey (2006) employed methodology proposed by Akdogan
(1996, 1997) and its further extension by Barari (2004), to measure global equity market integration based on the international risk decomposition model, where “integration scores are calculated as a fraction of systematic risk in total country risk vis-à-vis the global benchmark. This measures the contribution of a country’s market to global risk. Integration scores’ calculation involves the use of a country’s beta against the global benchmark portfolio” (Birg & Lucey, 2006, p.4). The findings demonstrate that developing European markets (i.e. Estonia, Hungary, the Czech Republic, Lithuania, and Poland) have become more integrated with both regional and global equity markets. The comparative examination of regional and world integration measures suggested by this methodology is highly important. Although a market can become less integrated with the world, its significance in a region may increase, consequently increasing the degree of regional integration, especially in the light of the formation of regional economic and political alliances (Birg & Lucey, 2006). However, recent evidence provided by Claus and Lucey (2012) shows that membership of a formal economic organization, such as ASEAN, does
not seem to increase stock market integration, thus “financial market liberalization is a
necessary, but not sufficient, condition for stock market integration” (p.149). While liberalisation tends to decrease some restrictions and barriers to capital, there are certain institutional barriers, for example taxes, that can restrict international capital flows and may cause stock market segmentation.
Another method proposed by Flood and Rose (2005a, b) suggests that markets are integrated if, at one point in time, the expected discount rates in different markets are equal:
where 𝑝𝑡𝑗 is the price at time 𝑡 of asset 𝑗 and 𝐸𝑡[] is the expectations operator conditional
on information available at time 𝑡; 𝑑𝑡+1 is the market discount rate for income accruing in
period 𝑡 + 1, or the marginal rate of intertemporal substitution; 𝑥𝑡+1𝑗 is the income received
at 𝑡 + 1by owners of asset 𝑗 at time 𝑡. Notation used as in Claus and Lucey (2012). Flood
and Rose (2005a, b) show that this methodology is consistent with intertemporal models of asset pricing, discussed in previous subsection.
The equation (2.2.5) can be rewritten as follows:
𝑥𝑡+1𝑗 𝑝𝑡−1𝑗 = 𝛿𝑡(( 𝑝𝑡𝑗 𝑝𝑡−1𝑗 ) + 𝛽𝑗 0+ ∑ 𝛽𝑖𝑓 𝑡𝑖 𝑚 𝑖=1 ) + 𝜀𝑡+1𝑗 , (2.2.6)
where 𝛿𝑡 ≡ 1/(𝐸𝑡[𝑑𝑡+1]), 𝜀𝑡+1𝑗 ≡ 𝑥𝑡+1𝑗 − 𝐸𝑡[𝑥𝑡+1𝑗 ], that is a predictor error, and a factor model with {𝛽𝑗} = {𝛽𝑗0, 𝛽𝑖}, i=1,…,m; 𝜀
𝑡+1𝑗 is white noise. The model also has the
following restriction:
𝐶𝑜𝑣[𝑑𝑡+1𝑥𝑡+1𝑗 ] = 𝛽𝑗0+ ∑𝑚 𝛽𝑖
𝑖=1 𝑓𝑡𝑖, (2.2.7)
where 𝛽𝑗0 is an asset specific intercept, 𝛽𝑖 is a set of m market-specific factor coefficients,
and 𝑓𝑡𝑖 is a vector of 𝑚 time varying factors.
This methodology has been employed by Claus and Lucey (2012) in their analysis of stock market integration across 10 emerging and developed markets in the Asia Pacific
region over the period April to May, 2006. The findings for Asian markets, i.e. Japan,
Hong Kong, Singapore, South Korea, Taiwan and Malaysia show higher degrees of
integration in the developed markets of Japan and Hong Kong, and lower in those of Singapore and the emerging markets of Taiwan and Malaysia. The results also show that emerging markets from the Asian region have a relatively lower degree of financial integration than those of developed markets.
Finally, since co-integration has an intuitive appeal to researchers of integration, a
significant number of studies have used cointegration measures to assess integration between markets (Kearney & Lucey, 2004, p. 576). Due to the fact that this literature is extensive it has been considered separately in the next subsection.